Improved clarity on available capacity

On a hot summer day in California, the system operators in the California ISO control room were preparing and reviewing their ability to meet the projected electricity demand for what’s known as the net peak time period, which occurs after sunset around 8-9 p.m.
By three in the afternoon, the operators concluded that we would be tight for the net-peak period, so they followed ISO emergency procedures and requested the Reliability Coordinator issue an Energy Emergency Alert level 1 (EEA 1). That would signify that the ISO was experiencing conditions where all available generation resources were committed to meet firm load, firm transactions, and reserve commitments, and was concerned about sustaining its required Contingency Reserves. The Reliability Coordinator agreed, issued the EEA1 and a public message was sent out.
But when people went to the California ISO website or the ISO Today mobile web shortly after, they saw that we had about 39 gigawatts (GW) of generation running, with more than 10GW of available capacity. The site also showed that peak demand for the day was forecasted to be about 43GW. The situation was confusing: 39GW of resources with 10GW available capacity should be able to easily cover the forecasted peak of 43GW.
The missing part of the story is that around 3 p.m. solar production for the ISO grid was about 10GW. But that solar production would reduce significantly when the sun started to set around 8pm. Another missing part of the story is that the ISO, like any other Balancing Authority in North America, is required to carry contingency reserve, which is approximately 6% of its demand, in this case about 2.4GW.
Recognizing the potential for continuing confusion, the ISO team has worked on an updated website and mobile app that will present a clearer picture of reliability and grid conditions. Our goal is to provide transparency, reduce confusion, and increase coordination with all of the ISO’s stakeholders.
The team worked together for a few months designing a new available capacity chart that shows not only current generation resources but also the available capacity for the next hour and the next four hours. The new chart, as seen in the accompanying illustration, also shows how much of those resources are utilized to meet required contingency reserves. People looking at the upgraded site and app will see a more complete picture of grid conditions and whether they’re comfortable or stressed given the different variables that come into play.
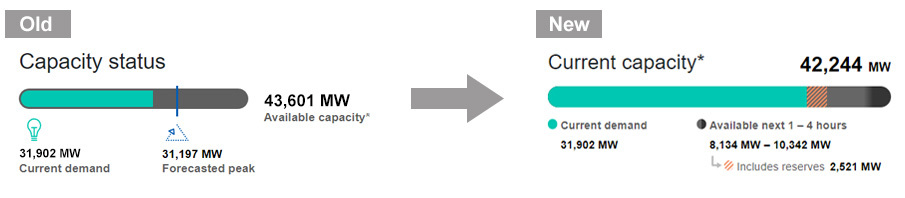
The reserve value shown includes the total capacity on the system that is not currently in use but available within 10 minutes, if needed, as required to meet the ISO’s contingency reserve requirement. All these values are calculated every 15 minutes.
Prior to rolling out this new chart on the Caiso.com website and in our ISO Today mobile app yesterday, Monday, June 6, 2022, the ISO conducted training for stakeholders before the changes were to go live. The information will provide a clearer focus for the public on available capacity that the ISO has to meet electricity demand while also satisfying our contingency reserve requirement. We hope and trust you will find the additional clarity helpful and we appreciate the strong work from the team that worked on this important upgrade.