Making it easier to track capacity
In a long-awaited breakthrough for our customers and stakeholders, the California ISO is now publicly posting a set of new graphs that show a more complete picture of how much capacity is on the system.
The ISO’s Today’s Outlook Demand webpage has been upgraded with the addition of “Resource adequacy capacity trend’ and “7-day resource adequacy capacity trend” graphs. The graphs have also been added to the ISO Today mobile app.
A visual display of Resource Adequacy (RA) capacity is an important tool to allow for better visibility of power supplies and shortfalls. The new graphs will be useful to stakeholders and industry observers because they can quickly see the amount of RA capacity that is available compared to the forecasted needs of the system.
RA capacity is the state-designated amount of megawatts (MW) required to be on hand for the reliable operation of the grid. The state started the program following the energy shortages in the early 2000s to help ensure there’s enough electricity to match expected demand. The California Public Utilities Commission (CPUC) manages the program.
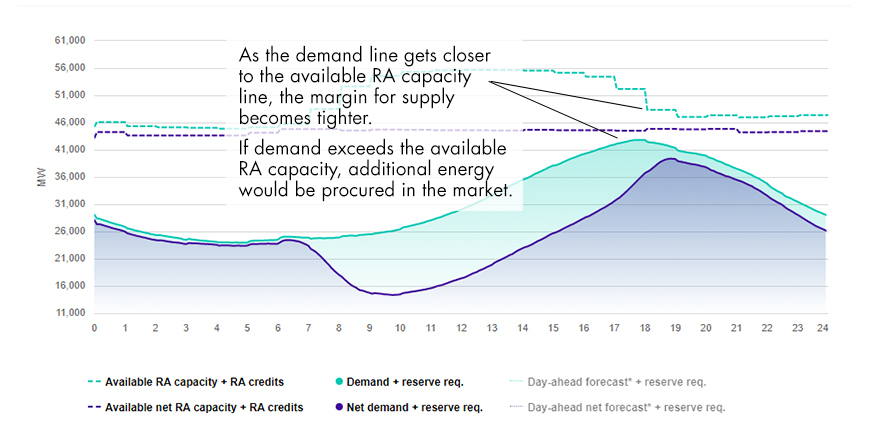
Energy providers are obligated to deliver the designated amount of capacity to the ISO grid. During times of stress on the electrical system, this capacity is what the grid is relying on to keep the power flowing. Any capacity needed above the RA amount must be procured in the market.
On high-demand days, the market may not be able to provide all the needed energy. During these times, the ISO depends heavily on imports from neighboring systems, so if the whole West is having to hold energy for any reason, we will run into challenges. We have already seen West-wide scorching heat and wildfires affecting transmission lines put pressure on our supplies.
The new graphs include net RA, which is RA capacity minus wind and solar resources. The net data show a more true reflection of what capacity is on the system during the two most critical times of the day – peak and net peak -- as the sun sets in the late afternoon and wind is often unreliable in hot weather, even when temperatures and demand remain high.
A high-level explanation and Q&A session to review these enhancements was conducted for customers on Tuesday, Aug. 24, 2021. Video of the webinar is available on the caiso.com website on the Learning Center page.