3 Market Performance Metrics
Day-Ahead Prices
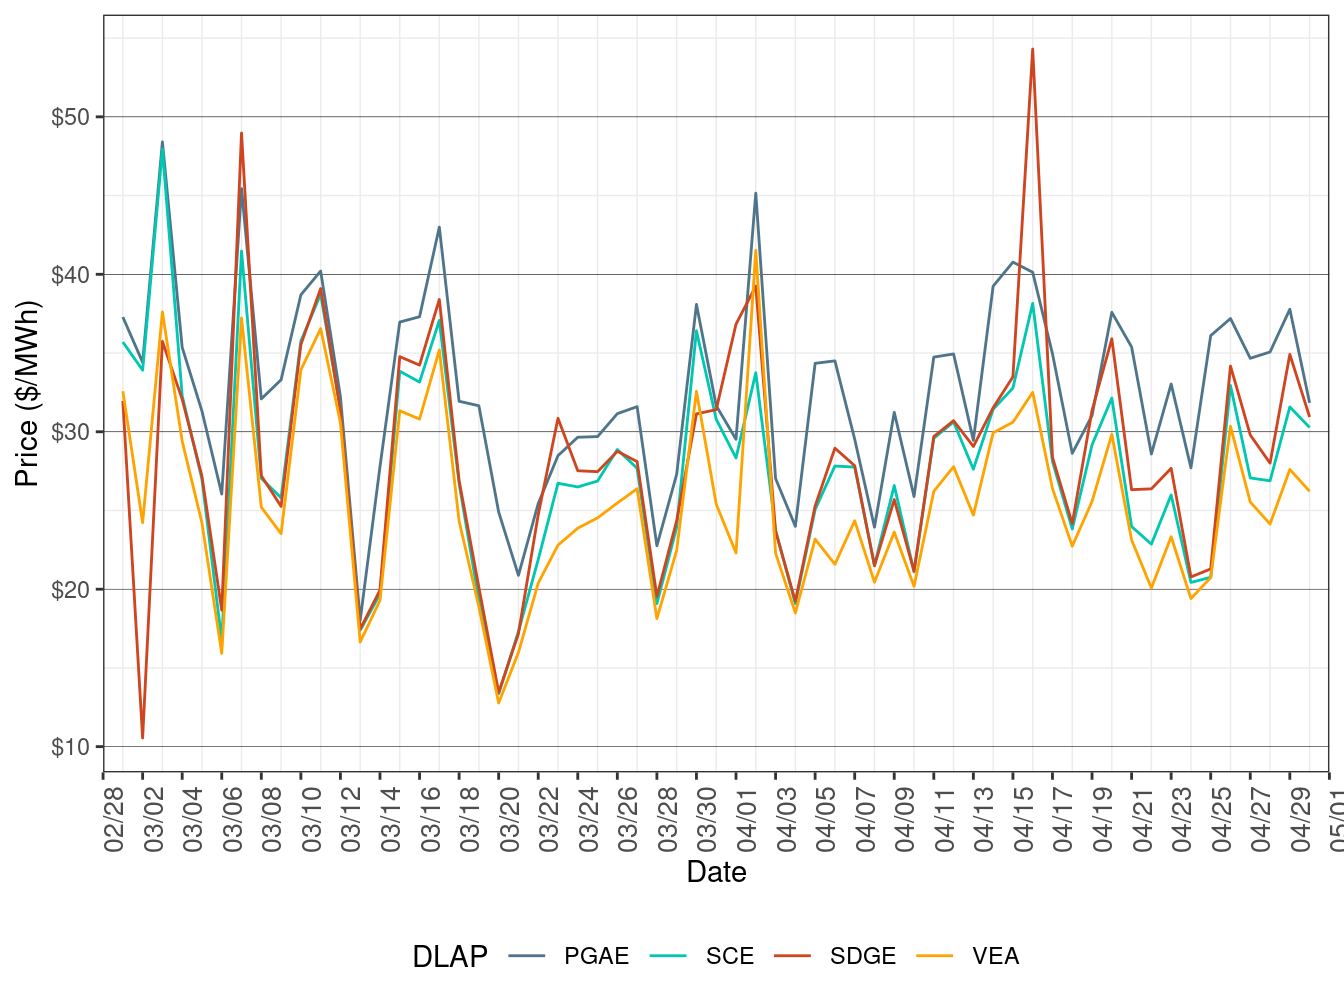
Figure 2 show the daily simple average load-aggregation points (LAP) prices for each of the four default LAPs (PG&E, SCE, SDG&E, and VEA) for all hours. TABLE 2 below lists the binding constraints along with the associated DLAP locations and the dates when the binding constraints resulted in relatively high or low DLAP prices.
Figure 2: Day-Ahead Simple Average LAP Prices (All Hours)
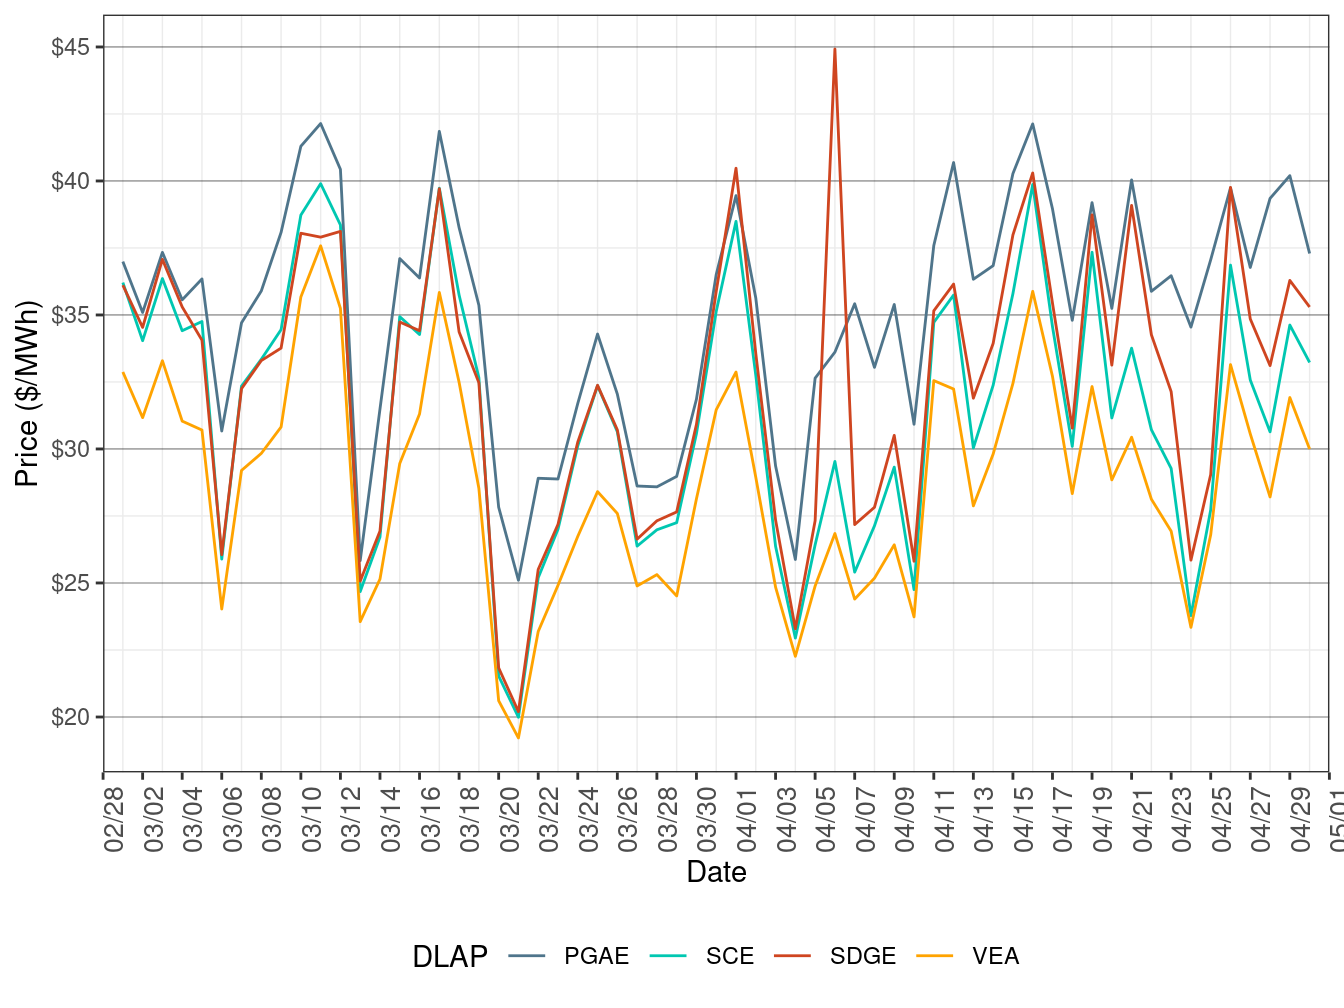
| DLAP | Dates | Transmission Constraint |
|---|---|---|
| SDGE | April 6 | SILVERGT-URBAN 69 kV line |
Real-Time Price
Figure 3 show daily simple average LAP prices for all the default LAPs (PG&E, SCE, SDG&E, and VEA) for all hours respectively in FMM. TABLE 3 lists the binding constraints along with the associated DLAP locations and the dates when the binding constraints resulted in relatively high or low DLAP prices.
Figure 3: FMM Simple Average LAP Prices (All Hours)
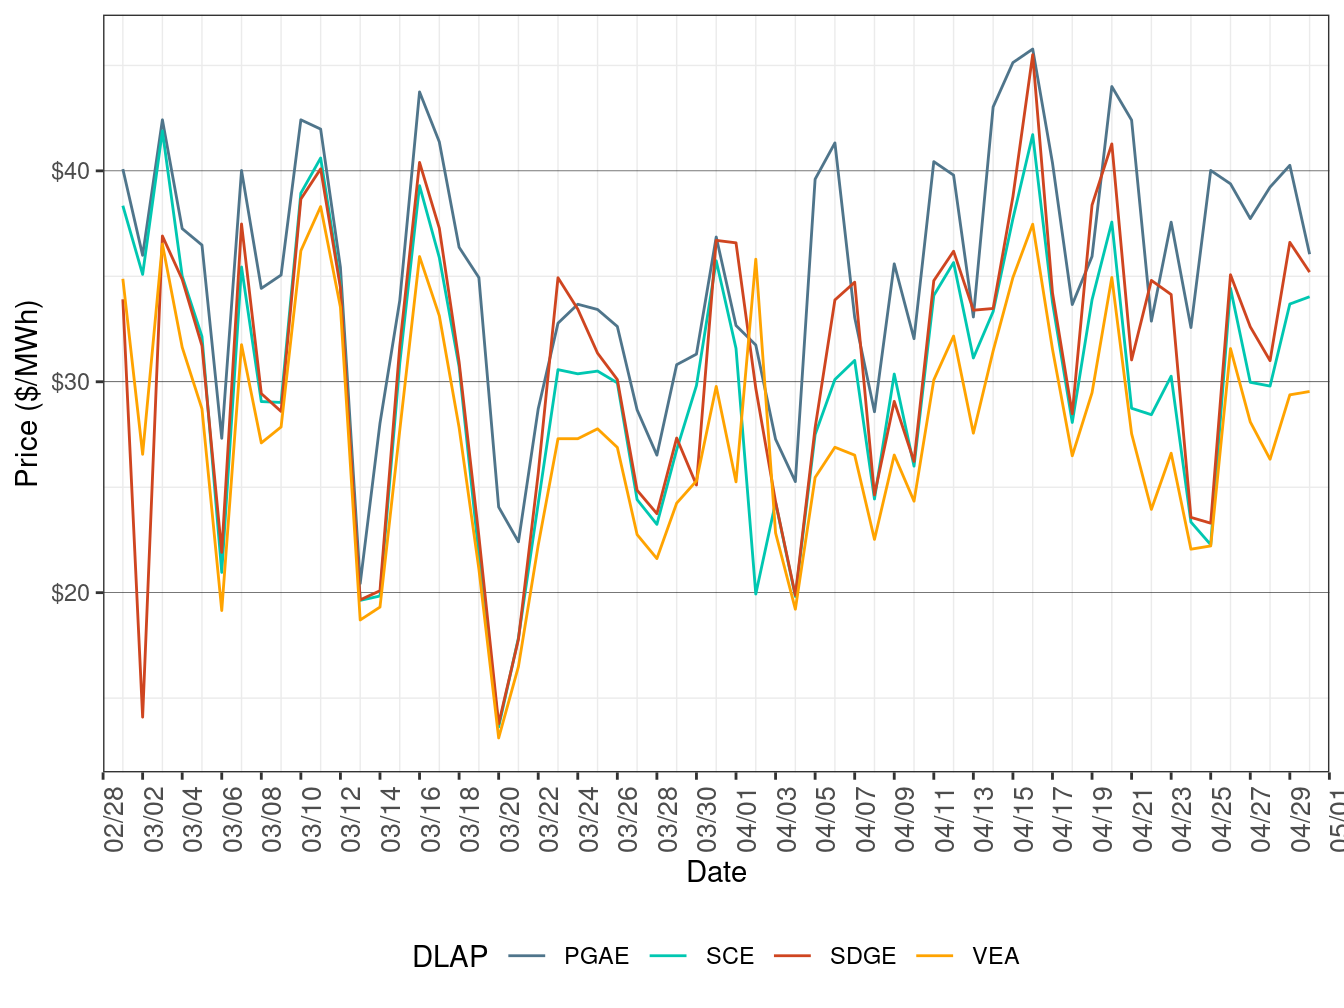
| DLAP | Dates | Transmission Constraint |
|---|---|---|
| PGAE | April 21 | GATES2-MIDWAY 500 kV line |
Figure 4 below shows the daily frequency of positive price spikes and negative prices by price range for the default LAPs in the FMM. The cumulative frequency of prices above $250/MWh edged up to 0.01 percent in April from 0 percent in March The cumulative frequency of negative prices decreased to 2.24 percent in April from 5.65 percent in March.
Figure 4: Daily Frequency of FMM LAP Positive Price Spikes and Negative Prices
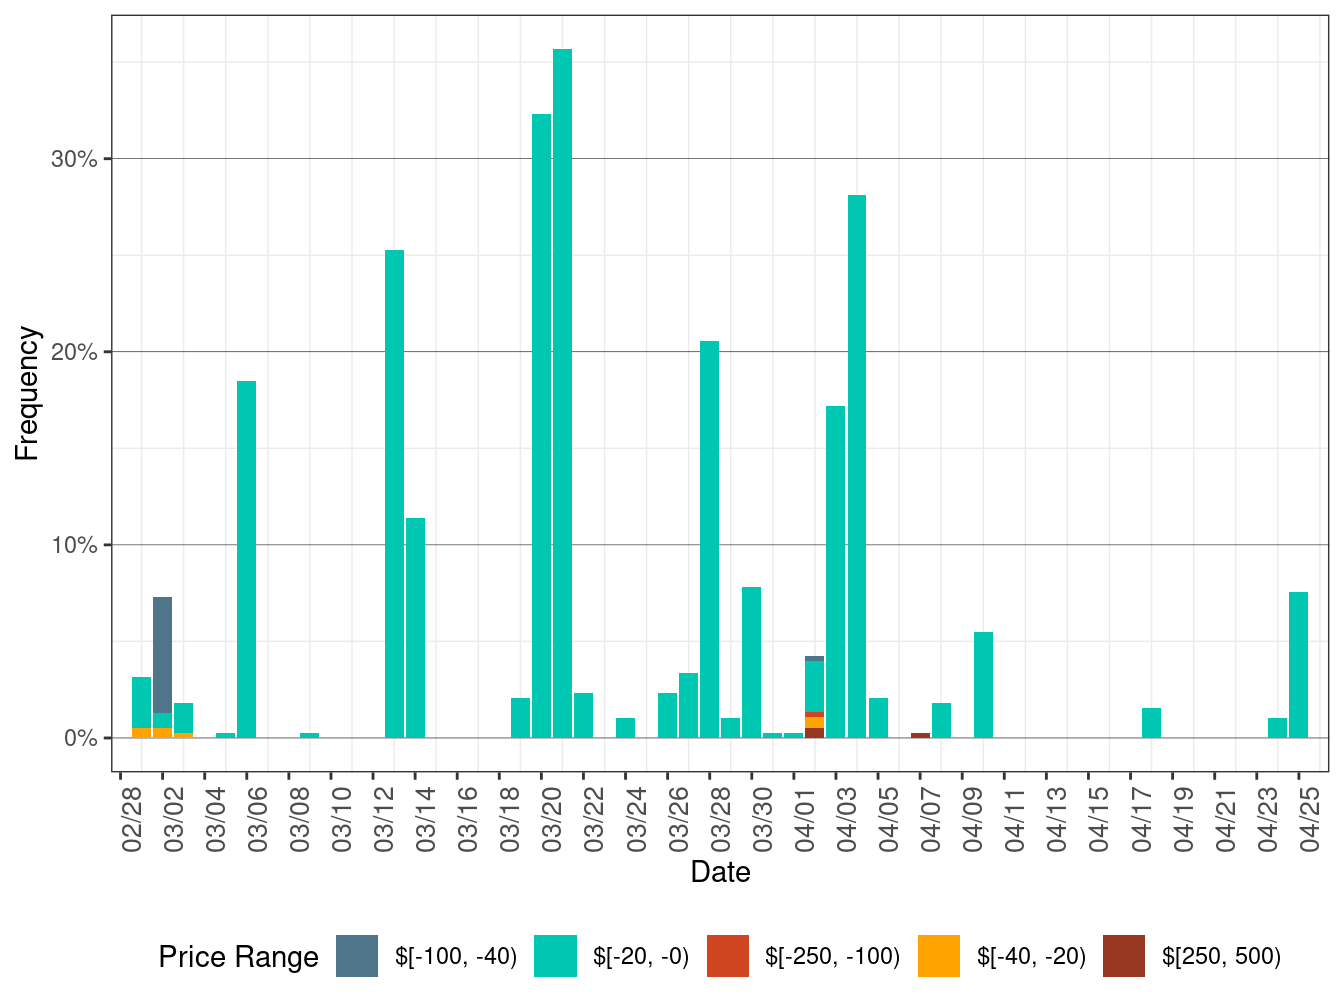
Figure 5 show daily simple average LAP prices for all the default LAPs (PG&E, SCE, SDG&E, and VEA) for all hours respectively in RTD. TABLE 4 lists the binding constraints along with the associated DLAP locations and the dates when the binding constraints resulted in relatively high or low DLAP prices.
Figure 5: RTD Simple Average LAP Prices (All Hours)
| DLAP | Dates | Transmission Constraint |
|---|---|---|
| SDGE | April 16 | 7820_TL 230S_OVERLOAD_NG |
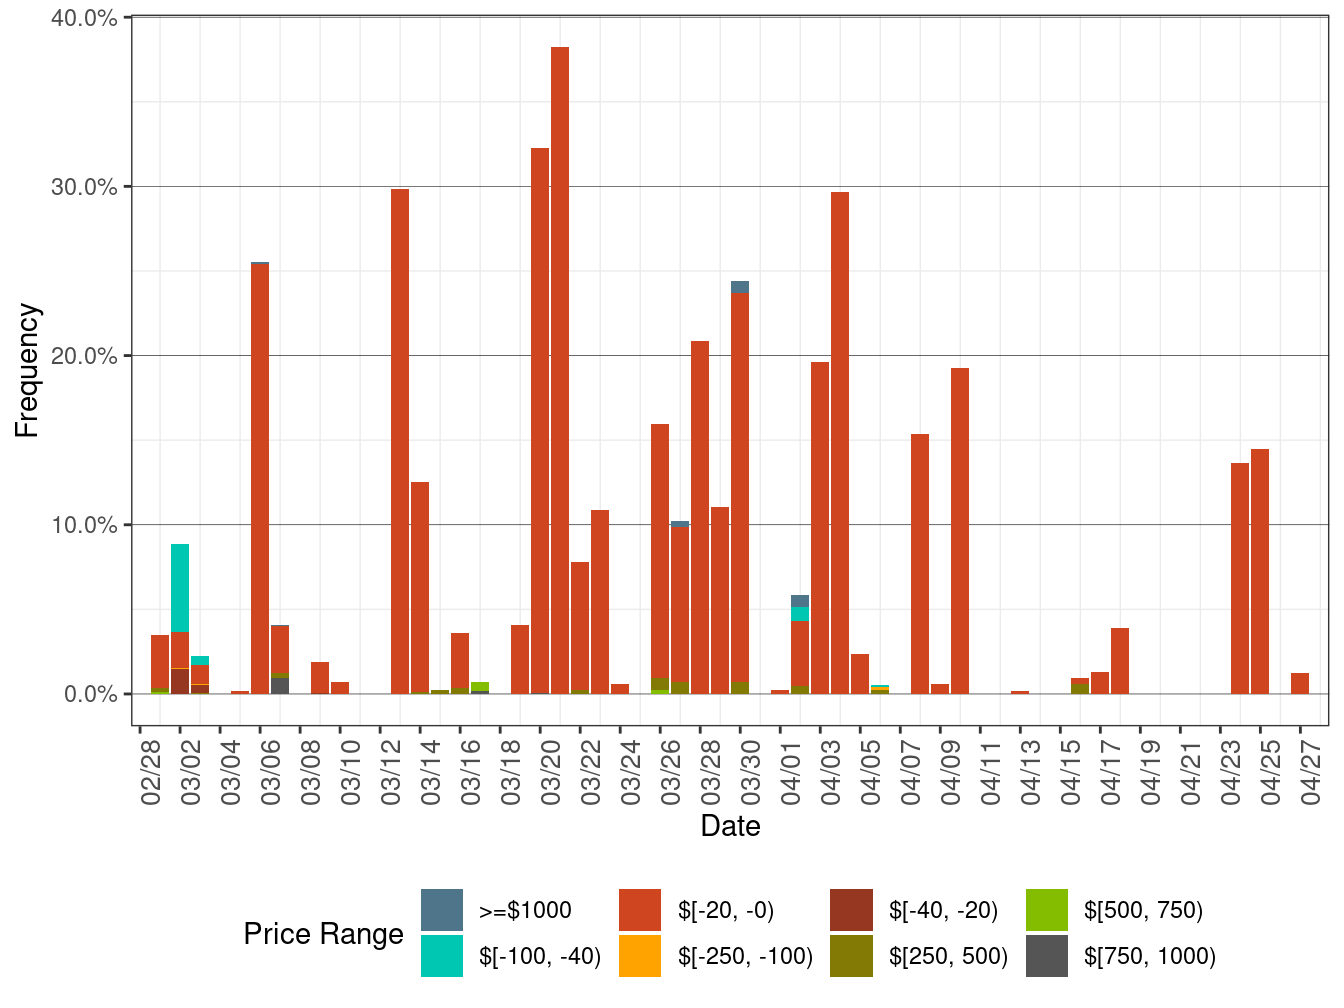
Figure 4 below shows the daily frequency of positive price spikes and negative prices by price range for the default LAPs in RTD. The cumulative frequency of prices above $250/MWh fell to 0.02 percent in April from 0.22 percent in March. The cumulative frequency of negative prices dropped to 4.19 percent in April from 8.48 percent in March.
Figure 6: Daily Frequency of RTD LAP Positive Price Spikes and Negative Prices