5 Congestion Revenue Rights
Congestion revenue rights auction efficiency 1B became effective on January 1, 2019. It includes key changes related to the congestion revenue rights settlements process:
- Targeted reduction of congestion revenue rights payouts on a constraint by constraint basis.
- Distribute congestion revenues to the extent that CAISO collected the requisite revenue on the constraint over the month. That is, implement a pro-rata funding for CRRs.
- Allow surpluses on one constraint in one hour to offset deficits on the same constraint in another hour over the course of the month.
- Only distribute surpluses to congestion revenue rights if the surplus is collected on a constraint that the congestion revenue right accrued a deficit, and only up to the full target payment value of the congestion revenue right.
- Distribute remaining surplus revenue at the end of the month, which are associated with constraints that collect more surplus over the month than deficits, to measured demand.
Monthly CRR Revenue
Figure 11 illustrates the daily CRR notional value in the corresponding month for the various transmission elements that experienced congestion during the month. CRR notional value is calculated as the product of CRR implied flow (MW) and constraint shadow price ($/MWh) in each hour per constraint and CRR.
Figure 11: Daily CRR Notional Value by Transmission Element
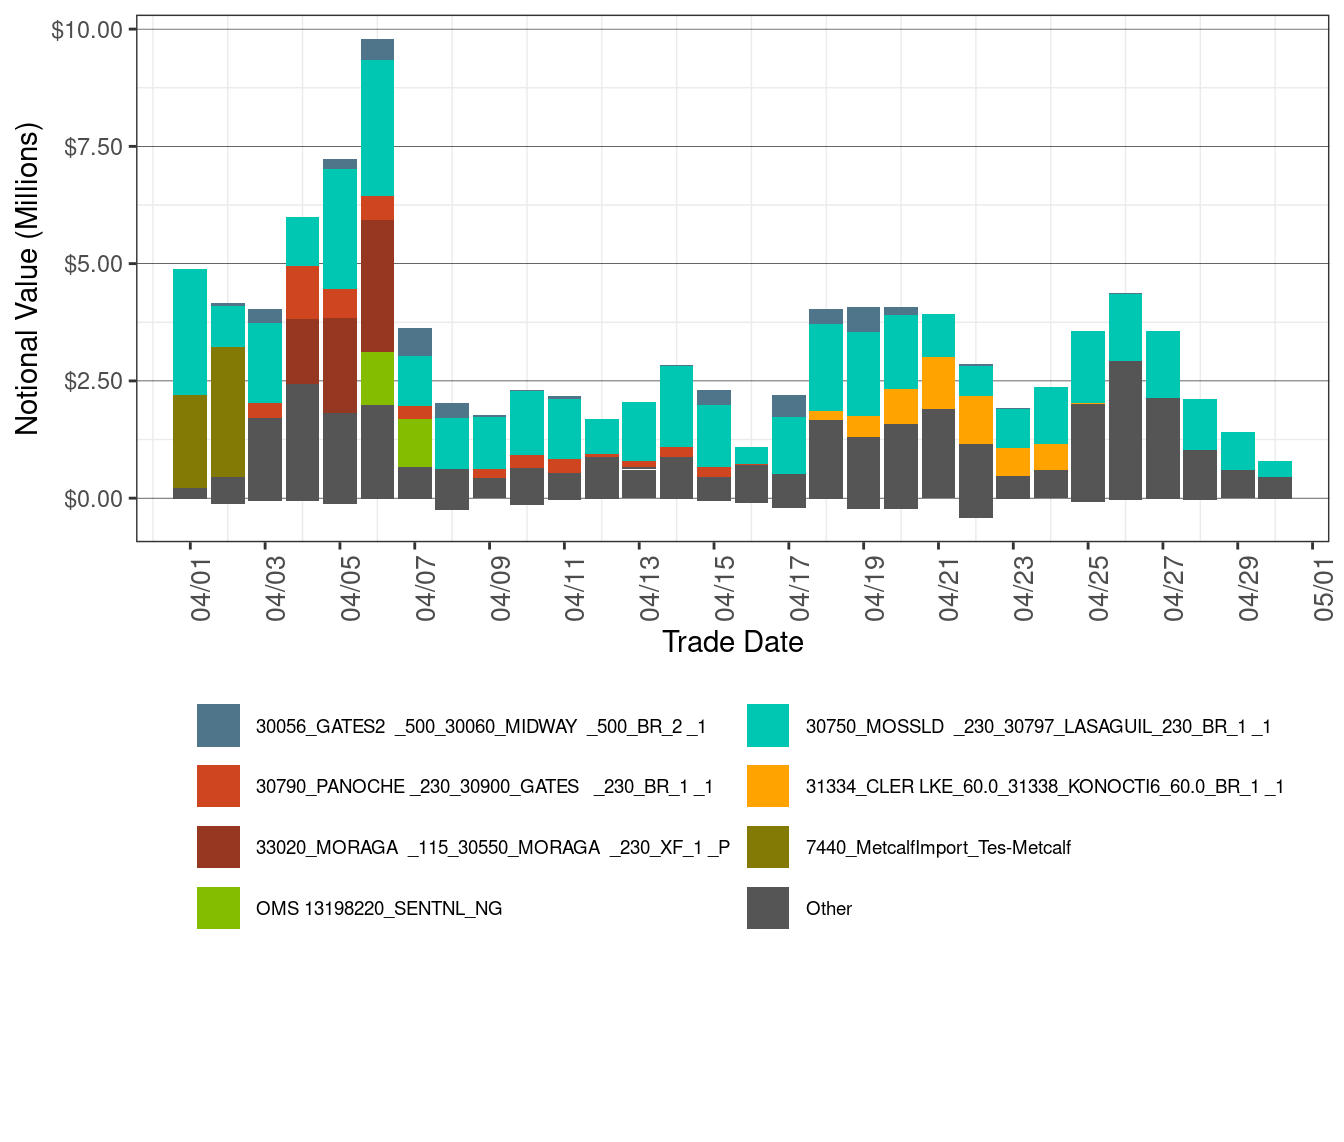
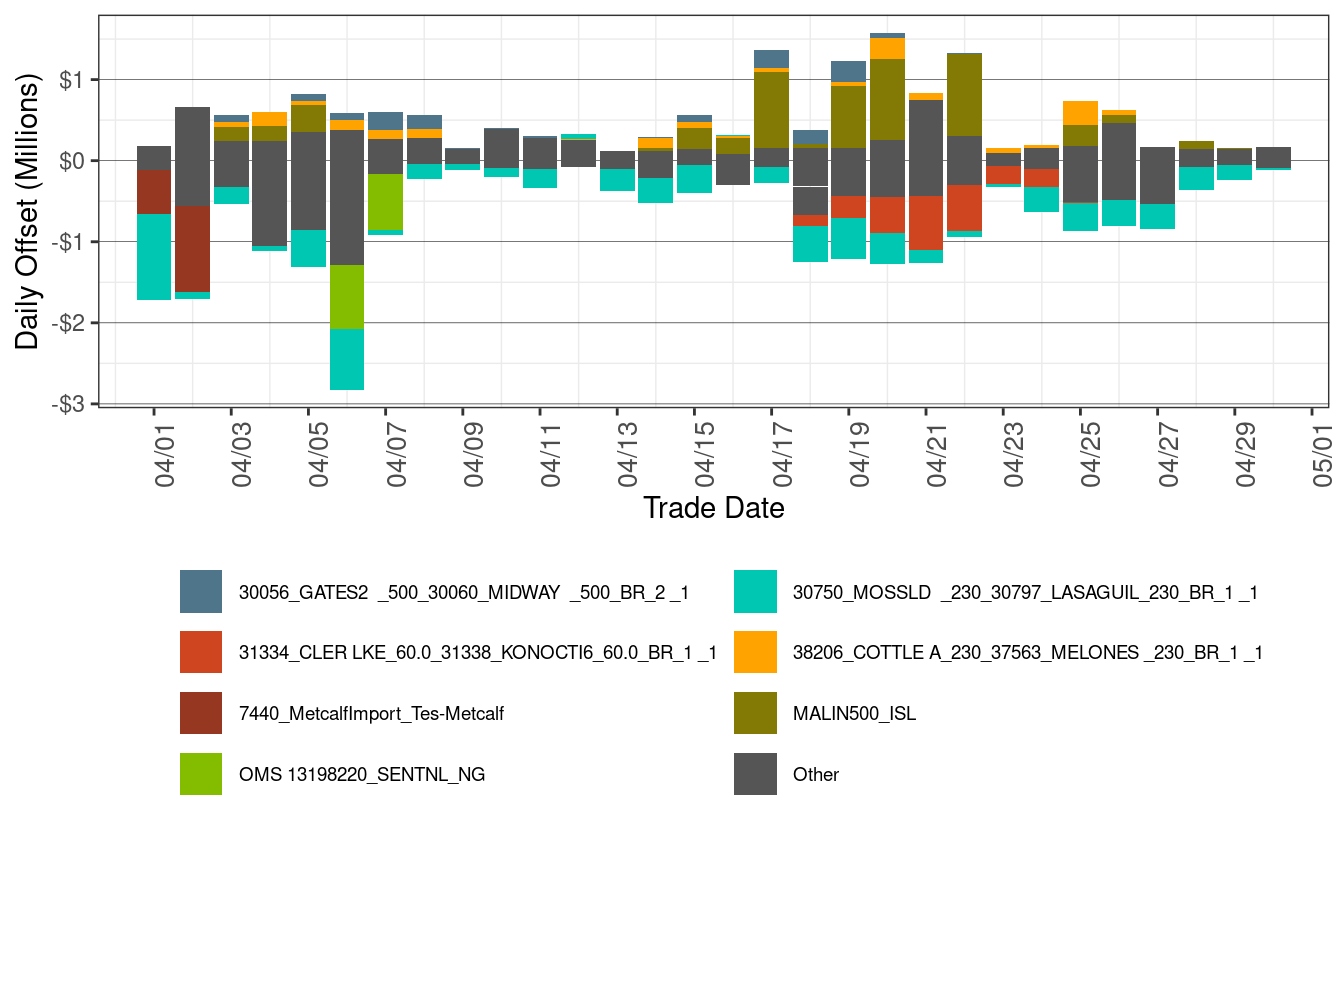
Figure 12 illustrates the daily CRR offset value in the corresponding month for the transmission elements that experienced congestion during the month. CRR offset value is the difference between the revenue collected from the congestion and the CRR notional value. A positive CRR offset value represents surplus and a negative CRR offset value represents shortfall.
As shown below, table 6 shows the percentage of monthly CRR deficit by transmission element and Table 7 shows the percentage of monthly CRR surplus by transmission element.
Figure 12: Daily CRR Offset Value by Transmission Element
| Constraint | Percent |
|---|---|
| 30750_MOSSLD _230_30797_LASAGUIL_230_BR_1 _1 | 33.75 |
| Other | 20.66 |
| 31334_CLER LKE_60.0_31338_KONOCTI6_60.0_BR_1 _1 | 11.24 |
| 7440_MetcalfImport_Tes-Metcalf | 6.94 |
| OMS 13198220_SENTNL_NG | 6.50 |
| 33020_MORAGA _115_30550_MORAGA _230_XF_1 _P | 6.36 |
| 30790_PANOCHE _230_30900_GATES _230_BR_1 _1 | 3.52 |
| OMS 13251545_SENTNL_NG | 3.27 |
| 35648_LLAGAS _115_35655_MORGN J2_115_BR_1 _1 | 3.04 |
| OMS 13251499_SENTNL_NG | 2.43 |
| OMS 13108255_TL50003_NG | 2.28 |
| Constraint | Percent |
|---|---|
| MALIN500_ISL | 33.64 |
| Other | 20.95 |
| 38206_COTTLE A_230_37563_MELONES _230_BR_1 _1 | 10.87 |
| 30056_GATES2 _500_30060_MIDWAY _500_BR_2 _1 | 9.70 |
| 33543_AEC_TP2 _115_33540_TESLA _115_BR_1 _1 | 9.18 |
| 33530_KASSONJ2_115_33548_TRACY _115_BR_1 _1 | 3.43 |
| 30060_MIDWAY _500_24156_VINCENT _500_BR_2 _3 | 3.24 |
| 35648_LLAGAS _115_35650_GILROY F_115_BR_1 _1 | 3.05 |
| 33932_MELONES _115_33936_MELNS JB_115_BR_1 _1 | 2.38 |
| 30515_WARNERVL_230_30800_WILSON _230_BR_1 _1 | 1.93 |
| 30500_BELLOTA _230_30515_WARNERVL_230_BR_1 _1 | 1.63 |
The main reasons for CRR offset shortfall were
- *The line 30750_MOSSLD _230_30797_LASAGUIL_230_BR_1 _1 was binding on 30 days of this month, resulting in offset shortfall of $7.74 million.*
- *The line 31334_CLER LKE_60.0_31338_KONOCTI6_60.0_BR_1 _1 was binding on 8 days of this month, resulting in offset shortfall of $2.56 million.*
The main reasons for CRR offset surplus were
- The intertie MALIN500_ISL was binding on 15 days of this month, resulting in offset surplus of $5.43 million.
- *The line 38206_COTTLE A_230_37563_MELONES _230_BR_1 _1 was binding on 20 days of this month, resulting in offset surplus of $1.76 million.*
Table 8 shows the percentage of monthly CRR payment by transmission element.
| Constraint | Percent |
|---|---|
| 30750_MOSSLD _230_30797_LASAGUIL_230_BR_1 _1 | 43.28 |
| Other | 23.92 |
| 33020_MORAGA _115_30550_MORAGA _230_XF_1 _P | 6.47 |
| 30056_GATES2 _500_30060_MIDWAY _500_BR_2 _1 | 5.37 |
| 30790_PANOCHE _230_30900_GATES _230_BR_1 _1 | 4.68 |
| 7440_MetcalfImport_Tes-Metcalf | 4.26 |
| 31334_CLER LKE_60.0_31338_KONOCTI6_60.0_BR_1 _1 | 2.88 |
| 33936_MELNS JB_115_33951_VLYHMTP1_115_BR_1 _1 | 2.60 |
| OMS OUTAGE JHINDS-MIRAGE_NG | 2.42 |
| 30790_PANOCHE _230_30900_GATES _230_BR_2 _1 | 2.34 |
| NdGrp: 36411_DIABLO 1_25.0_B1 | 1.79 |
Table 9 shows the monthly CRR statistics. The Net Monthly Balancing Surplus calculates as CRR Surplus plus CRR Daily Balancing Account minus total auction revenue. The total auction revenue is the sum of Monthly Auction Revenue and Annual Auction Revenue. The Allocation to Measured demand is calculated as sum of total auction revenue and Net Monthly Balancing Surplus.
Net Monthly Balancing Surplus in April was $8.23 million. The auction revenues credited to the balancing account for April were $10.54 million. As a result, the balancing account for April had a surplus of approximately $18.77 million compared to $7.53 million in the previous month, which was allocated to measured demand.
| Description | APRIL -2023 | MARCH -2023 |
|---|---|---|
| CRR Notional Value | $96,860,683 | $85,601,925 |
| CRR Deficit | -$22,883,838 | -$21,447,634 |
| CRR Settlement Rule | -$23,430 | -$39,662 |
| CRR Adjusted Payment | $73,953,415 | $64,114,628 |
| CRR Surplus | $16,145,344 | $3,338,315 |
| Monthly Auction Revenue | $5,623,469 | $3,007,177 |
| Annual Auction Revenue | $4,912,376 | $4,949,802 |
| CRR Daily Balancing Account | $2,622,422 | $4,177,616 |
| Net Monthly Balancing Surplus | $8,231,921 | -$441,048 |
| Allocation to Measured Demand | $18,767,766 | $7,515,931 |