3 Market Performance Metrics
Day-Ahead Prices
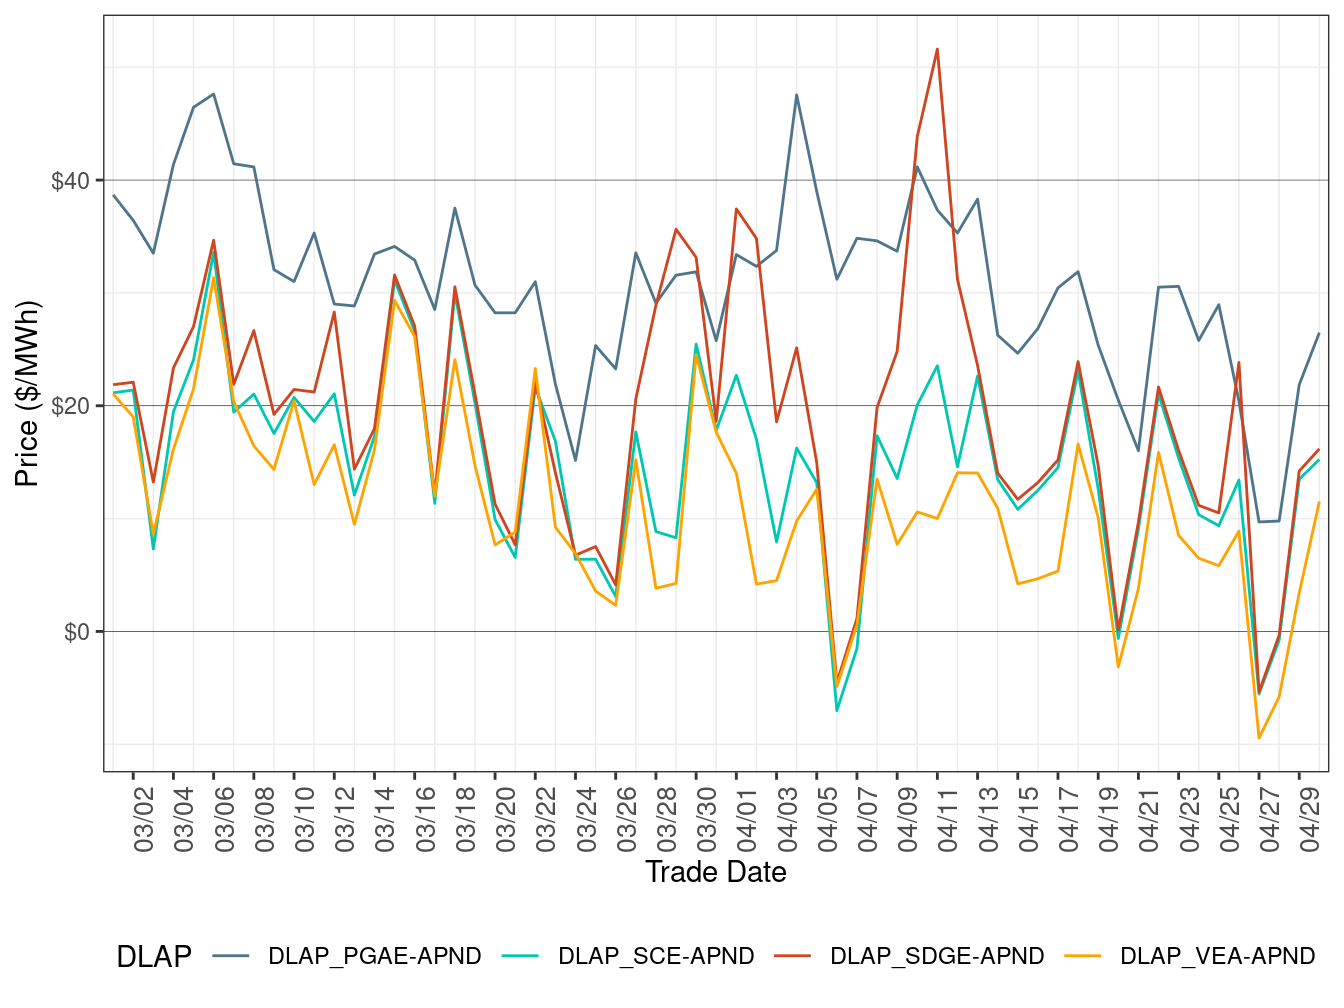
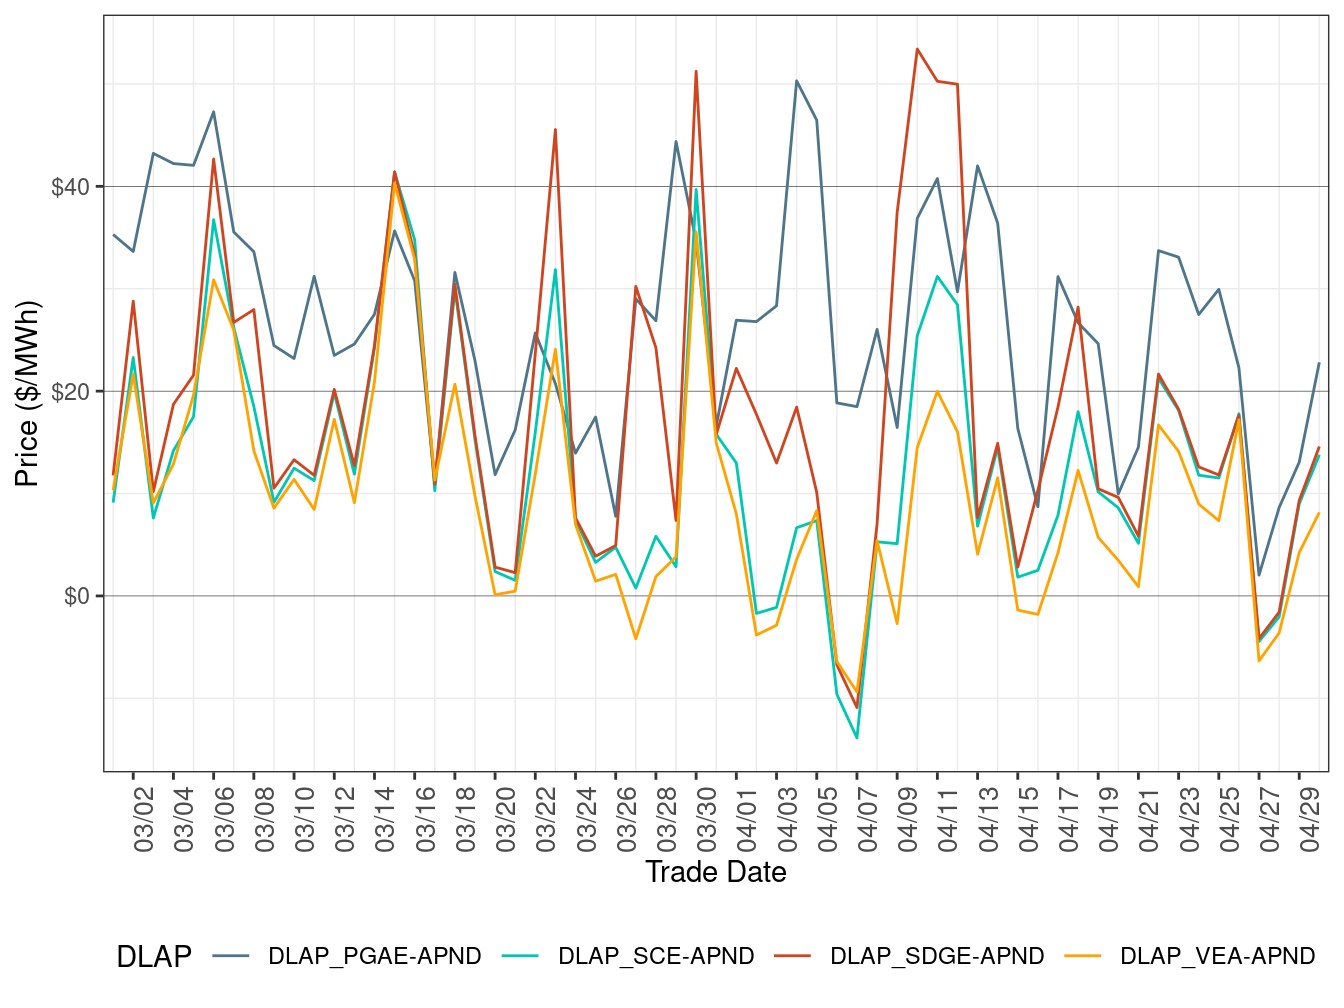
Figure 2 shows the daily simple average prices for all hours in IFM for each of the four default load-aggregation points (DLAP): PG&E, SCE, SDG&E, and VEA.
Day-Ahead DLAP prices on average decreased compared to the previous month, correlated with falling natural gas prices. DLAPs for SC&E decreased on average in April despite natural gas prices increasing. Prices remained volatile compared to the previous month. Prices were lower than the same month in the previous year.
TABLE 3 below lists the binding constraints that resulted in relatively high or low DLAP prices on certain dates.
Figure 2: IFM (Day-Ahead) Simple Average DLAP Prices (All Hours)
| DLAP LMPs Affected | Dates | Transmission Constraint |
|---|---|---|
| PGAE; SDGE | Apr 1-2 | SUNCREST-SUNCREST-230 XFMR; GATES1-MIDWAY-500kV line |
| PGAE | Apr 3 | GATES1-MIDWAY-500kV line |
| PGAE; SDGE | Apr 4 | MIGUEL_BKs_MXFLW_NG nomogram; GATES1-MIDWAY-500kV line |
| PGAE | Apr 5-8 | GATES1-MIDWAY-500kV line; MOSSLD-LASAGUIL-230kV line; LOSBANOS-GATES1-500kV line |
| PGAE; SDGE | Apr 9 | MIGUEL_BKs_MXFLW_NG nomogram; LOSBANOS-GATES1-500kV line |
| PGAE; SCE; SDGE | Apr 10-11 | MIGUEL_BKs_MXFLW_NG nomogram; MOSSLD-LASAGUIL-230kV line |
| PGAE; SDGE | Apr 12 | MIGUEL_BKs_MXFLW_NG nomogram; MOSSLD-LASAGUIL-230kV line |
| PGAE; SCE; SDGE | Apr 13 | GATES1-MIDWAY-500kV line; MIDWAY-WIRLWIND-500kV line |
| PGAE | Apr 14-17 | GATES1-MIDWAY-500kV line; MOSSLD-LASAGUIL-230kV line; FINKSS-WSTLYTID-230kV line; LITEHIPE-MESA CAL-230kV line |
| PGAE; SCE; SDGE | Apr 18 | MOSSLD-LASAGUIL-230kV line; LITEHIPE-MESA CAL-230kV line |
| PGAE | Apr 19-21 | 6410_CP10_NG nomogram; MOSSLD-LASAGUIL-230kV line; GATES1-MIDWAY-500kV line |
| PGAE; SCE; SDGE | Apr 22 | MOSSLD-LASAGUIL-230kV line; LOSBANOS-PANOCHE-230kV line |
| PGAE | Apr23-25 | MOSSLD-LASAGUIL-230kV line; LOSBANOS-PANOCHE-230kV line; 6410_CP10_NG nomogram |
| PGAE; SDGE | Apr 26 | SUNCREST-SUNCREST-230 XFMR; MOSSLD-LASAGUIL-230kV line |
| PGAE | Apr 27-30 | 6410_CP10_NG nomogram; MOSSLD-LASAGUIL-230kV line |
Real-Time Price
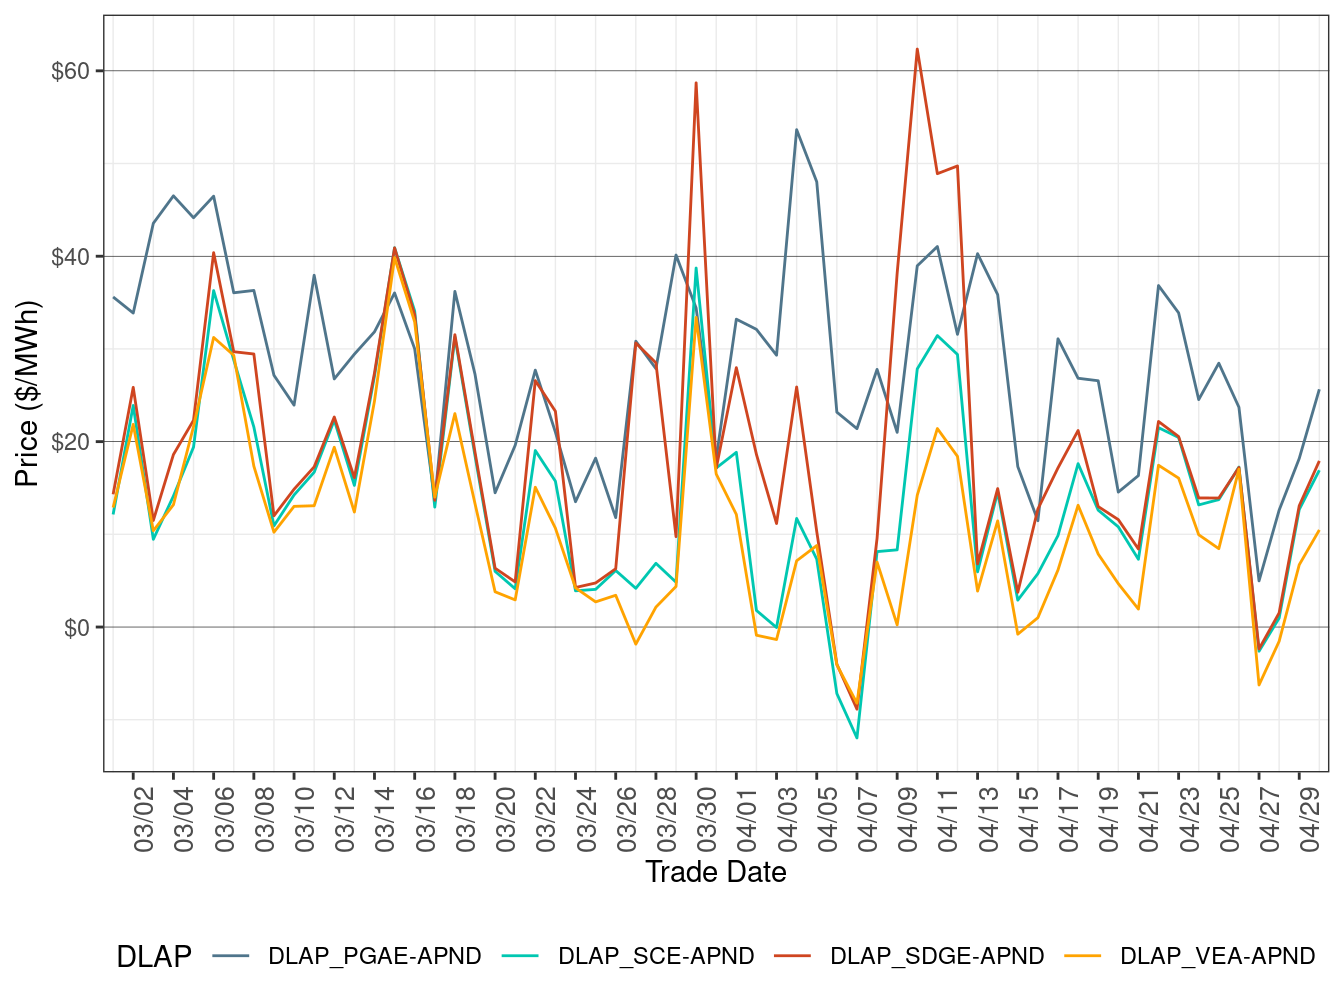
Figure 3 shows daily simple average prices for all four DLAPs (PG&E, SCE, SDG&E, and VEA) for all hours respectively in FMM.
FMM DLAP prices on average decreased compared to the previous month, correlated with falling natural gas prices. DLAPs for SC&E decreased on average in April despite natural gas prices increasing. Prices remained volatile compared to the previous month. Prices were lower than the same month in the previous year.
TABLE 4 below lists the binding constraints that resulted in relatively high or low DLAP prices on certain dates.
Figure 3: FMM Simple Average DLAP Prices (All Hours)
| DLAP LMPs Affected | Dates | Transmission Constraint |
|---|---|---|
| PGAE; SDGE | Apr 1 | SUNCREST-SUNCREST-230 XFMR; GATES1-MIDWAY-500kV line |
| PGAE | Apr 2-4 | OMS 1511377_50001_OOS_NG nomogram; GATES1-MIDWAY-500kV line; MIGUEL_BKs_MXFLW_NG nomogram |
| PGAE; SDGE | Apr 5 | GATES1-MIDWAY-500kV line |
| PGAE | Apr 6-8 | GATES1-MIDWAY-500kV line |
| PGAE; SDGE | Apr 9 | MIGUEL_BKs_MXFLW_NG nomogram; MOSSLD-LASAGUIL-230kV line |
| PGAE; SCE; SDGE | Apr 10-12 | MIGUEL_BKs_MXFLW_NG nomogram; MOSSLD-LASAGUIL-230kV line; GATES1-MIDWAY-500kV line; OMS IV-SX OUTAGE_NG nomogram |
| PGAE | Apr 13-15 | GATES1-MIDWAY-500kV line; MOSSLD-LASAGUIL-230kV line |
| PGAE | Apr 17-30 | 7820_TL 230S_OVERLOAD_NG nomogram; FINKSS-WSTLYTID-230kV line; MOSSLD-LASAGUIL-230kV line; 6410_CP10_NG nomogram; GATES1-MIDWAY-500kV line; LOSBANOS-PANOCHE-230kV line |
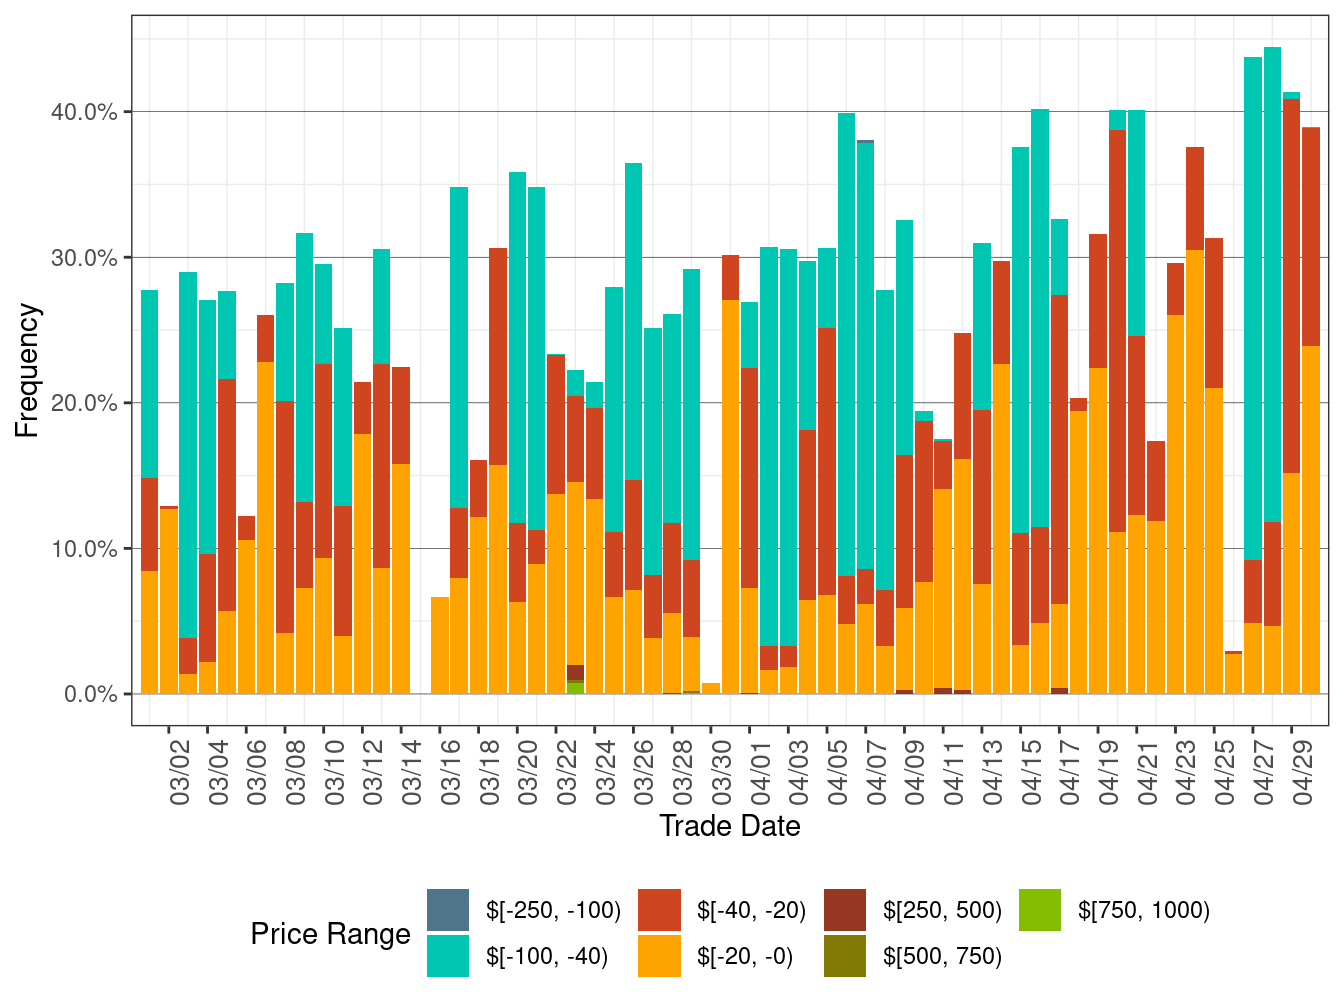
Figure 4 below shows the daily frequency of positive price spikes and negative prices by price range for the DLAPs in the FMM.
The cumulative frequency of prices in FMM above $250/MWh remained at 0.01 percent in April compared to the previous month, while the cumulative frequency of negative prices increased to 30.26 percent in April from 23.50 percent in the previous month, correlated with an increase in renewable generation curtailment.
Figure 4: Daily Frequency of FMM DLAP Positive Price Spikes and Negative Prices
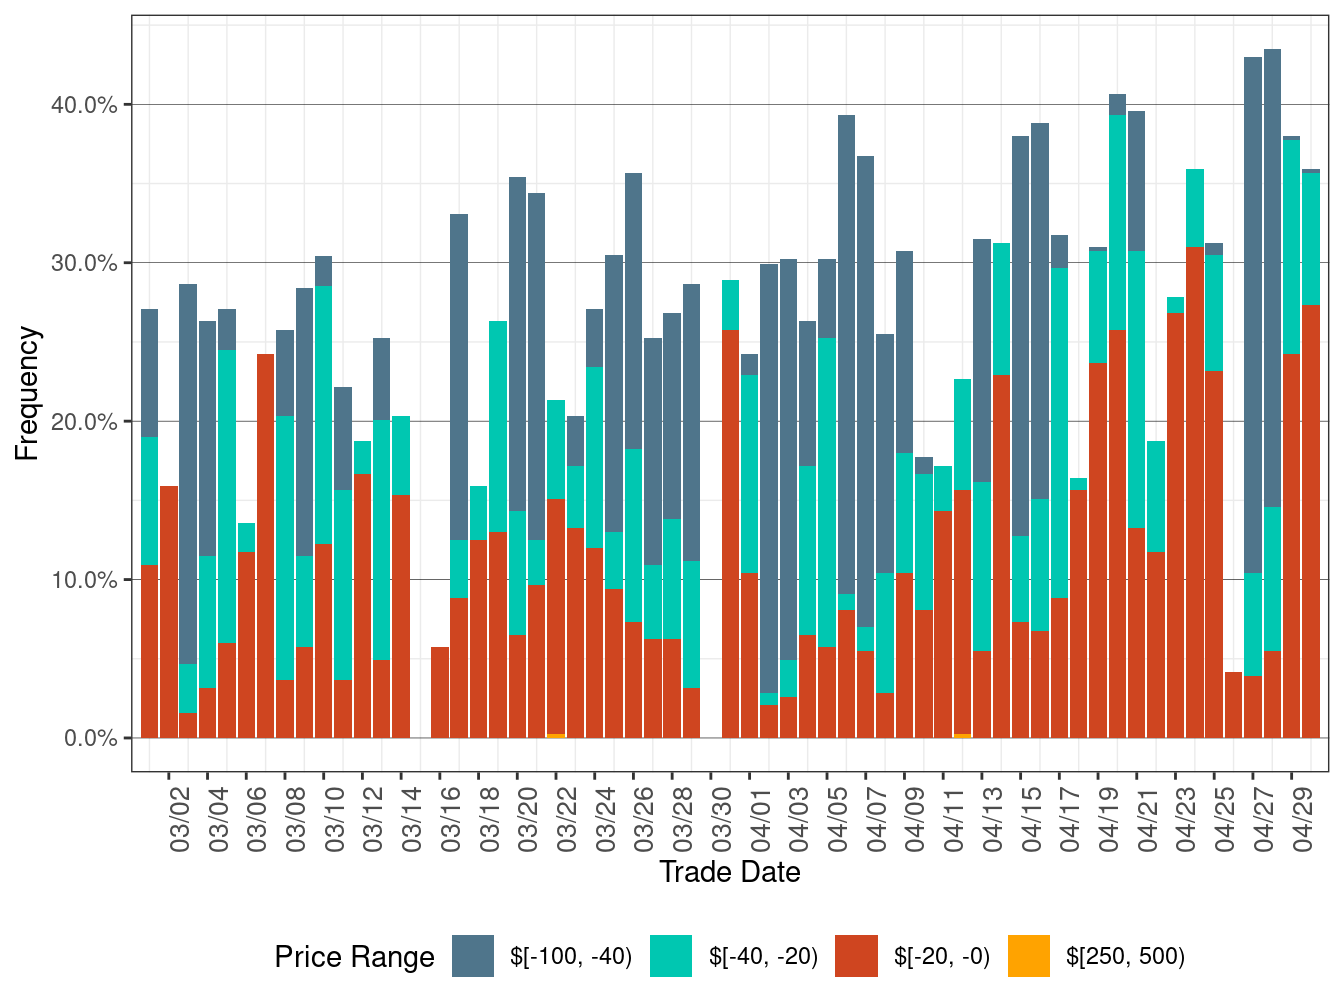
Figure 5 shows daily simple average prices for all the DLAPs (PG&E, SCE, SDG&E, and VEA) for all hours respectively in RTD.
RTD DLAP prices on average decreased compared to the previous month, correlated with falling natural gas prices. DLAPs for SC&E decreased on average in April despite natural gas prices increasing. Prices remained volatile compared to the previous month. Prices were lower than the same month in the previous year.
TABLE 5 below lists the binding constraints that resulted in relatively high or low DLAP prices on certain dates.
Figure 5: RTD Simple Average DLAP Prices (All Hours)
| DLAP LMPs Affected | Dates | Transmission Constraint |
|---|---|---|
| PGAE; SDGE | Apr 1 | SUNCREST-SUNCREST-230 XFMR; GATES1-MIDWAY-500kV line |
| PGAE | Apr 2-8 | OMS 1511377_50001_OOS_NG nomogram; GATES1-MIDWAY-500kV line; MIGUEL_BKs_MXFLW_NG nomogram |
| PGAE; SDGE | Apr 9 | MIGUEL_BKs_MXFLW_NG nomogram; MOSSLD-LASAGUIL-230kV line |
| PGAE; SCE; SDGE | Apr 10-12 | MIGUEL_BKs_MXFLW_NG nomogram; MOSSLD-LASAGUIL-230kV line; GATES1-MIDWAY-500kV line; OMS IV-SX OUTAGE_NG nomogram |
| PGAE | Apr 13-15 | GATES1-MIDWAY-500kV line; MOSSLD-LASAGUIL-230kV line |
| PGAE; SDGE | Apr 17-18 | 7820_TL 230S_OVERLOAD_NG nomogram; FINKSS-WSTLYTID-230kV line; MOSSLD-LASAGUIL-230kV line |
| PGAE | Apr 19; Apr 21-30 | 7820_TL 230S_OVERLOAD_NG nomogram; FINKSS-WSTLYTID-230kV line; MOSSLD-LASAGUIL-230kV line; 6410_CP10_NG nomogram; GATES1-MIDWAY-500kV line; LOSBANOS-PANOCHE-230kV line |
Figure 6 below shows the daily frequency of positive price spikes and negative prices by price range for the DLAPs in RTD.
The cumulative frequency of prices in RTD above $250/MWh decreased to 0.05 percent in April from 0.07 percent in the previous month, while the cumulative frequency of negative prices increased to 31.26 percent in April from 24.23 percent in the previous month, correlated with an increase in renewable generation curtailment.
Figure 6: Daily Frequency of RTD DLAP Positive Price Spikes and Negative Prices