3 Market Performance Metrics
Day-Ahead Prices
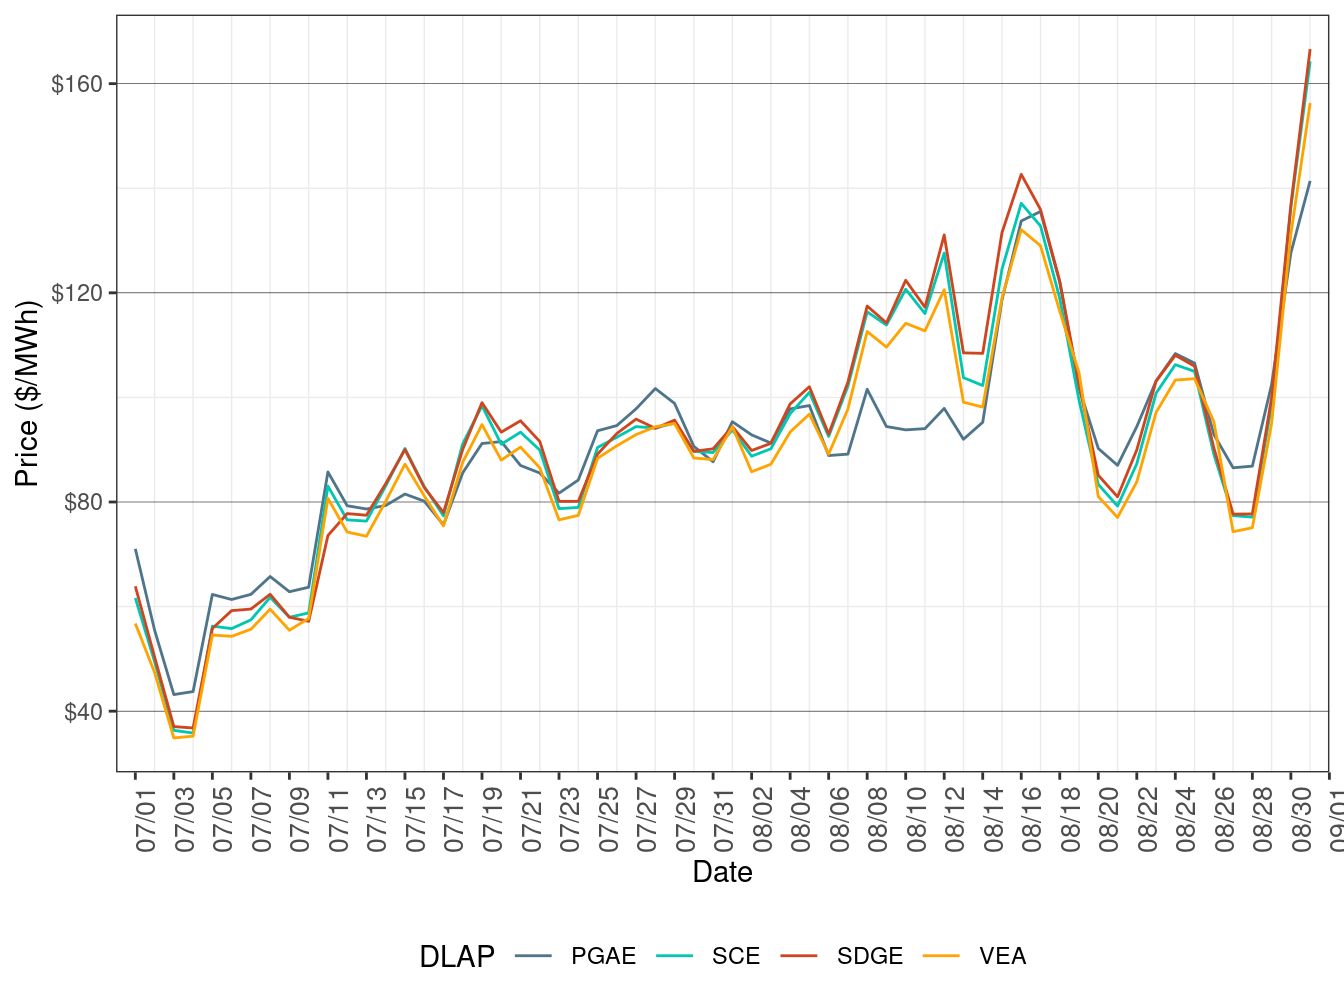
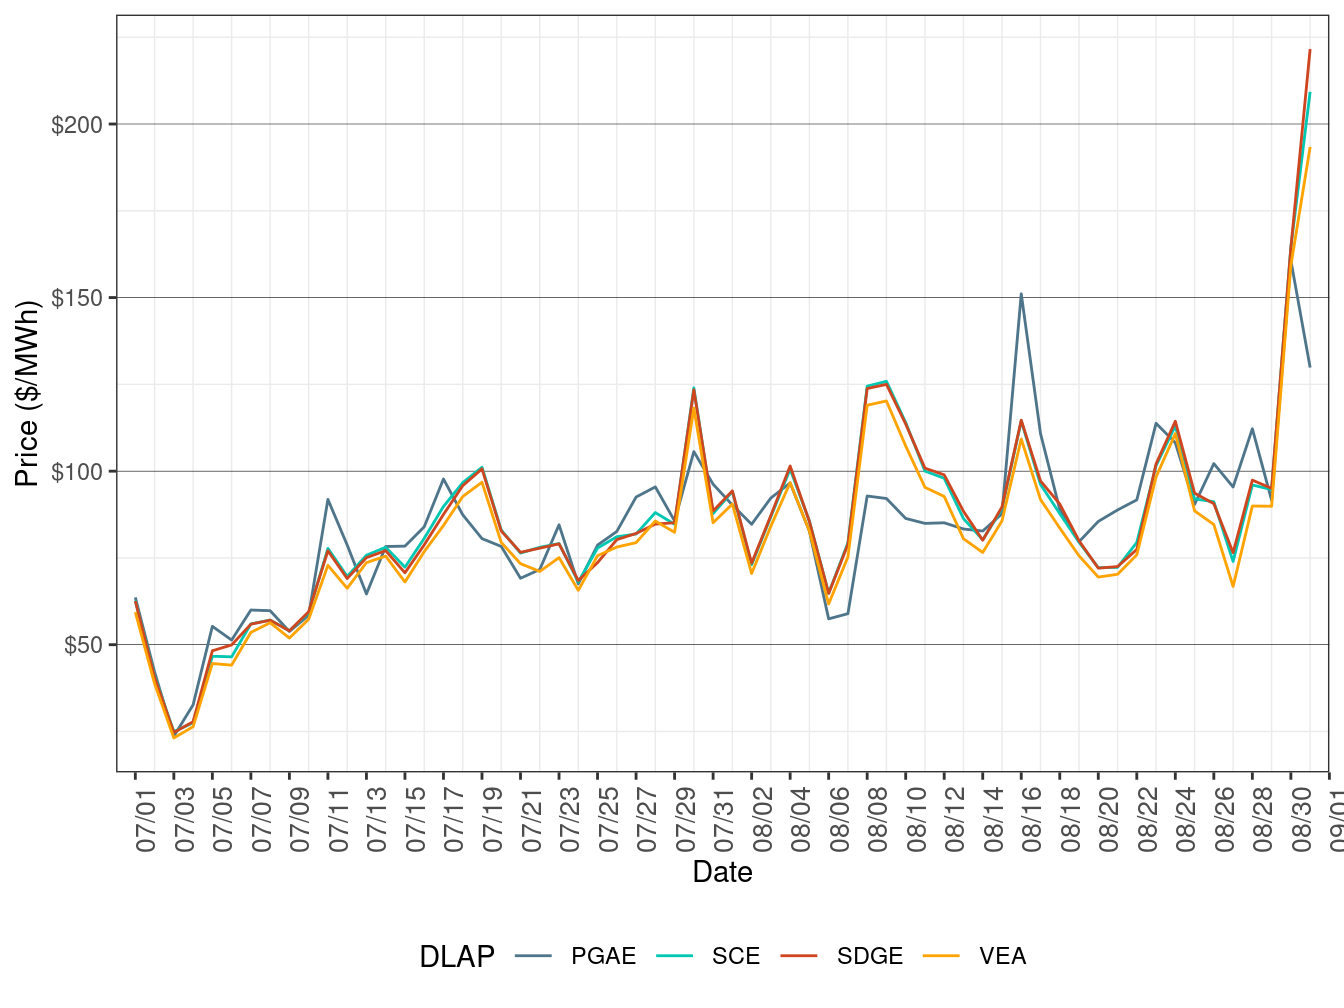
Figure 2 show the daily simple average load-aggregation points (LAP) prices for each of the four default LAPs (PG&E, SCE, SDG&E, and VEA) for all hours. Table 2 below lists the binding constraints along with the associated DLAP locations and the dates when the binding constraints resulted in relatively high or low DLAP prices.
Figure 2: Day-Ahead Simple Average LAP Prices (All Hours)
| DLAP | Dates | Transmission Constraint |
|---|---|---|
| SCE, SDGE, VEA | August 8-14 | MIDWAY-VINCENT #1 500 kV line |
| SCE, SDGE, VEA | August 31 | MIDWAY-VINCENT #1 500 kV line, MIDWAY-VINCENT #2 500 kV line |
Real-Time Price
Figure 3 show daily simple average LAP prices for all the default LAPs (PG&E, SCE, SDG&E, and VEA) for all hours respectively in FMM. Table 3 lists the binding constraints along with the associated DLAP locations and the dates when the binding constraints resulted in relatively high or low DLAP prices.
Figure 3: FMM Simple Average LAP Prices (All Hours)
| DLAP | Dates | Transmission Constraint |
|---|---|---|
| SCE, SDGE, VEA | August 6-8, August 31 | MIDWAY-VINCENT #1 500 kV line |
| SCE, SDGE, VEA | August 9-11 | MIDWAY-VINCENT #1 500 kV line, MIDWAY-WIRLWIND 500 kV line |
| SCE, SDGE, VEA | August 12 | 6410_CP1_NG |
| SCE, SDGE, VEA | August 13 | MIDWAY-VINCENT #1 500 kV line, Line_FC_MK_500kV_Base_Case |
| PGAE | August 16 | Q0577SS-LOSBANOS 230 kV line |
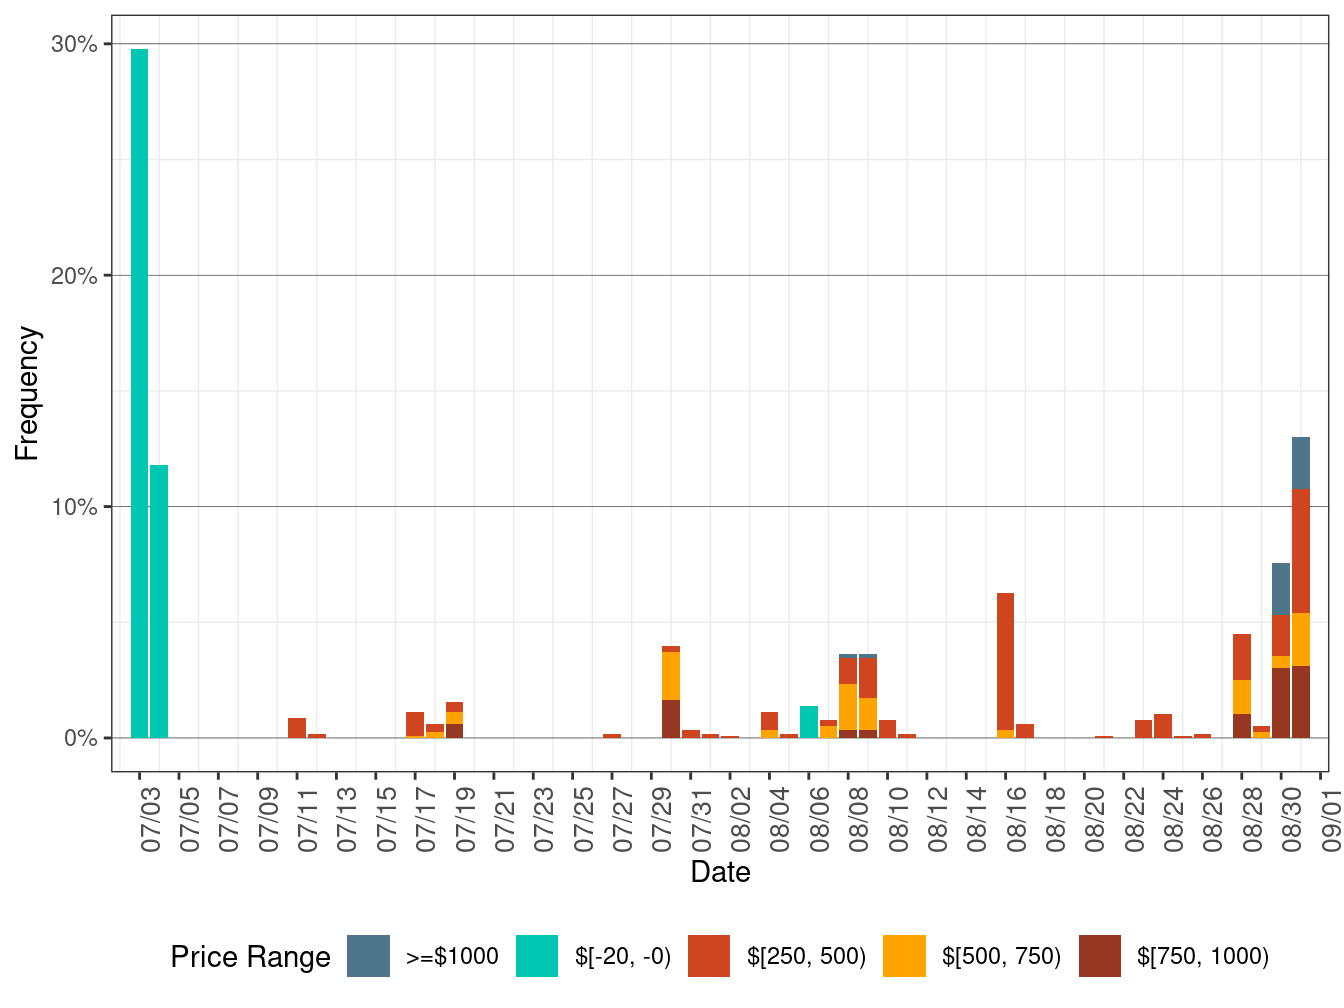
Figure 4 below shows the daily frequency of positive price spikes and negative prices by price range for the default LAPs in the FMM. The cumulative frequency of prices above $250/MWh increased to 2.32 percent in August from 0.50 percent in July. The cumulative frequency of negative prices fell to 0.01 percent in August from 0.13 percent in July.
Figure 4: Daily Frequency of FMM LAP Positive Price Spikes and Negative Prices
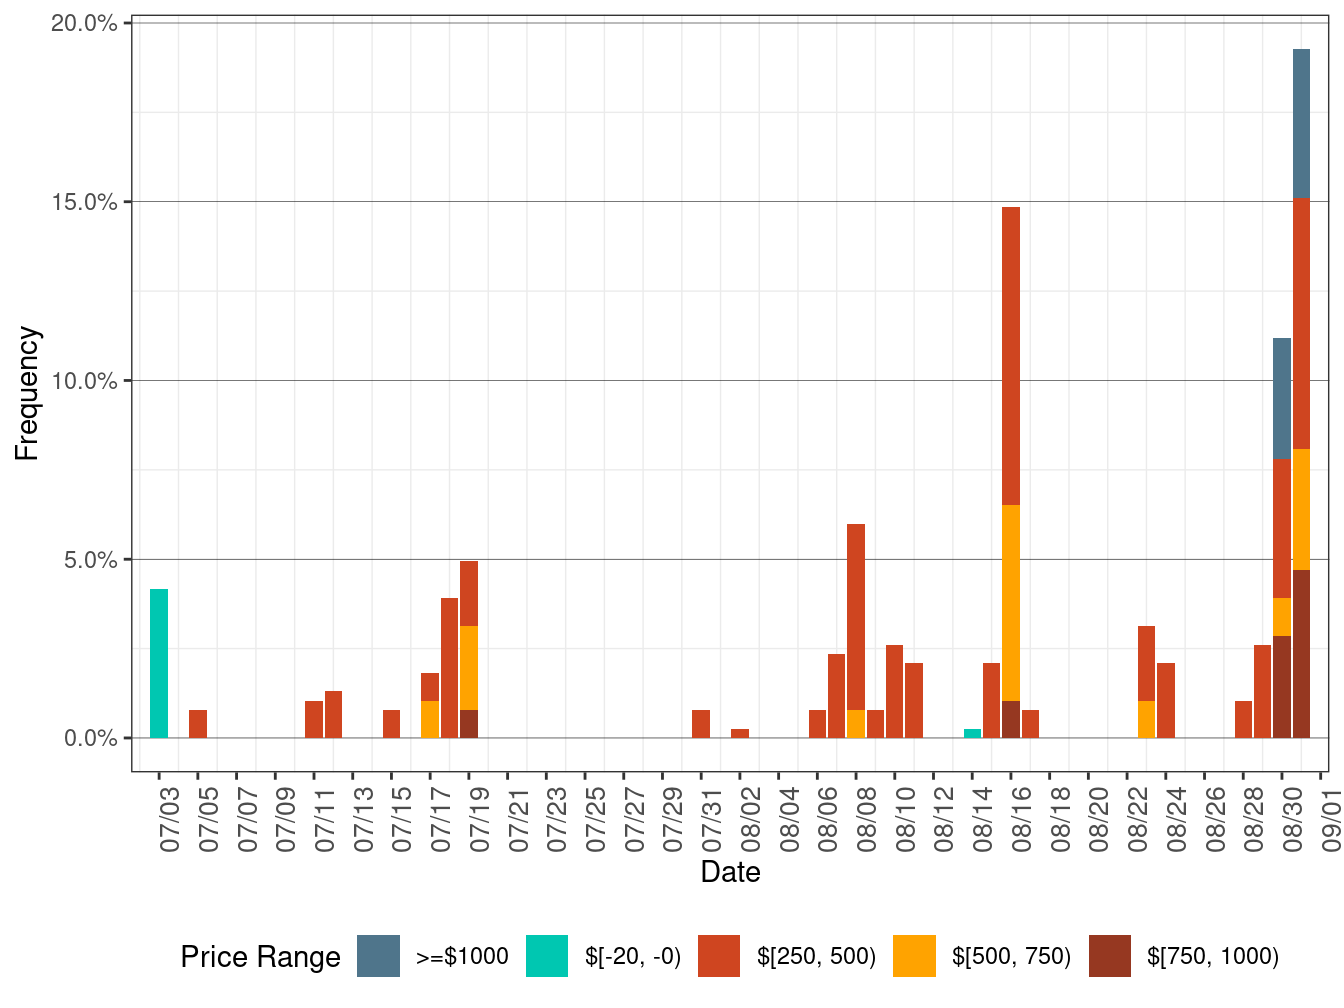
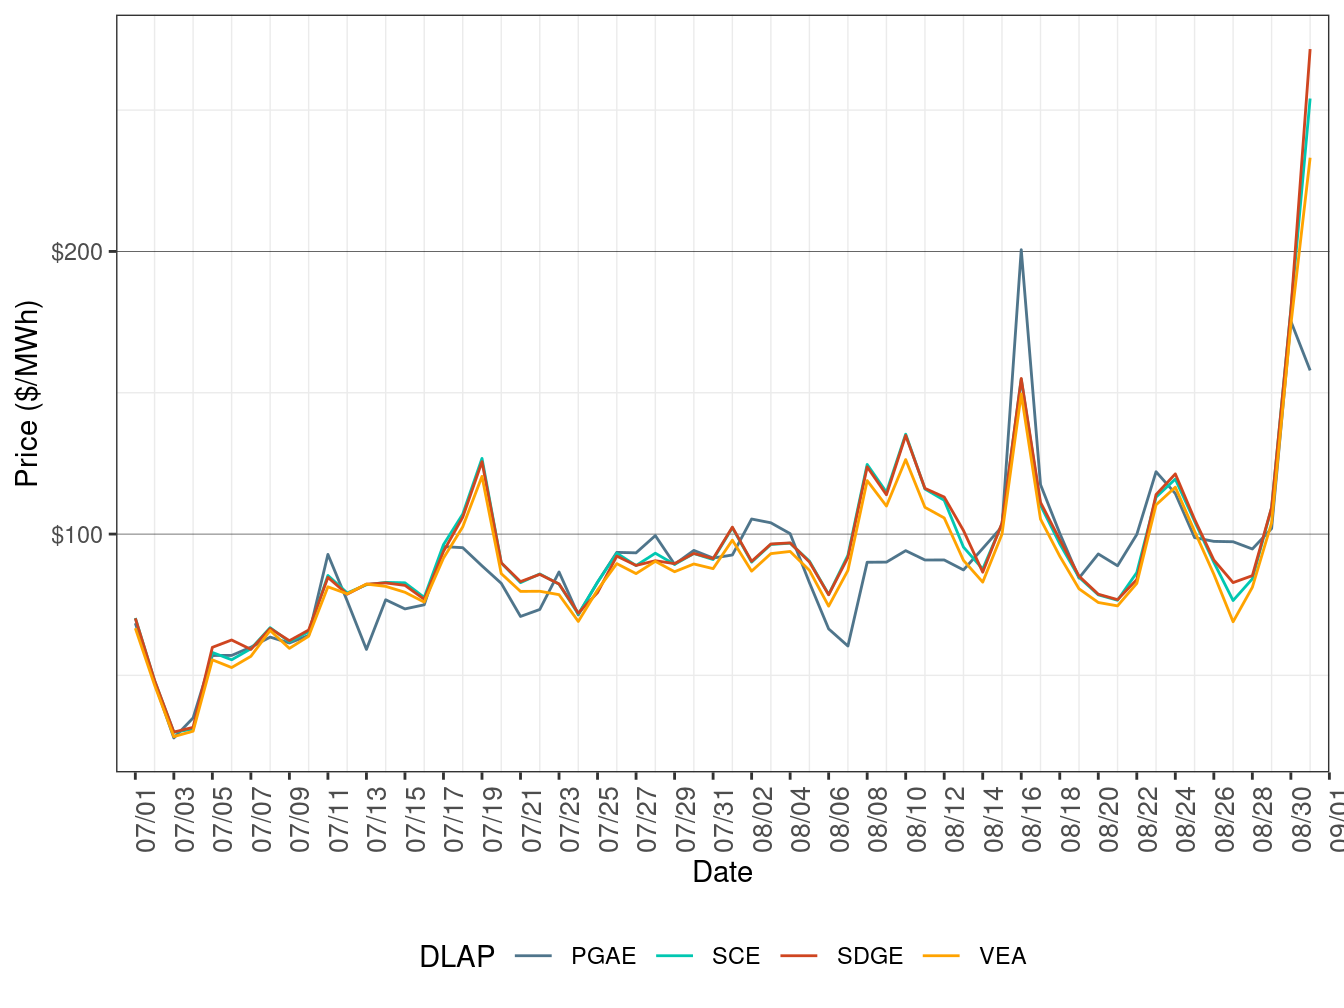
Figure 5 show daily simple average LAP prices for all the default LAPs (PG&E, SCE, SDG&E, and VEA) for all hours respectively in RTD. TABLE 4 lists the binding constraints along with the associated DLAP locations and the dates when the binding constraints resulted in relatively high or low DLAP prices.
Figure 5: RTD Simple Average LAP Prices (All Hours)
| DLAP | Dates | Transmission Constraint |
|---|---|---|
| SCE, SDGE, VEA | August 6-8, 31 | MIDWAY-VINCENT #1 500 kV line |
| SCE, SDGE, VEA | August 9-11 | MIDWAY-VINCENT #1 500 kV line, MIDWAY-WIRLWIND 500 kV line |
| SCE, SDGE, VEA | August 12 | 6410_CP1_NG |
| PGAE | August 16 | Q0577SS-LOSBANOS 230 kV line |
Figure 4 below shows the daily frequency of positive price spikes and negative prices by price range for the default LAPs in RTD. The cumulative frequency of prices above $250/MWh rose to 1.46 percent in August from 0.31 percent in July. The cumulative frequency of negative prices decreased to 0.04 percent in August from 1.34 percent in July.
Figure 6: Daily Frequency of RTD LAP Positive Price Spikes and Negative Prices