3 Market Performance Metrics
Day-Ahead Prices
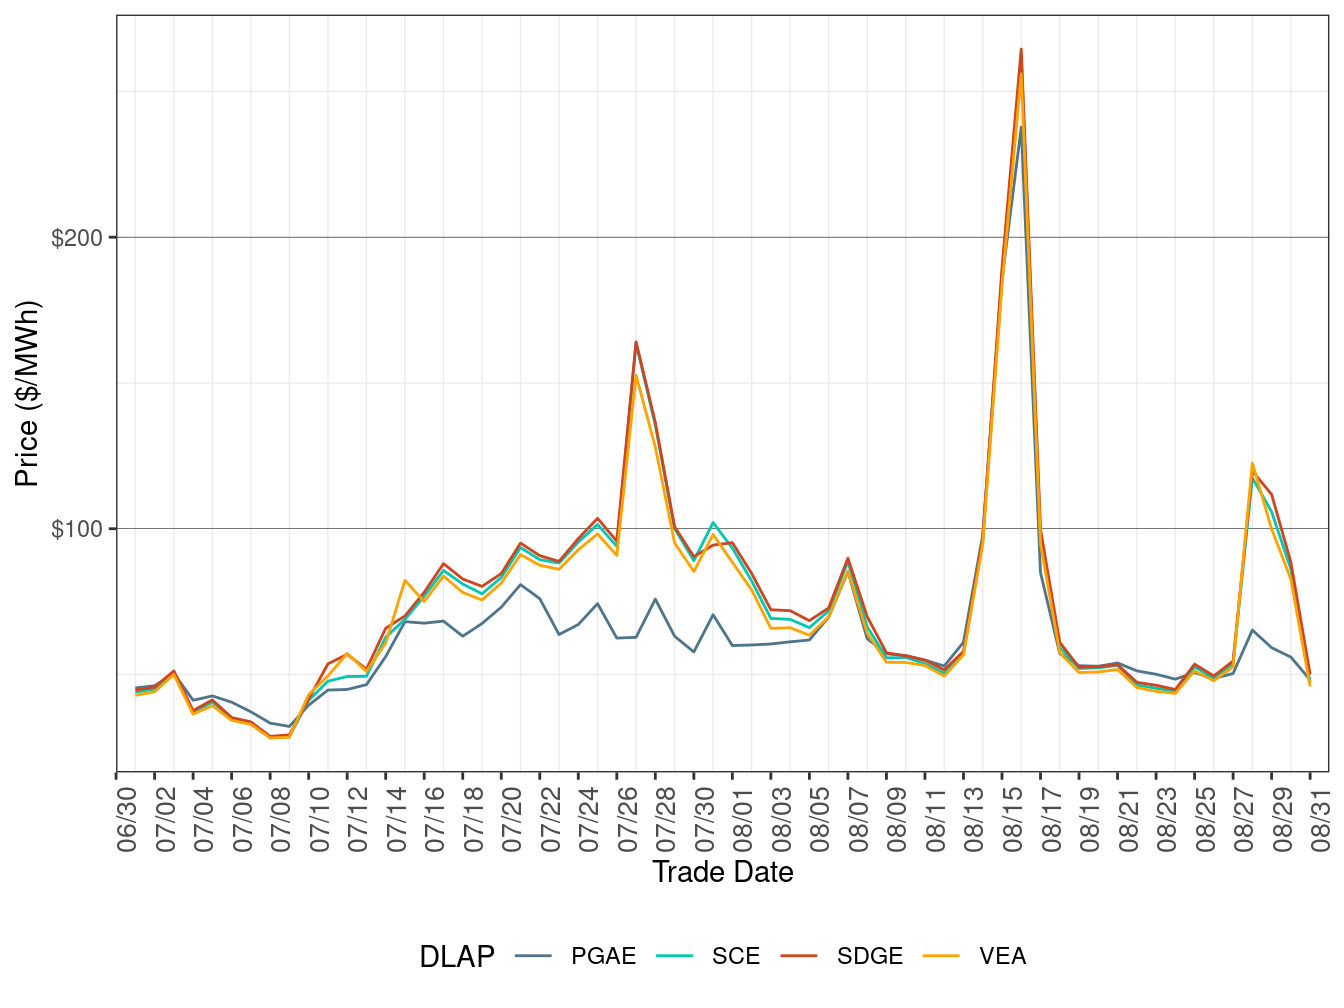
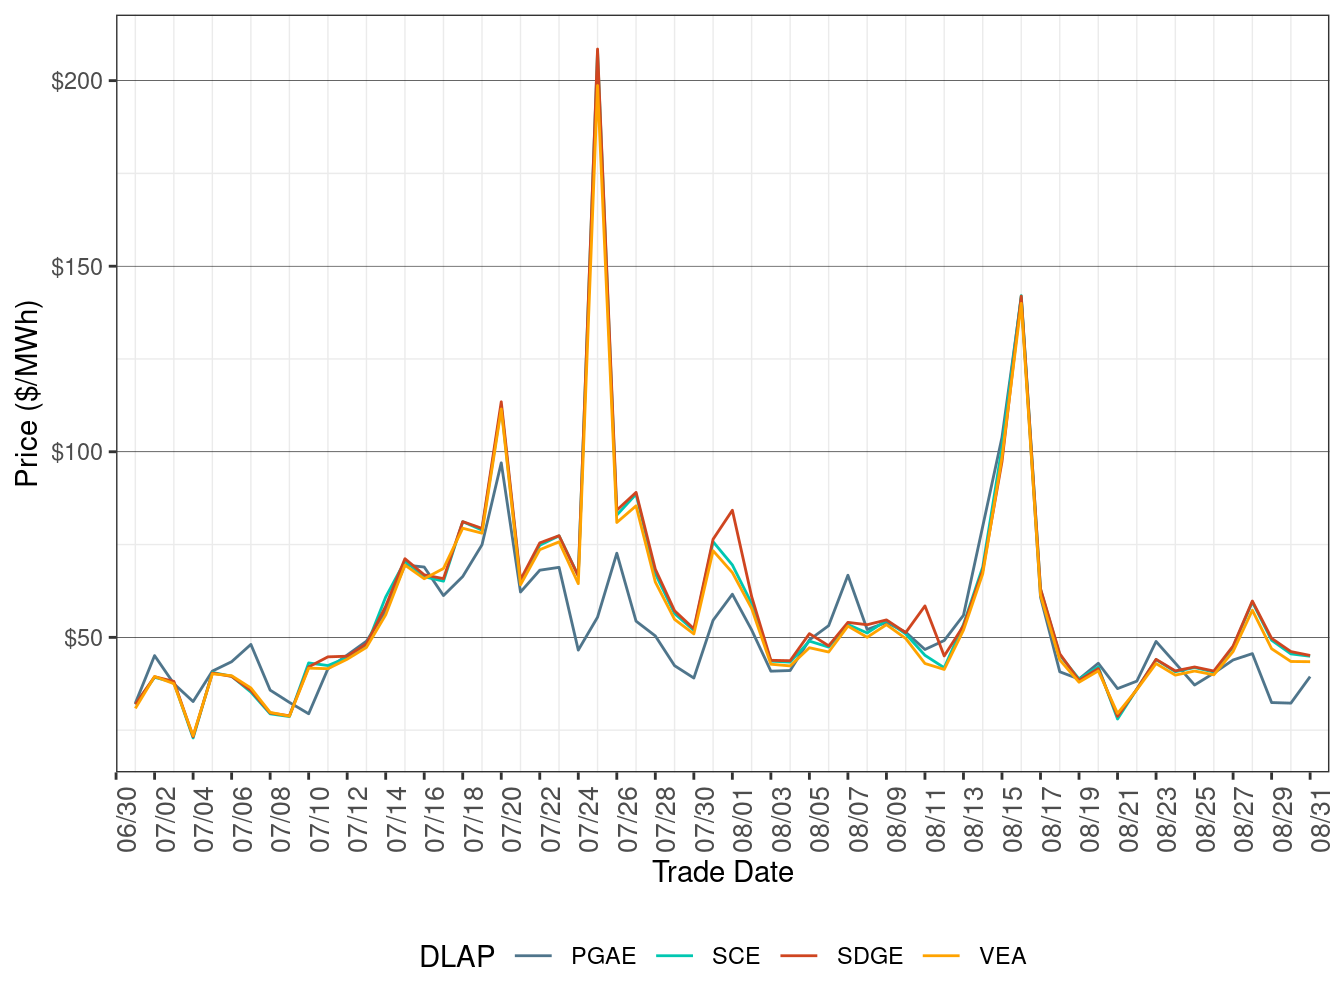
Figure 2 shows the daily simple average prices for all hours in IFM for each of the four default load-aggregation points (DLAP): PG&E, SCE, SDG&E, and VEA.
Day-Ahead DLAP prices on average increased compared to the previous month, correlated with rising natural gas prices including gas price spikes on three days during the month.
TABLE 3 below lists the binding constraints that resulted in relatively high or low DLAP prices on certain dates.
Figure 2: IFM (Day-Ahead) Simple Average DLAP Prices (All Hours)
| DLAP LMPs Affected | Dates | Transmission Constraint |
|---|---|---|
| All | August 7 | 35621_IBM-HR-J_115_35642_METCALF-_115_BR_1-_1 line |
| All | August 14-17 | IBM HR J-METCALF-115kV line; MIDWAY-VINCENT-500kV line; 6410_CP1_NG nomogram |
| SCE; SDGE; VEA | August 28-30 | MIDWAY-VINCENT-500kV line; 6410_CP1_NG nomogram |
Real-Time Price
Figure 3 shows daily simple average prices for all four DLAPs (PG&E, SCE, SDG&E, and VEA) for all hours respectively in FMM.
FMM DLAP prices on average increased compared to the previous month, correlated with rising natural gas prices including gas price spikes on three days during the month.
TABLE 4 below lists the binding constraints that resulted in relatively high or low DLAP prices on certain dates.
Figure 3: FMM Simple Average DLAP Prices (All Hours)
| DLAP LMPs Affected | Dates | Transmission Constraint |
|---|---|---|
| All | July 31-Aug 2 | 6410_CP1_NG nomogram; 35618_SN-JSE-A_115_35620_EL-PATIO_115_BR_1-_1 line; CONTRL-INYOTP_115_BR_1_1 line |
| SCE; SDGE; VEA | Aug 14-17 | LOSBANOS-GATES1-500kV line; 6410_CP1_NG nomogram |
| SCE; SDGE; VEA | Aug 28-29 | GATES1-MIDWAY-500kV line; 6410_CP1_NG nomogram |
Figure 4 below shows the daily frequency of positive price spikes and negative prices by price range for the DLAPs in the FMM.
The cumulative frequency of prices above $250/MWh decreased to 1.54 percent in August from 1.62 percent in the previous month, while the cumulative frequency of negative prices increased to 0.09 percent in August from 0.02 percent in the previous month, correlated with the slight decrease in renewable curtailment.
Figure 4: Daily Frequency of FMM DLAP Positive Price Spikes and Negative Prices
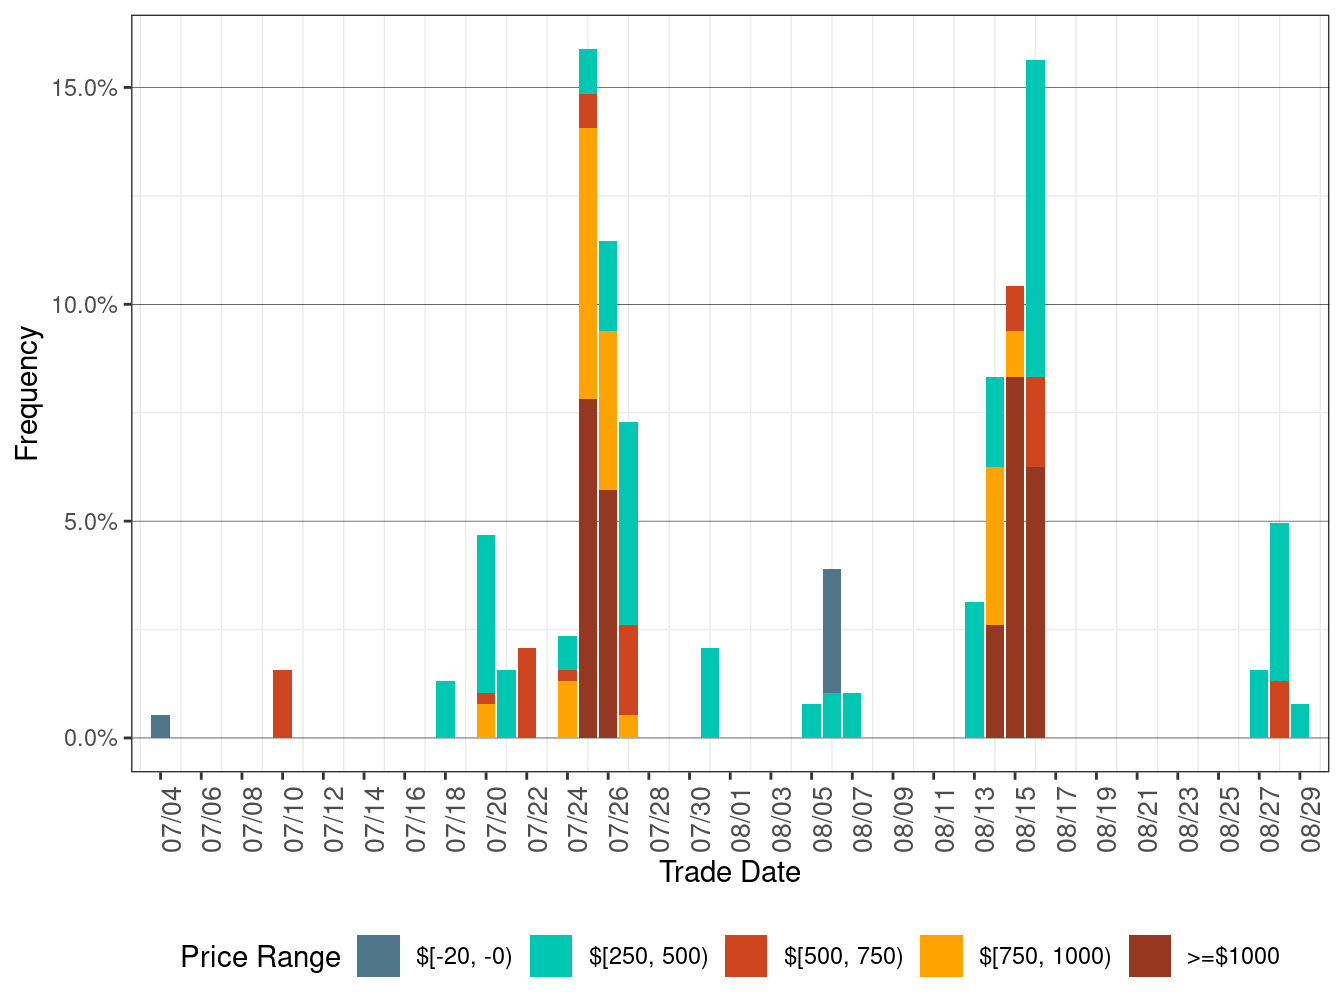
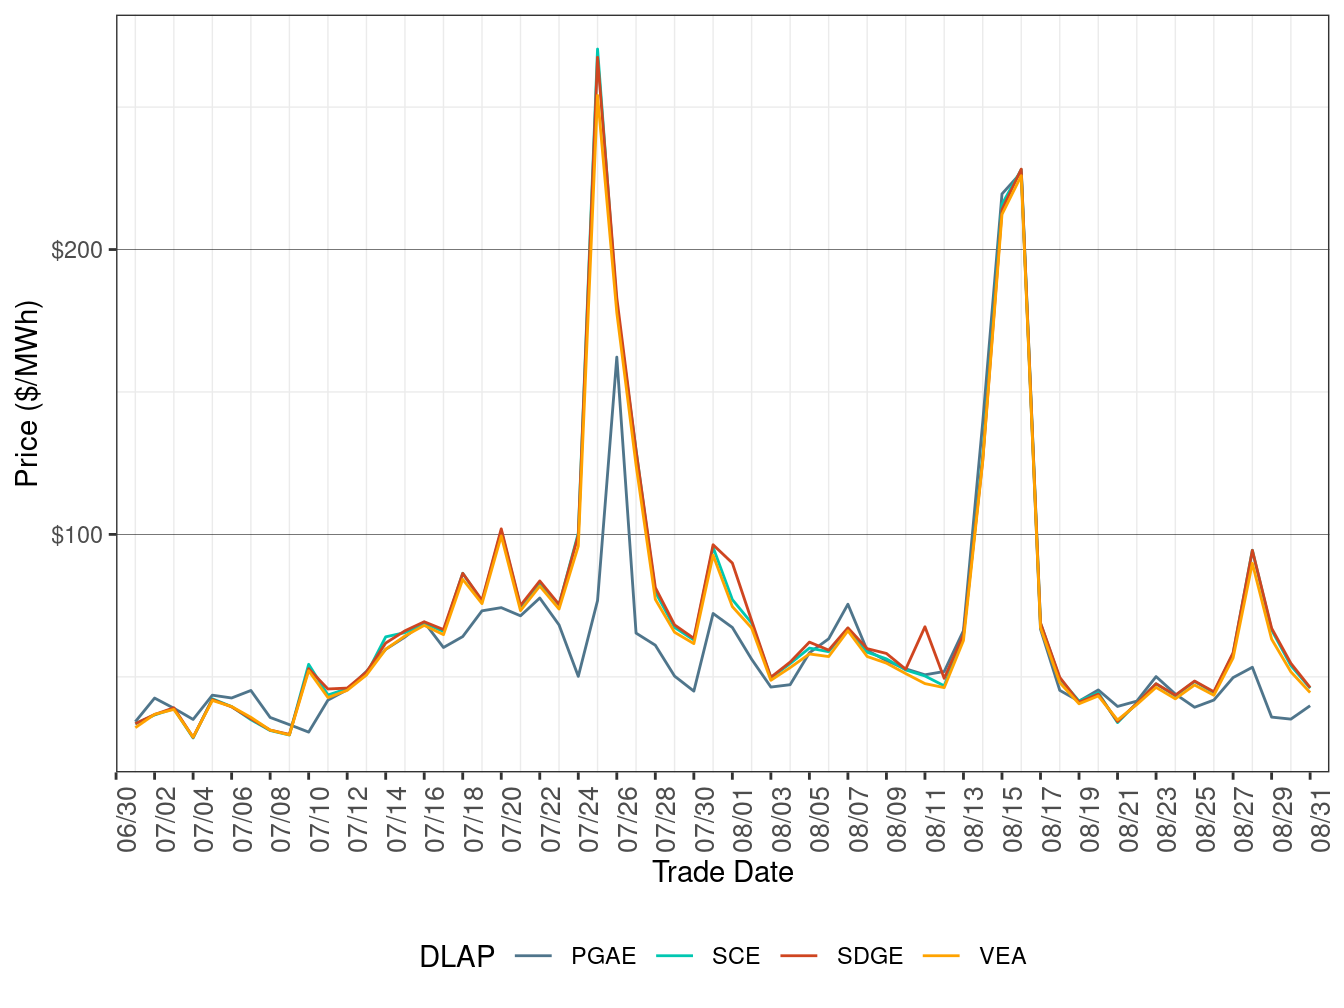
Figure 5 shows daily simple average prices for all the DLAPs (PG&E, SCE, SDG&E, and VEA) for all hours respectively in RTD.
RTD DLAP prices on average increased compared to the previous month, correlated with rising natural gas prices including gas price spikes on three days during the month.
TABLE 5 below lists the binding constraints that resulted in relatively high or low DLAP prices on certain dates.
Figure 5: RTD Simple Average DLAP Prices (All Hours)
| DLAP | Dates | Transmission Constraint |
|---|---|---|
| All | July 31-Aug 2 | 6410_CP1_NG nomogram; 22886_SUNCREST_230_92860_SUNC-TP1_230_BR_1-_1 line |
| PGAE | August 7 | 31334_CLER-LKE_60.0_31338_KONOCTI6_60.0_BR_1 line |
| SDGE | August 11 | 35621_IBM-HR-J_115_35642_METCALF-_115_BR_1-_1 line |
| All | August 14-17 | LOSBANOS-GATES1-500kV line; 6410_CP1_NG nomogram |
| SCE; SDGE; VEA | August 21 | LOSBANOS-GATES1-500kV line |
| SCE; SDGE; VEA | August 28-31 | GATES1-MIDWAY-500kV line; 6410_CP1_NG nomogram |
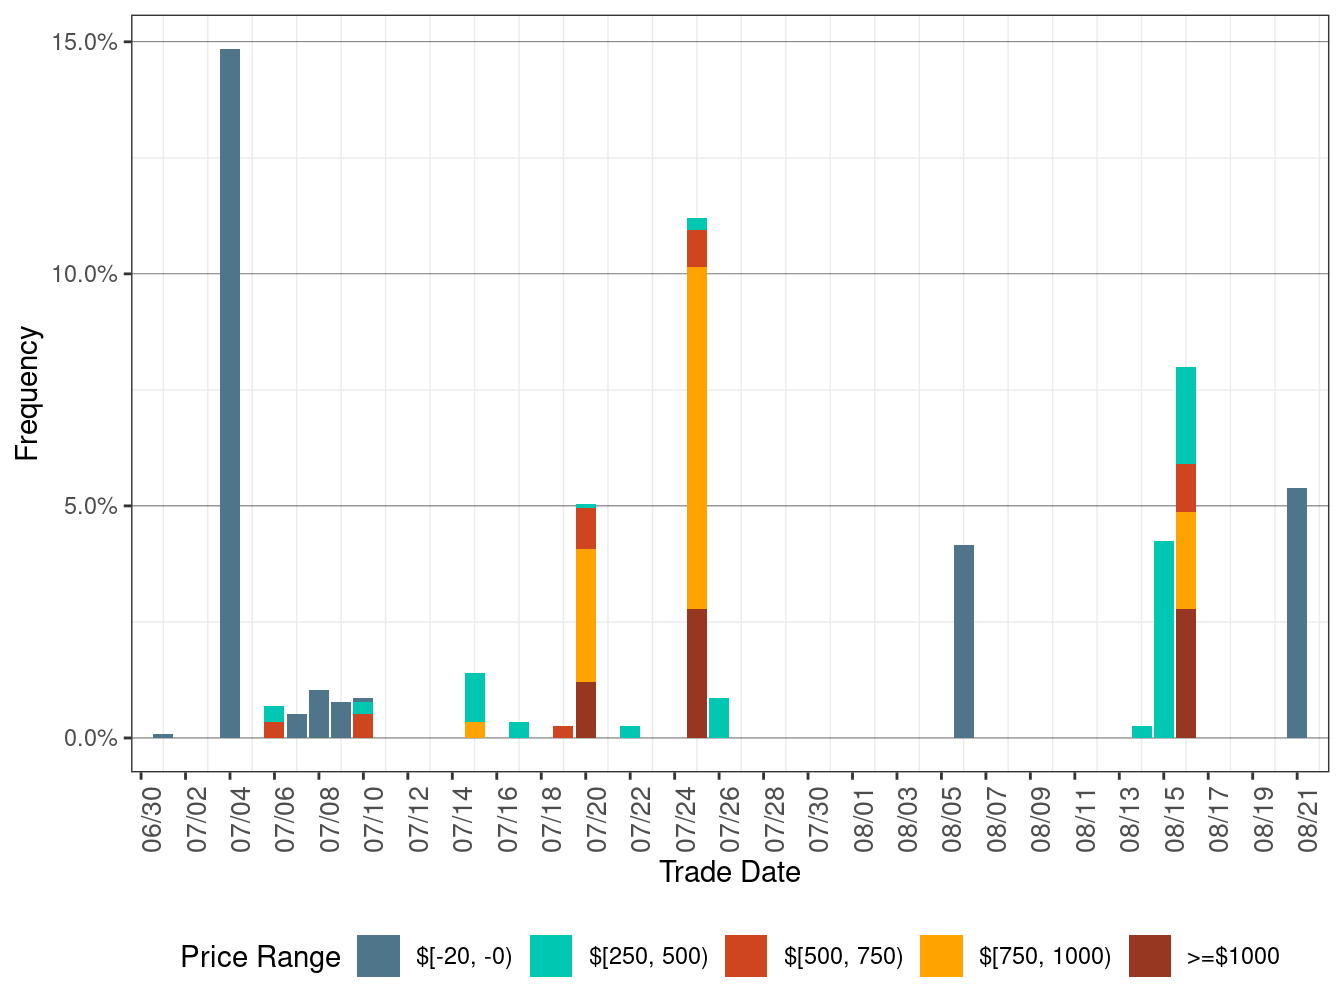
Figure 6 below shows the daily frequency of positive price spikes and negative prices by price range for the DLAPs in RTD.
The cumulative frequency of prices above $250/MWh decreased to 0.40 percent in August from 0.67 percent in the previous month, while the cumulative frequency of negative prices decreased to 0.31 percent in August from 0.56 percent in the previous month, correlated with the slight decrease in renewable generation curtailment.
Figure 6: Daily Frequency of RTD DLAP Positive Price Spikes and Negative Prices