Section 3 Market Performance Metrics
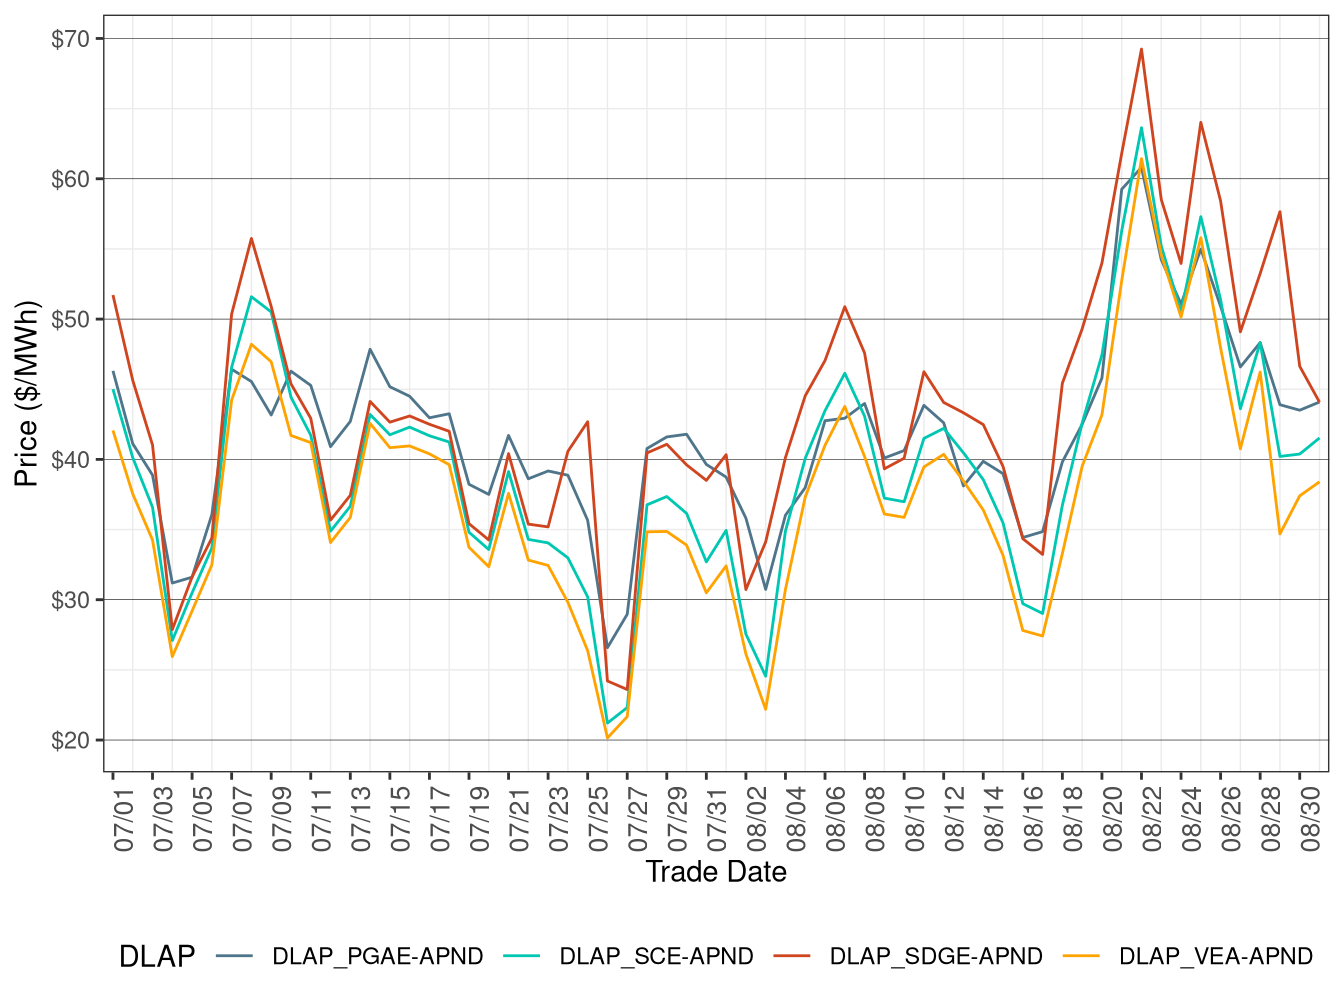
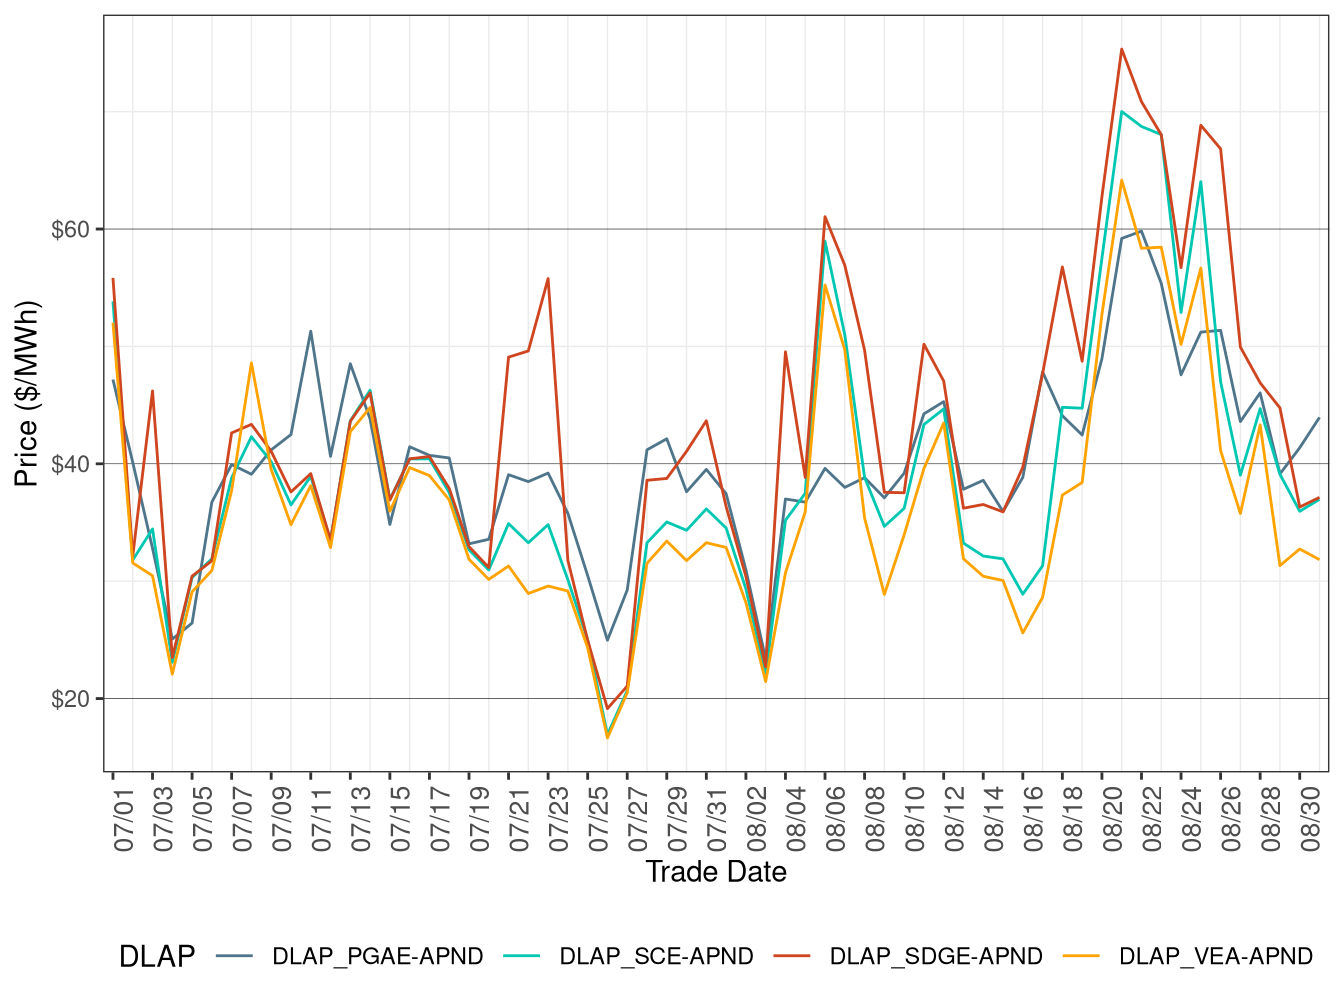
Day-Ahead Prices
Figure 3.1 shows the daily simple average prices for all hours in IFM for each of the four default load-aggregation points (DLAP): PG&E, SCE, SDG&E, and VEA.
Average Day-Ahead DLAP prices rose compared to the previous month, aligning with the increase in load discussed in the last section.
TABLE 3.1 below lists the binding constraints that resulted in relatively high or low DLAP prices on certain dates.
Figure 3.1: IFM (Day-Ahead) Simple Average DLAP Prices (All Hours)
| DLAP LMPs Affected | Dates | Transmission Constraint |
|---|---|---|
| PGAE; VEA | August 1 | LOSBANOS-PANOCHE-230kV line from HE 9 to HE 18 and on the SYCAMORE-SYCA TP2-230kV line from HE 8 to HE 20 |
| PGAE | August 2 | LOSBANOS-PANOCHE-230kV line from HE 9 to HE 18 |
| PGAE; SDGE | August 3 | MOSSLD-LASAGUIL-230kV line from HE 9 to HE 18 and on the LOSBANOS-PANOCHE-230kV line from HE 9 to HE 18 |
| PGAE; VEA; SDGE; SCE | August 4 | CENTER S-MESA CAL-230kV line from HE 10 to HE 17 and on the SYCAMORE-SYCA TP2-230kV line from HE 8 to HE 19 |
| PGAE; VEA; SDGE; SCE | August 5 | SYCA TP2-SYCAMORE-230kV line from HE 8 to HE 18 |
| PGAE; VEA; SDGE; SCE | August 6-7 | SYCA TP2-SYCAMORE-230kV line from HE 8 to HE 19 and on the MIDWAY-VINCENT-500kV line from HE 1 to HE 24 |
| PGAE; VEA | August 8 | SYCA TP2-SYCAMORE-230kV line from HE 8 to HE 19 |
| PGAE; VEA; SDGE; SCE | August 9 | MOSSLD-LASAGUIL-230kV line from HE 9 to HE 18 and on the SYCA TP2-SYCAMORE-230kV line from HE 9 to HE 18 |
| PGAE; VEA; SDGE; SCE | August 10 | LOSBANOS-PANOCHE-230kV line from HE 9 to HE 18 and on the SYCA TP2-SYCAMORE-230kV line from HE 8 to HE 18 |
| PGAE; VEA; SDGE; SCE | August 11 | SYCA TP2-SYCAMORE-230kV line from HE 9 to HE 18 and on the LOSBANOS-PANOCHE-230kV line from HE 11 to HE 18 |
| VEA | August 12 | SYCA TP2-SYCAMORE-230kV line from HE 12 to HE 18 |
| PGAE; VEA; SDGE; SCE | August 13 | ANTELOPE-WIRLWIND-500kV line from HE 9 to HE 19 and on the SYCA TP2-SYCAMORE-230kV line from HE 9 to HE 21 |
| PGAE; VEA; SDGE; SCE | August 14 | SYCA TP2-SYCAMORE-230kV line from HE 8 to HE 19 and on the ANTELOPE-WIRLWIND-500kV from HE 9 to HE 18 |
| PGAE; VEA; SDGE; SCE | August 15 | SYCA TP2-SYCAMORE-230kV line from HE 8 to HE 19 and on the MOSSLD-LASAGUIL-230kV line from HE 9 to HE 17 |
| PGAE; VEA; SDGE; SCE | August 16 | MOSSLD-LASAGUIL-230kV line from HE 9 to HE 18 and on the SYCA TP2-SYCAMORE-230kV line from HE 9 to HE 21 |
| PGAE | August 17 | LOSBANOS-PANOCHE-230kV line from HE 9 to HE 18 and on the SYCA TP2-SYCAMORE-230kV line from HE 9 to HE 23 |
| PGAE; VEA; SDGE; SCE | August 18-20 | SYCA TP2-SYCAMORE-230kV line from HE 8 to HE 21 and on the MOSSLD-LASAGUIL-230kV line from HE 9 to HE 17 |
| PGAE; VEA; SDGE; SCE | August 21 | SYCA TP2-SYCAMORE-230kV line from HE 9 to HE 19 |
| SDGE | August 22-23 | MIDWAY-VINCENT-500kV line from HE 1 to HE 24 and on the SYCA TP2-SYCAMORE-230kV line from HE 10 to HE 19 |
| SDGE | August 24 | LOSBANOS-PANOCHE-230kV line from HE 10 to HE 18 and on the SYCA TP2-SYCAMORE-230kV line from HE 12 to HE 21 |
| SDGE | August 25 | SYCA TP2-SYCAMORE-230kV line from HE 8 to HE 15 and on the MIDWAY-VINCENT-500kV line from HE 10 to HE 24 |
| PGAE; VEA; SDGE; SCE | August 26 | 7820_TL23040_IV_SPS_NG nomogram binding from HE 1 to HE 24 |
| PGAE; VEA; SDGE; SCE | August 27 | SYCA TP2-SYCAMORE-230kV line from HE 9 to HE 21 and on the METCALF-METCALF-230 XFMR from HE 16 to HE 21 |
| PGAE; VEA; SDGE; SCE | August 28 | 7690-CONTRL_INYOKN EXP Nomogram from HE 1 to HE 24 and on the SC21ATP-ARVIN 70kV line from HE 8 to HE 23 |
| PGAE; VEA; SDGE; SCE | August 29 | MIGUEL_BKs_MXFLW_NG nomogram binding from HE 9 to HE 18 |
| PGAE; VEA; SDGE; SCE | August 30 | 7820_TL23040_IV_SPS_NG nomogram binding from HE 8 to HE 22. Congestion is also seen on the LOSBANOS-PANOCHE-230kV line from HE 9 to HE 18 and on the METCALF-METCALF-230 XFMR from HE 17 to HE 21 |
| PGAE; VEA; SDGE; SCE | August 31 | LOSBANOS-PANOCHE-230kV line from HE 9 to HE 17 and on the METCALF-METCALF-230 XFMR from HE 18 to HE 19 |
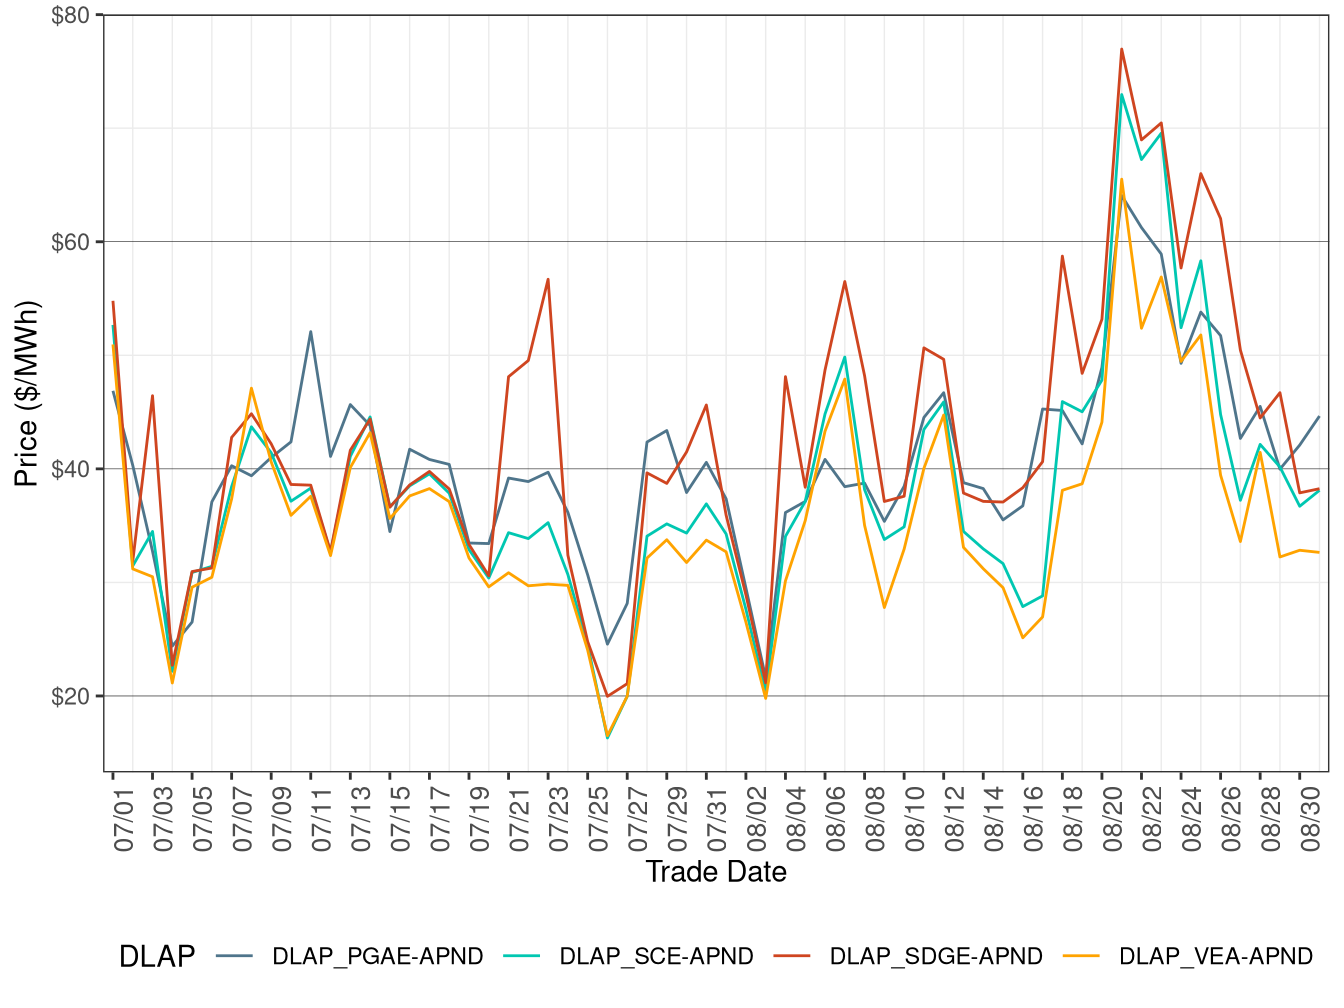
Real-Time Price
Figure 3.2 shows daily simple average prices for all four DLAPs (PG&E, SCE, SDG&E, and VEA) for all hours respectively in FMM.
FMM DLAP prices on average increased compared to the previous month, aligning with the increase in load discussed in the last section.
TABLE 3.2 below lists the binding constraints that resulted in relatively high or low DLAP prices on certain dates.
Figure 3.2: FMM Simple Average DLAP Prices (All Hours)
| DLAP LMPs Affected | Dates | Transmission Constraint |
|---|---|---|
| PGAE;SDGE;VEA;SCE | August 1 | MOSSLD-LASAGUIL-230kV line from HE 9 to HE 17 and on the LOSBANOS-PANOCHE-230kV line from HE 11 to HE 18 |
| PGAE;SDGE | August 2 | MOSSLD-LASAGUIL-230kV line from HE 9 to HE 14 and on the SYCAMORE-SYCA TP2-230kV line from HE 17 to HE 18 |
| PGAE;SDGE | August 3 | LOSBANOS-PANOCHE-230kV line from HE 9 to HE 17 and on the SYCAMORE-SYCA TP2-230kV line from HE 17 to HE 18 |
| PGAE;SDGE;VEA;SCE | August 4-5 | SYCA TP2-SYCAMORE-230kV line from HE 7 to HE 19 |
| PGAE | August 6 | SYCA TP2-SYCAMORE-230kV line from HE 8 to HE 18 |
| PGAE;SDGE;VEA;SCE | August 7 | MIDWAY-VINCENT-500kV line from HE 1 to HE 24 and on the SYCA TP2-SYCAMORE-230kV line from HE 8 to HE 19 |
| PGAE;SDGE;VEA;SCE | August 8-9 | SYCA TP2-SYCAMORE-230kV line from HE 8 to HE 20 |
| PGAE;SDGE;VEA;SCE | August 10 | SYCA TP2-SYCAMORE-230kV line from HE 10 to HE 19 and on the LOSBANOS-PANOCHE-230kV line from HE 10 to HE 19 |
| PGAE;SDGE;VEA;SCE | August 11-12 | SYCA TP2-SYCAMORE-230kV line from HE 9 to HE 19 |
| PGAE;SDGE;VEA;SCE | August 13 | SYCA TP2-SYCAMORE-230kV line from HE 8 to HE 21 and on the MOSSLD-LASAGUIL-230kV line from HE 9 to HE 17 |
| PGAE;SDGE;VEA;SCE | August 14 | MOSSLD-LASAGUIL-230kV line from HE 8 to HE 18 and on the SYCA TP2-SYCAMORE-230kV line from HE 8 to HE 21 |
| PGAE;SDGE;VEA;SCE | August 15-16 | SYCA TP2-SYCAMORE-230kV line from HE 7 to HE 21 and on the MOSSLD-LASAGUIL-230kV line from HE 8 to HE 17 |
| PGAE;SDGE | August 17 | PANOCHE-GATES-230kV line from HE 8 to HE 17 and on the MOSSLD-LASAGUIL-230kV line from HE 9 to HE 18 |
| PGAE;SDGE;VEA;SCE | August 18-19 | SYCA TP2-SYCAMORE-230kV line from HE 8 to HE 22 and on the LOSBANOS-PANOCHE-230kV line from HE 11 to HE 19 |
| PGAE;SDGE;VEA;SCE | August 20 | MIDWAY-VINCENT-500kV line from HE 10 to HE 24 and on the LOSBANOS-PANOCHE-230kV line from HE 11 to HE 18 |
| PGAE;SDGE;VEA;SCE | August 23 | SYCA TP2-SYCAMORE-230kV line from HE 11 to HE 19 and on the MIDWAY-VINCENT-500kV line from HE 13 to HE 15 |
| PGAE;SDGE | August 24 | SYCA TP2-SYCAMORE-230kV line from HE 8 to HE 19 and on the MIDWAY-VINCENT-500kV line from HE 19 to HE 24 |
| PGAE;SDGE;VEA;SCE | August 25 | 7820_TL 230S_OVERLOAD_NG nomogram binding from HE 15 to HE 24 |
| PGAE;SDGE;VEA;SCE | August 26 | LOSBANOS-PANOCHE-230kV line from HE 10 to HE 18 and on the SUNCREST-SUNC TP1-230kV line from HE 12 to HE 23 |
| PGAE;SDGE;VEA;SCE | August 27 | SYCA TP2-SYCAMORE-230kV line from HE 8 to HE 18 and on the LOSBANOS-PANOCHE-230kV line from HE 9 to HE 18 |
| PGAE;SDGE;VEA;SCE | August 28 | NEWARK-NORTHERN 115kV line from HE 7 to HE 24 |
| VEA;SDGE | August 29 | MIGUEL_BKs_MXFLW_NG nomogram binding from HE 9 to HE 14 |
| PGAE;SDGE;VEA;SCE | August 30-31 | LOSBANOS-PANOCHE-230kV line from HE 9 to HE 18 and on the METCALF-METCALF-230 XFMR from HE 17 to HE 23 |
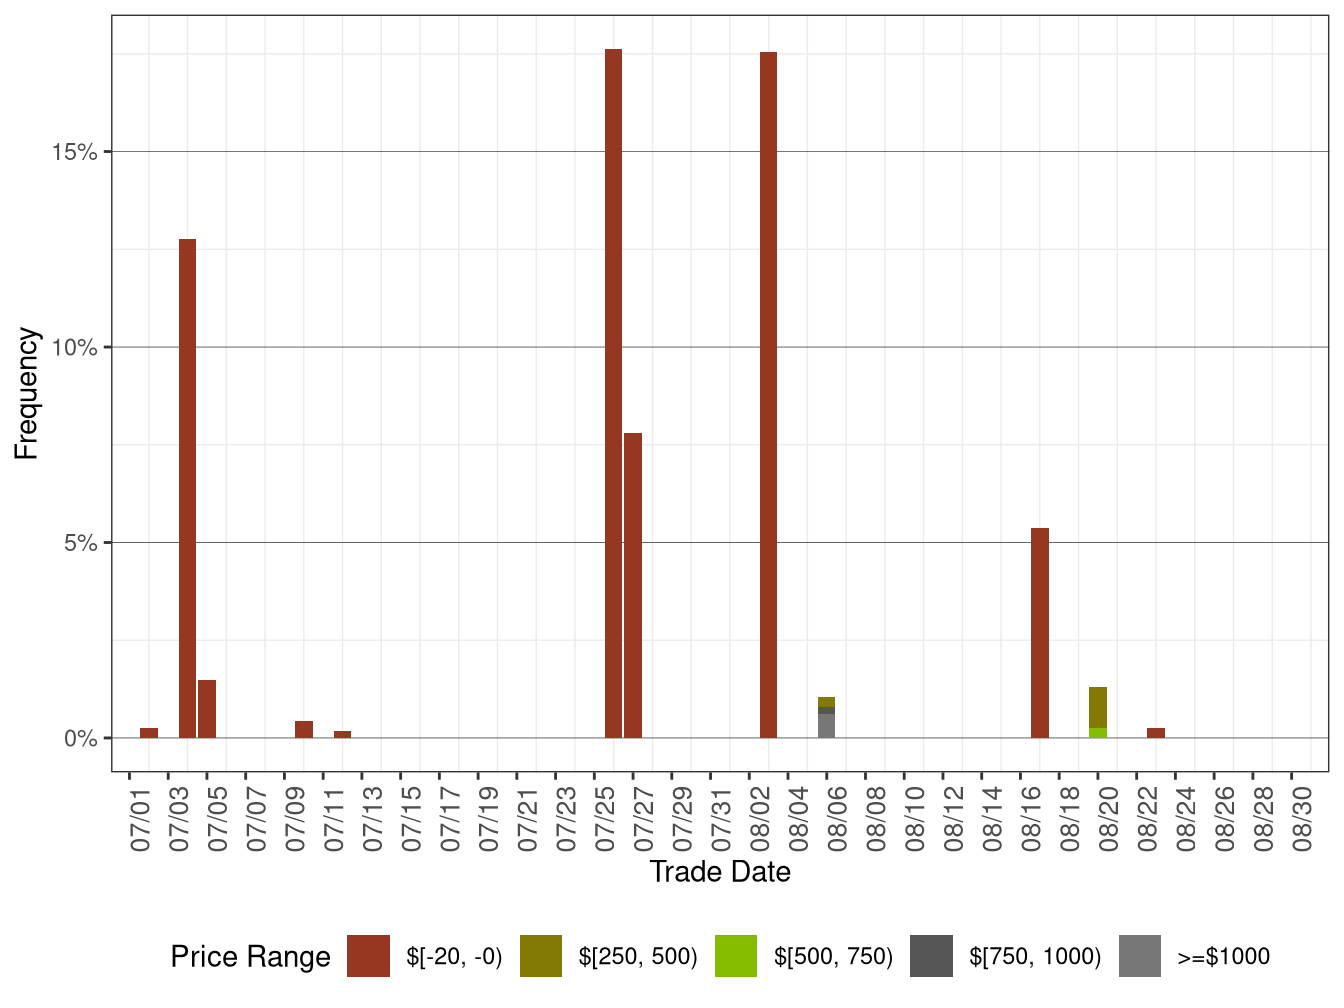
Figure 3.3 below shows the daily frequency of positive price spikes and negative prices by price range for the DLAPs in the FMM.
The cumulative frequency of prices in FMM above $250/MWh increased from 0 in July to 0.042 percent in August, while the cumulative frequency of negative prices decreased from 1.85 percent in July to 1.08 in August, correlated with an decrease in renewable generation curtailment.
Figure 3.3: Daily Frequency of FMM DLAP Positive Price Spikes and Negative Prices
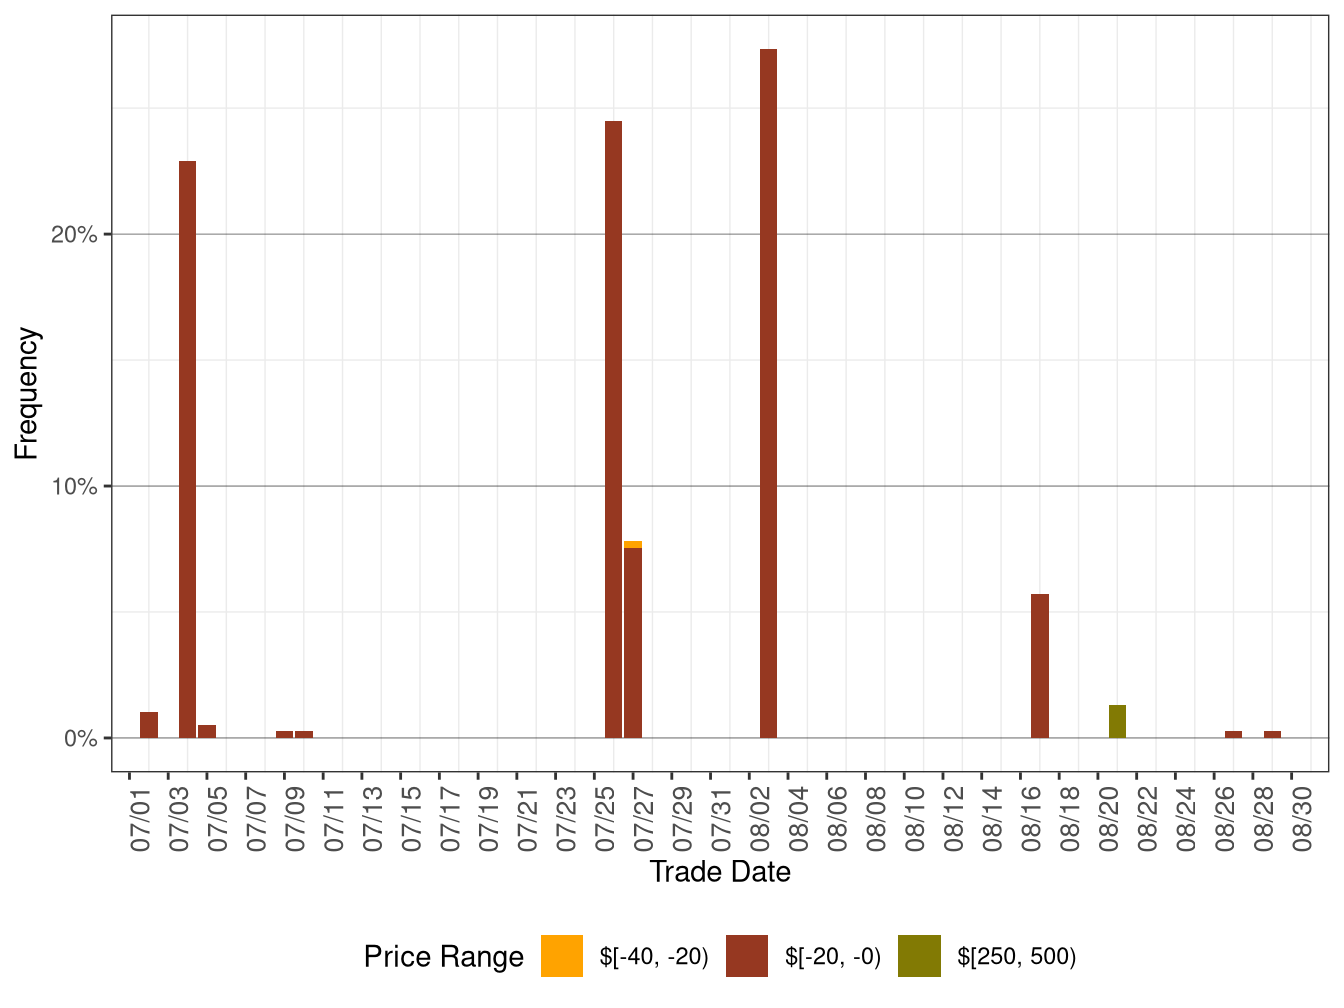
Figure 3.4 shows daily simple average prices for all the DLAPs (PG&E, SCE, SDG&E, and VEA) for all hours respectively in RTD.
RTD DLAP prices on average increased compared to the previous month, aligning with the increase in load discussed in the last section.
TABLE 3.3 below lists the binding constraints that resulted in relatively high or low DLAP prices on certain dates.
Figure 3.4: RTD Simple Average DLAP Prices (All Hours)
| DLAP LMPs Affected | Dates | Transmission Constraint |
|---|---|---|
| PGAE;SDGE;VEA;SCE | August 1 | MOSSLD-LASAGUIL-230kV line from HE 9 to HE 17 and on the LOSBANOS-PANOCHE-230kV line from HE 11 to HE 18 |
| PGAE;SDGE | August 2 | MOSSLD-LASAGUIL-230kV line from HE 9 to HE 11 and on the SYCAMORE-SYCA TP2-230kV line from HE 9 to HE 19 |
| PGAE;SDGE | August 3 | LOSBANOS-PANOCHE-230kV line from HE 9 to HE 17 and on the SYCAMORE-SYCA TP2-230kV line from HE 17 to HE 18 |
| PGAE;SDGE;VEA;SCE | August 4-5 | SYCA TP2-SYCAMORE-230kV line from HE 7 to HE 19 |
| PGAE | August 6-7 | MIDWAY-VINCENT-500kV line from HE 1 to HE 24 and on the SYCA TP2-SYCAMORE-230kV line from HE 8 to HE 17 |
| PGAE;SDGE;VEA;SCE | August 8 | SYCA TP2-SYCAMORE-230kV line from HE 8 to HE 20 |
| PGAE;SDGE;VEA;SCE | August 9 | J HINDS2-MIRAGE-230kV line from HE 1 to HE 24 and on the SYCA TP2-SYCAMORE-230kV line from HE 8 to HE 19 |
| PGAE;SDGE;VEA;SCE | August 10 | SYCA TP2-SYCAMORE-230kV line from HE 10 to HE 19 and on the LOSBANOS-PANOCHE-230kV line from HE 10 to HE 19 |
| PGAE;SDGE;VEA;SCE | August 11-12 | SYCA TP2-SYCAMORE-230kV line from HE 9 to HE 19 |
| PGAE;SDGE;VEA;SCE | August 13 | SYCA TP2-SYCAMORE-230kV line from HE 8 to HE 21 and on the MOSSLD-LASAGUIL-230kV line from HE 9 to HE 18 |
| PGAE;SDGE;VEA;SCE | August 14 | MOSSLD-LASAGUIL-230kV line from HE 8 to HE 18 and on the SYCA TP2-SYCAMORE-230kV line from HE 8 to HE 21 |
| PGAE;SDGE;VEA;SCE | August 15-17 | SYCA TP2-SYCAMORE-230kV line from HE 8 to HE 21 and on the MOSSLD-LASAGUIL-230kV line from HE 8 to HE 16 |
| PGAE;SDGE;VEA;SCE | August 18 | SYCA TP2-SYCAMORE-230kV line from HE 8 to HE 22 and on the LOSBANOS-PANOCHE-230kV line from HE 11 to HE 19 |
| PGAE;SDGE;VEA;SCE | August 19 | LOSBANOS-PANOCHE-230kV line from HE 10 to HE 19 and on the SYCA TP2-SYCAMORE-230kV line from HE 9 to HE 22 |
| PGAE | August 20 | SYCA TP2-SYCAMORE-230kV line from HE 8 to HE 19 and on the LOSBANOS-PANOCHE-230kV line from HE 11 to HE 19 |
| PGAE | August 21 | SYCA TP2-SYCAMORE-230kV line from HE 8 to HE 21 and on the PANOCHE-GATES-230kV line from HE 15 to HE 17 |
| PGAE;SDGE;VEA;SCE | August 22 | MIDWAY-VINCENT-500kV line from HE 8 to HE 18 |
| PGAE | August 23 | MIDWAY-VINCENT-500kV line from HE 12 to HE 24 and on the SYCA TP2-SYCAMORE-230kV line from HE 13 to HE 19 |
| PGAE;SDGE | August 24 | SYCA TP2-SYCAMORE-230kV line from HE 8 to HE 20 and on the MIDWAY-VINECNT-500kV line from HE 17 to HE 24 |
| PGAE;SDGE | August 25 | MIDWAY-VINCENT-500kV line from HE 1 to HE 19 and on the SYCA TP2-SYCAMORE-230kV line from HE 10 to HE 20 |
| PGAE;SDGE;VEA;SCE | August 26 | LOSBANOS-PANOCHE-230kV line from HE 10 to HE 18 and on the SUNCREST-SUNC TP1-230kV line from HE 12 to HE 23 |
| PGAE;SDGE;VEA;SCE | August 27 | SYCA TP2-SYCAMORE-230kV line from HE 8 to HE 18 and on the LOSBANOS-PANOCHE-230kV line from HE 9 to HE 18 |
| PGAE;SDGE;VEA;SCE | August 28 | NEWARK-NORTHERN 115kV line from HE 7 to HE 24 |
| VEA;SDGE | August 29 | MIGUEL_BKs_MXFLW_NG nomogram binding from HE 9 to HE 14 |
| PGAE;SDGE;VEA;SCE | August 30-31 | LOSBANOS-PANOCHE-230kV line from HE 9 to HE 18 and on the METCALF-METACLF-230 XFMR from HE 17 to HE 23 |
Figure 3.5 below shows the daily frequency of positive price spikes and negative prices by price range for the DLAPs in RTD.
The cumulative frequency of prices in RTD above $250/MWh increased from 0 percent in July to 0.0756 percent, while the cumulative frequency of negative prices decreased from 1.31 percent in July to 0.748 percent in August, correlated with an decrease in renewable generation curtailment.
Figure 3.5: Daily Frequency of RTD DLAP Positive Price Spikes and Negative Prices