3 Market Performance Metrics
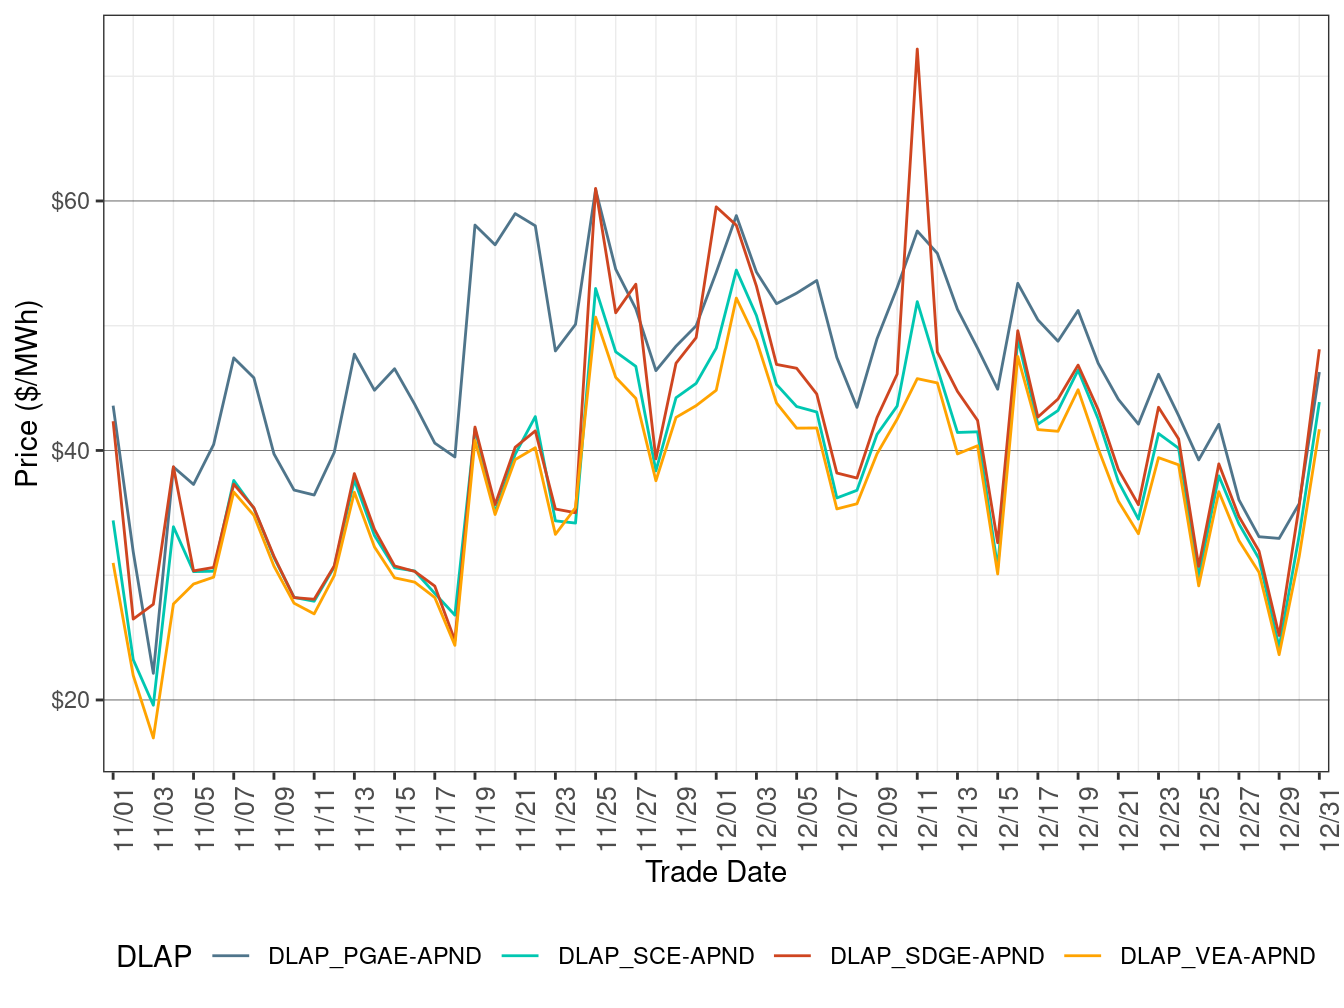
Day-Ahead Prices
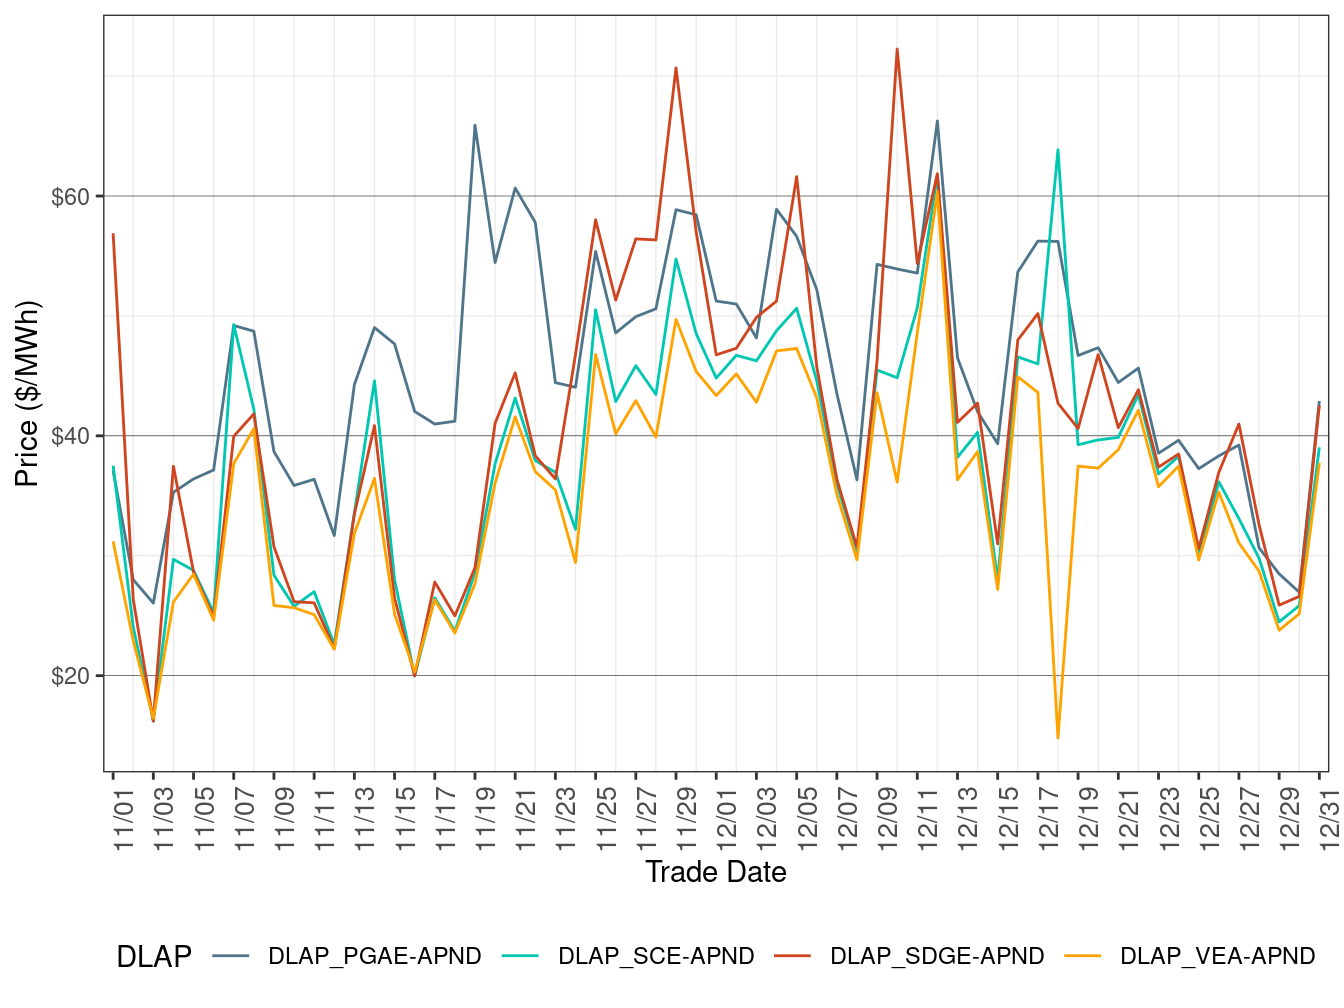
Figure 2 shows the daily simple average prices for all hours in IFM for each of the four default load-aggregation points (DLAP): PG&E, SCE, SDG&E, and VEA.
Day-Ahead DLAP prices on average decreased this month compared to the previous month.
TABLE 3 below lists the binding constraints that resulted in relatively high or low DLAP prices on certain dates.
Figure 2: IFM (Day-Ahead) Simple Average DLAP Prices (All Hours)
| DLAP LMPs Affected | Dates | Transmission Constraint |
|---|---|---|
| SDGE | December 11 | MIGUEL_BKs_MXFLW_NG nomogram |
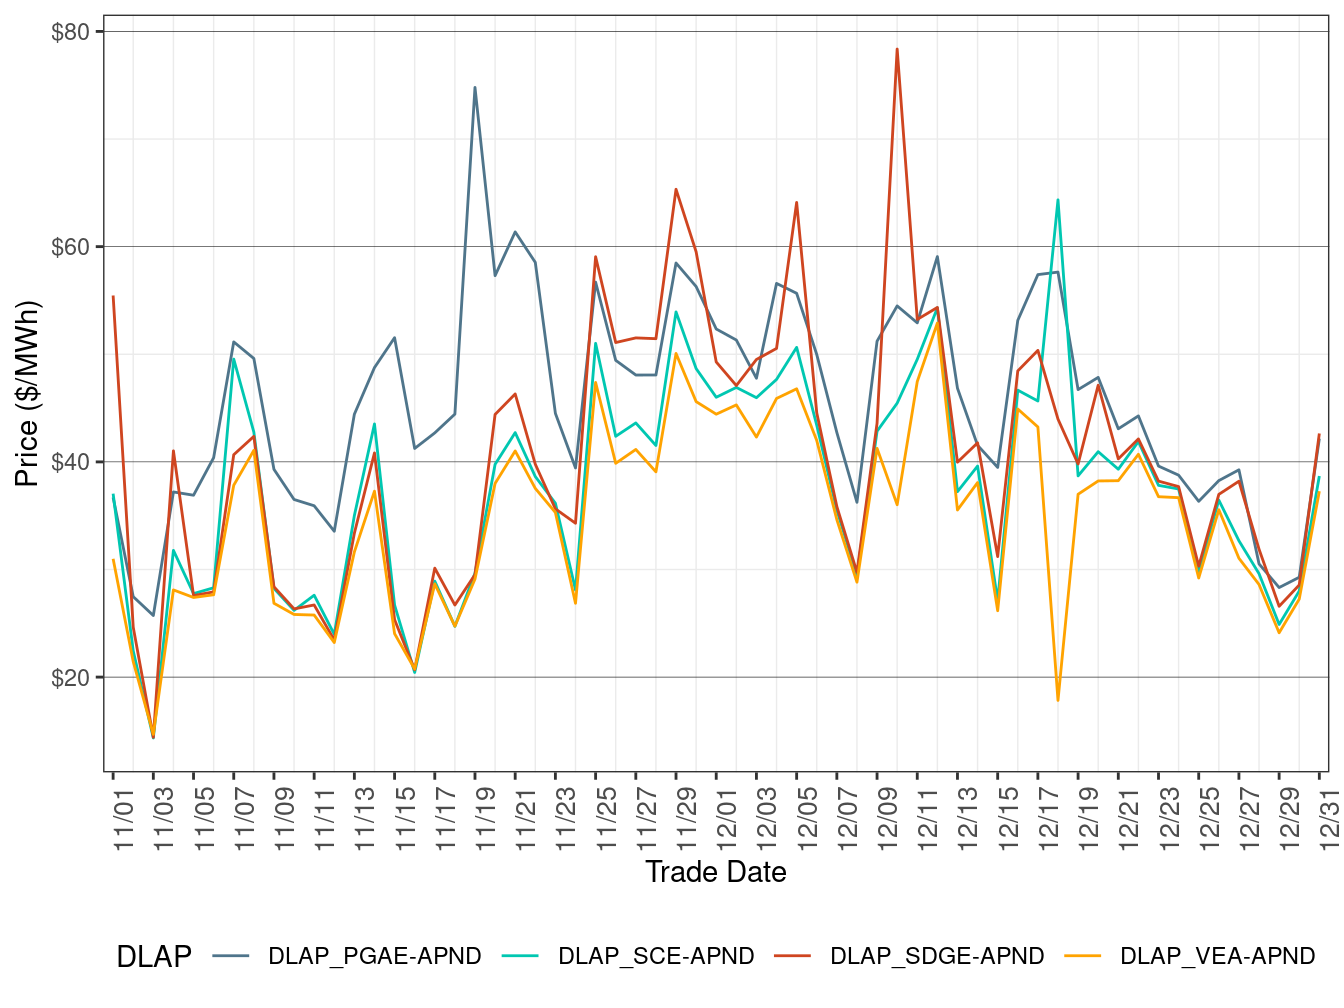
Real-Time Price
Figure 3 shows daily simple average prices for all four DLAPs (PG&E, SCE, SDG&E, and VEA) for all hours respectively in FMM.
FMM DLAP prices on average increased this month compared to the previous month.
TABLE 4 below lists the binding constraints that resulted in relatively high or low DLAP prices on certain dates.
Figure 3: FMM Simple Average DLAP Prices (All Hours)
| DLAP LMPs Affected | Dates | Transmission Constraint |
|---|---|---|
| SDGE | December 10 | MIGUEL_BKs_MXFLW_NG nomogram |
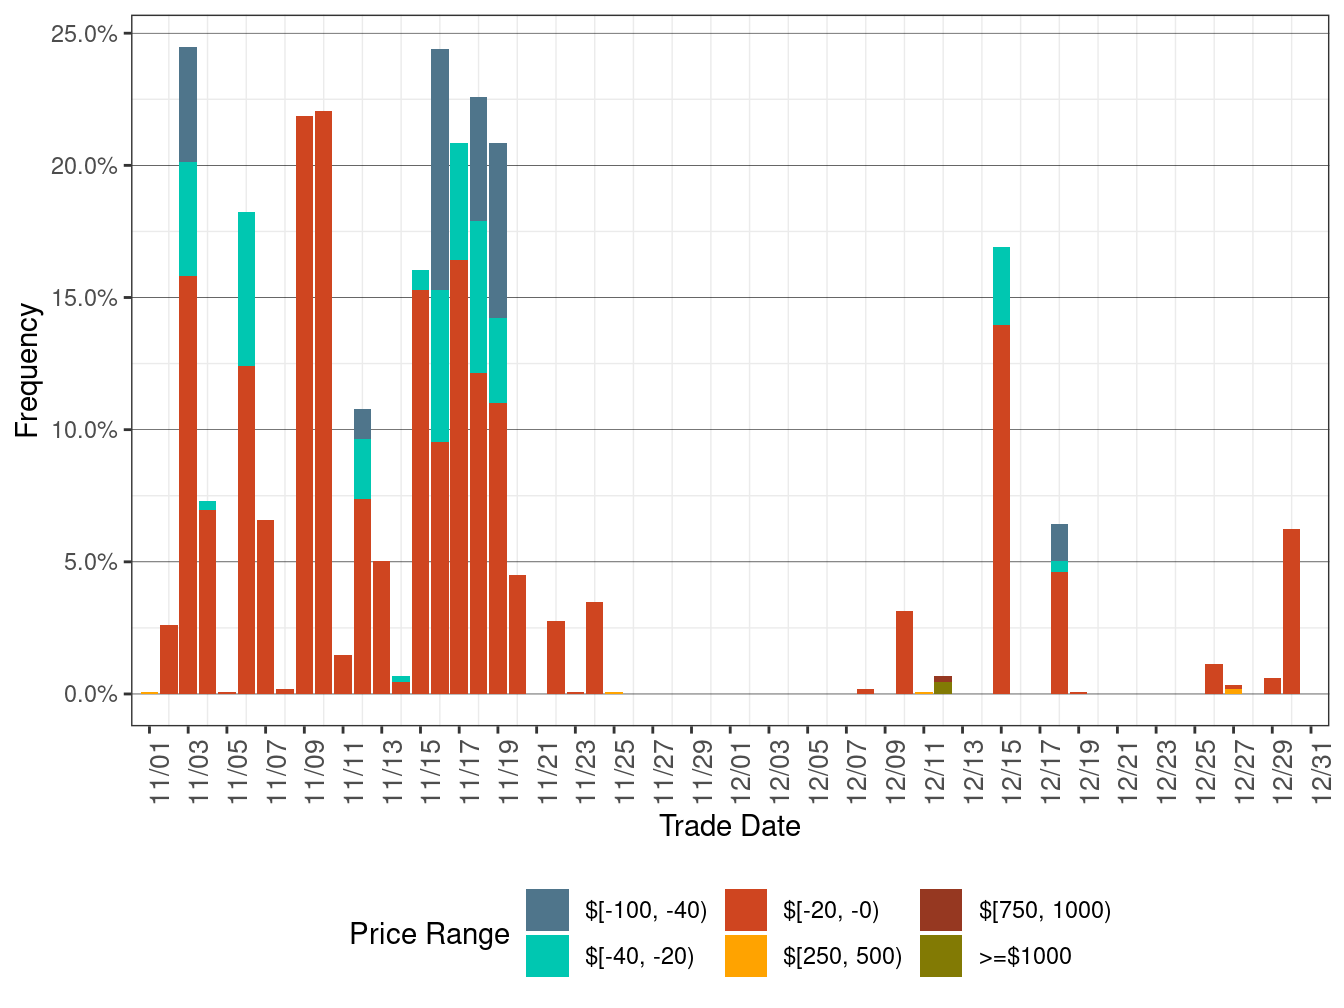
Figure 4 below shows the daily frequency of positive price spikes and negative prices by price range for the DLAPs in the FMM.
The cumulative frequency of prices in FMM above $250/MWh went down to 0 percent in December from 0.01 percent in the previous month, while the cumulative frequency of negative prices decreased to 0.87 percent in December from 7.33 percent in the previous month.
Figure 4: Daily Frequency of FMM DLAP Positive Price Spikes and Negative Prices
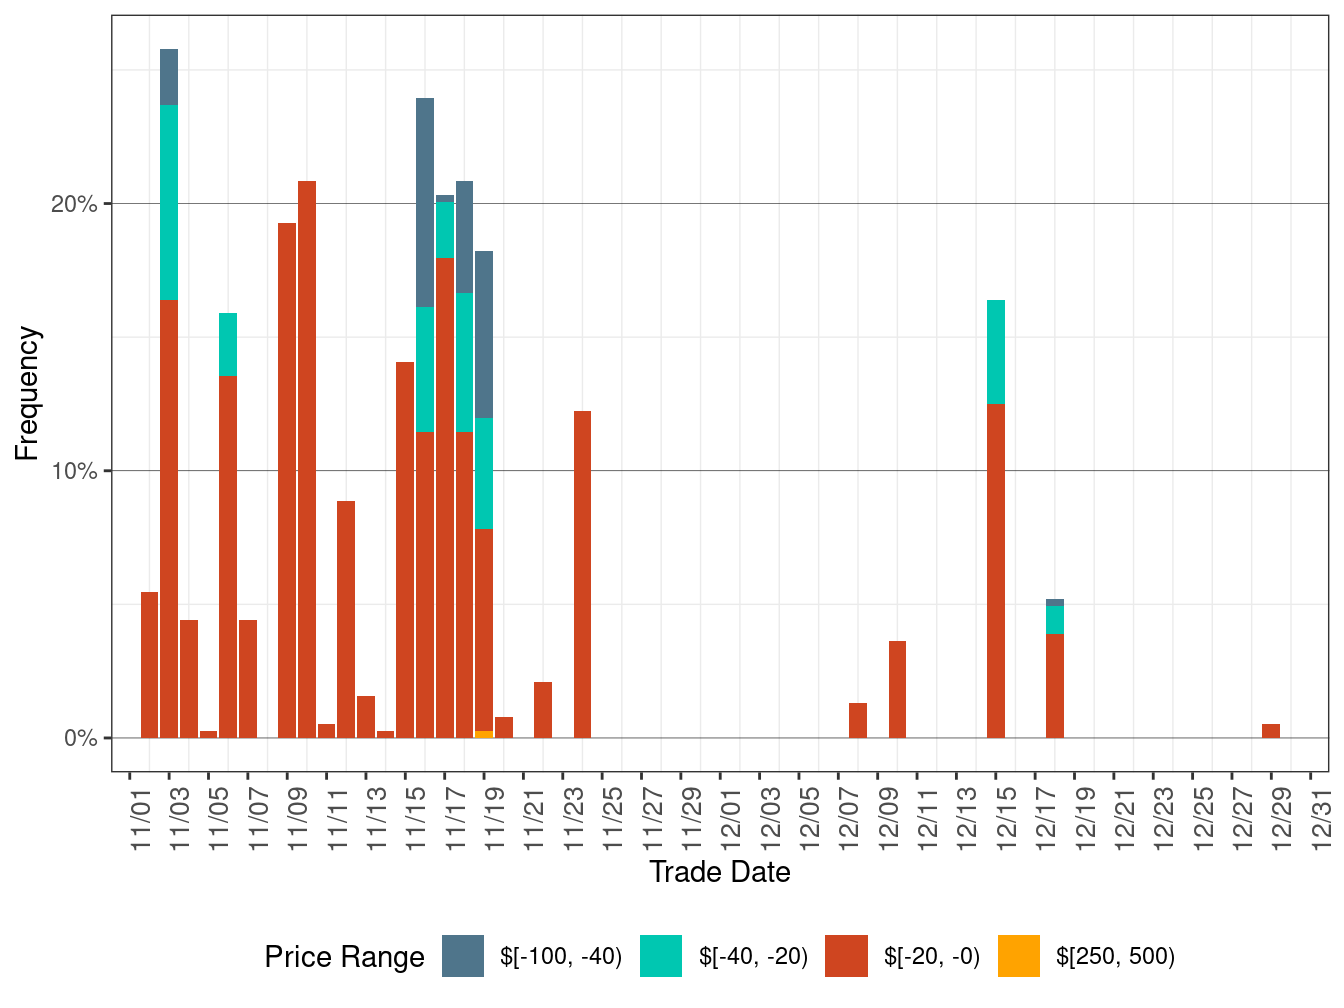
Figure 5 shows daily simple average prices for all the DLAPs (PG&E, SCE, SDG&E, and VEA) for all hours respectively in RTD.
RTD DLAP prices on average increased this month compared to the previous month.
TABLE 5 below lists the binding constraints that resulted in relatively high or low DLAP prices on certain dates.
Figure 5: RTD Simple Average DLAP Prices (All Hours)
| DLAP LMPs Affected | Dates | Transmission Constraint |
|---|---|---|
| SDGE | December 10 | MIGUEL_BKs_MXFLW_NG nomogram |
Figure 6 below shows the daily frequency of positive price spikes and negative prices by price range for the DLAPs in RTD.
The cumulative frequency of prices in RTD above $250/MWh edged up to 0.03 percent in December from 0.01 percent in the previous month, while the cumulative frequency of negative prices dropped to 1.13 percent in December from 7.90 percent in the previous month.
Figure 6: Daily Frequency of RTD DLAP Positive Price Spikes and Negative Prices