8 Western Energy Imbalance Market
On November 1, 2014, the California Independent System Operator Corporation (CAISO) and Portland based PacifiCorp fully activated the Western Energy Imbalance Market (WEIM). This real-time market is the first of its kind in the West. The WEIM allows balancing authorities outside of the CAISO balancing authority area to voluntarily take part in the imbalance energy portion of the CAISO locational marginal price-based real-time market. PacifiCorp, the CAISO, and market participants participated in market simulations prior to the start of the Energy Imbalance Market on November 1, including parallel production from October 1 to November 1.
The WEIM uses state-of-the-art software to analyze regional grid needs and make available low-cost generation to meet demand every five minutes. It can bring many benefits to the West such as cost savings, improving the efficiency of dispatching resources, facilitating the renewable integration, more reliability, etc.
On December 1, 2015, NV Energy (NVE), the Nevada-based utility successfully began participating in the WEIM. With the addition of NV Energy (NVE), the WEIM expanded into Nevada, where the utility serves 2.4 million customers.
On October 1, 2016, Phoenix-based Arizona Public Service (AZPS) and Puget Sound Energy (PSEI) of Washington State successfully began full participation in the WEIM. With the addition of AZPS and PSEI, the WEIM footprint grew to over 5 million consumers in California, Washington, Oregon, Arizona, Idaho, Wyoming, Nevada and Utah.
On October 1, 2017, Portland General Electric Company (PGE) became the fifth western utility to successfully begin full participation in the WEIM. PGE joined AZPS, PSEI, NVE, PacifiCorp and the ISO, together serving over 38 million consumers in eight states: California, Arizona, Oregon, Washington, Utah, Idaho, Wyoming and Nevada.
On April 4, 2018, Boise-based Idaho Power (IPCO) and Powerex of Vancouver (BCHA), British Columbia successfully entered the WEIM, allowing the ISO’s real-time power market to serve energy imbalances occurring within about 55 percent of the electric load in the Western Interconnection. The eight WEIM participants serve more than 42 million consumers in the power grid stretching from the border with Canada south to Arizona, and eastward to Wyoming.
On April 3, 2019, Sacramento Municipal Utility District (SMUD), part of the Balancing Authority of Northern California (BANC), successfully began full participation in the WEIM, becoming the first publicly owned agency to become a WEIM entity.
On April 1, 2020, Seattle City Light (SCL) and Salt River Project (SRP) successfully joined the WEIM. The two utilities serve about 1.5 million customers in the West’s first real-time energy market. Together with SRP and SCL, the WEIM participants represent 61 percent of the load in the Western Electric Coordinating Council (WECC).
On March 25, 2021, the Turlock Irrigation District (TIDC) and the Balancing Area of Northern California (BANC) Phase 2, comprised of the Modesto Irrigation District (MID), the City of Redding, the City of Roseville, and the Western Area Power Administration – Sierra Nevada Region, began participating in the West’s first real-time energy market.
On April 1, 2021, Los Angeles Department of Water and Power (LADWP) and the Public Service Company of New Mexico (PNM) joined the WEIM. PNM’s entrance expanded the real-time energy market into New Mexico.
On June 16, 2021, NorthWestern Energy (NWMT) began participating in the WEIM. With the addition of NWMT, the WEIM footprint extended into Montana, serving consumers across ten states, including portions of Arizona, California, Idaho, Nevada, New Mexico, Oregon, Utah, Washington, Wyoming, and Montana.
On March 2, 2022, Avista Utilities (AVA) and Tacoma Power (TPWR) became the new members of the WEIM, with both utilities serving a combined 600,000 electric customers in the Pacific Northwest.
On May 3, 2022, the Bonneville Power Administration (BPAT) and Tucson Electric Power (TEPC) both formally joined the WEIM, becoming the new participants in the WEIM. With a total of 19 participants, the WEIM serves 77% of the demand for electricity in the Western United States.
On April 5, 2023, Western Area Power Administration (WAPA) Desert Southwest region, El Paso Electric (EPE) and AVANGRID formally began participating in the WEIM, which now represents nearly 80% of the demand for electricity in the Western Interconnection.
WEIM Prices
Figure 36, Figure 37 and Figure 38 show daily simple average prices for WEIM Load Aggregation Points (ELAP) in FMM for all hours, on-peak hours and off-peak hours, respectively.
The FMM ELAP prices in February decreased and were less volatile compared to the previous month. Prices decreased for all WEIM Entities.
Figure 36: WEIM Simple Average LAP Prices (All Hours) in FMM
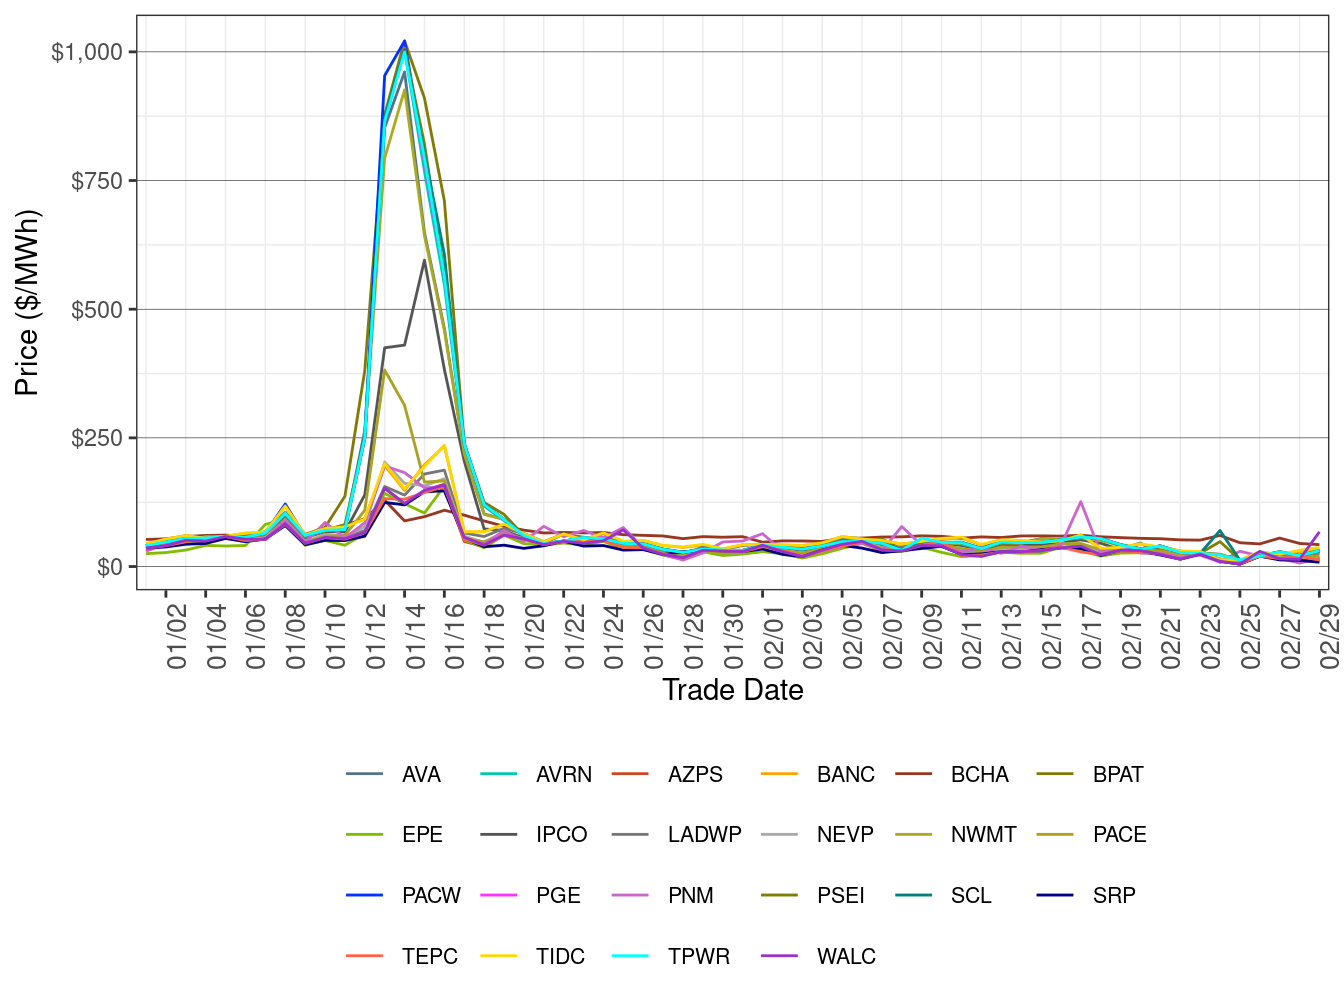
Figure 37: WEIM Simple Average LAP Prices (On-Peak Hours) in FMM
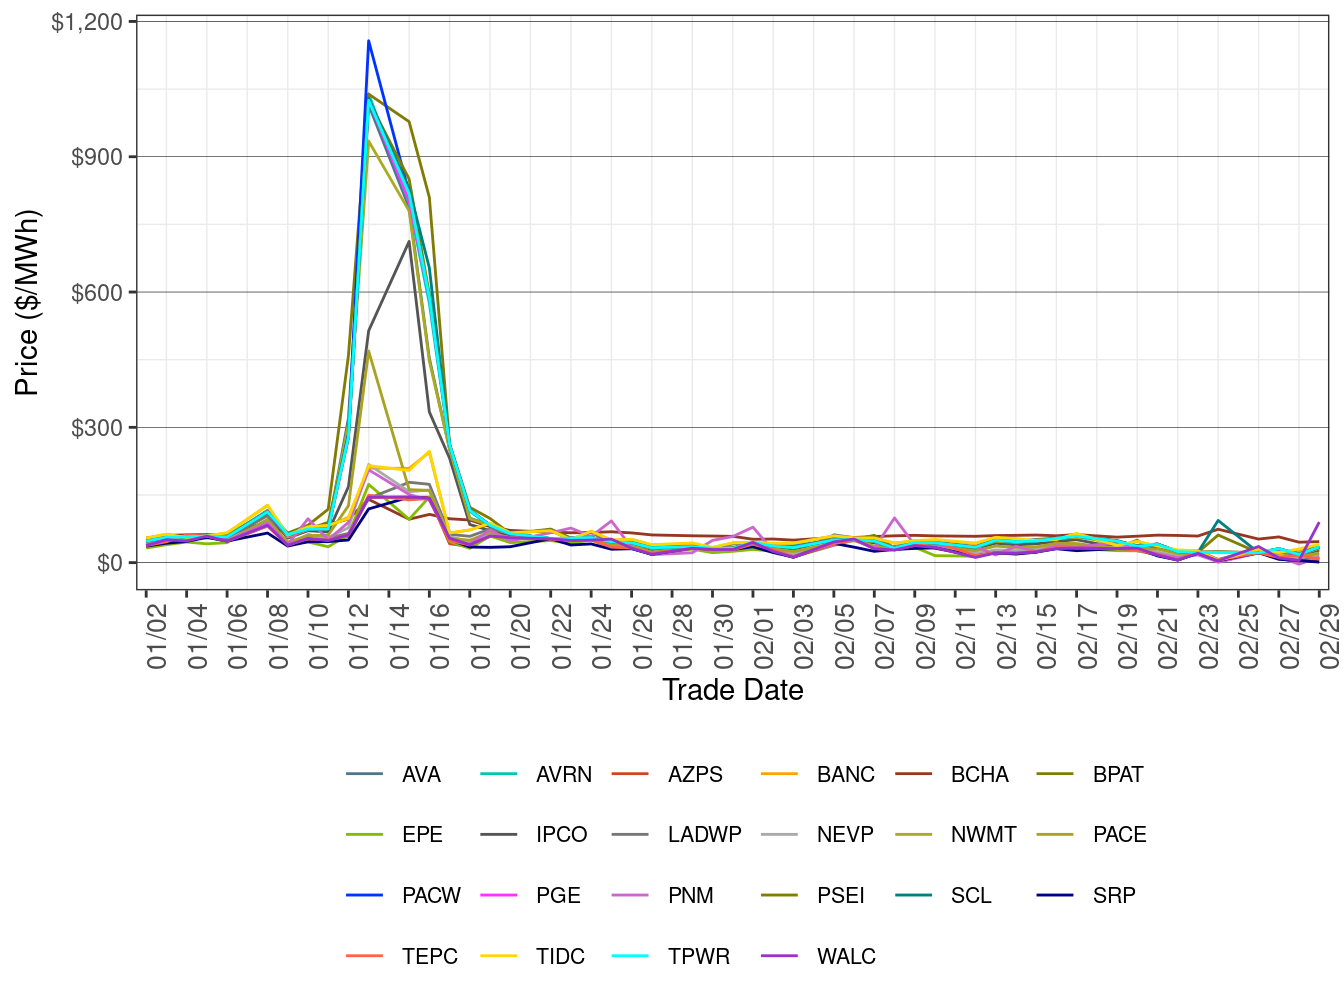
Figure 38: WEIM Simple Average LAP Prices (Off-Peak Hours) in FMM
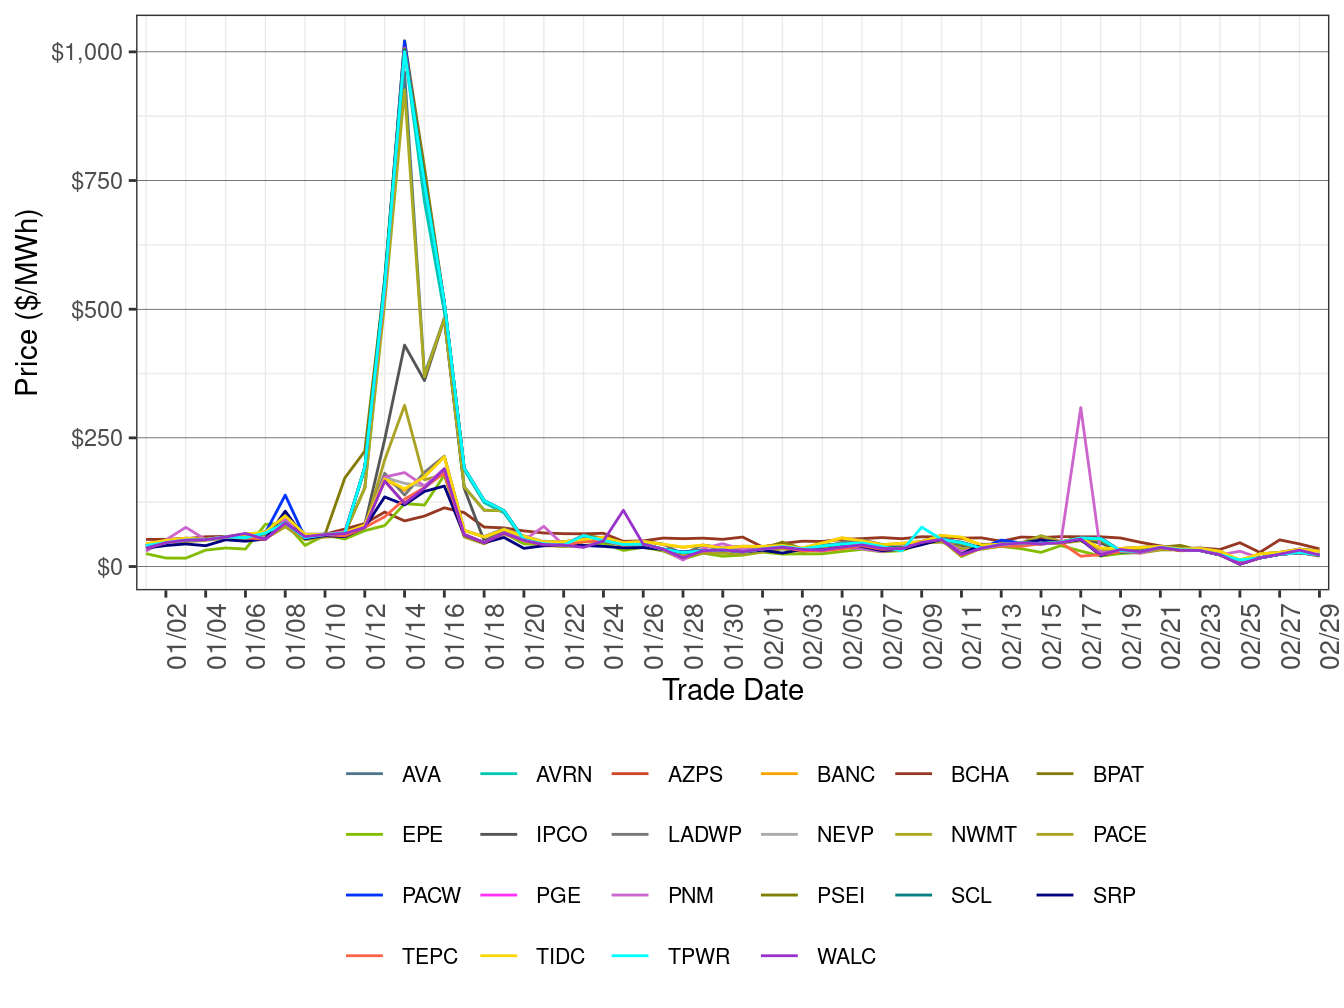
Figure 39, Figure 40 and Figure 41 show daily simple average prices for WEIM LAPs (ELAP) in RTD for all hours, on-peak Hours and off-peak hours, respectively.
The RTD ELAP prices in February decreased and were less volatile compared to the previous month. Prices decreased for all WEIM Entities.
Figure 39: WEIM Simple Average LAP Prices (All Hours) in RTD
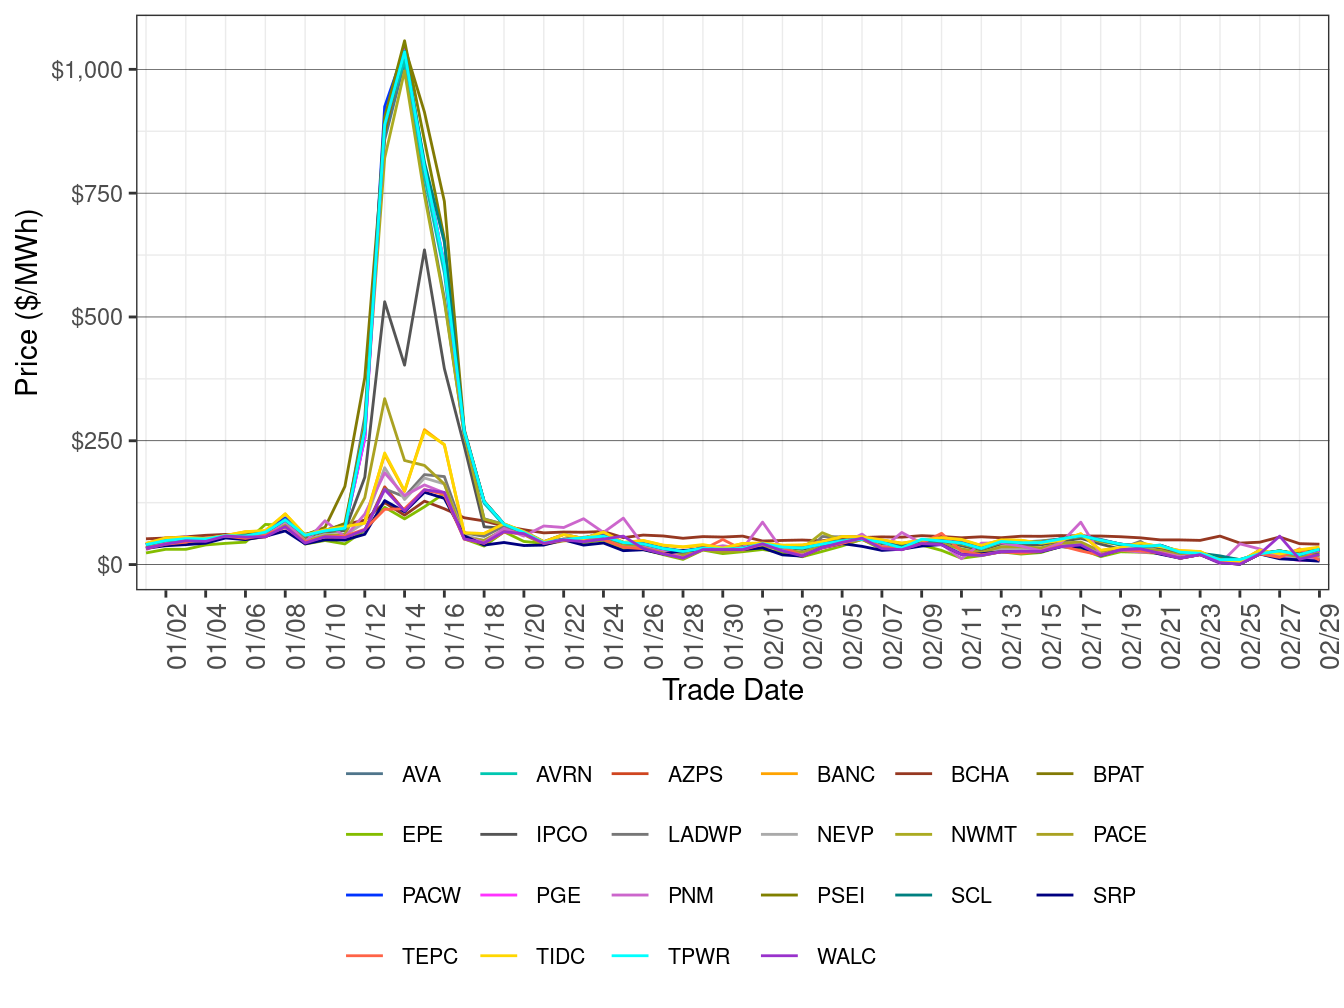
Figure 40: WEIM Simple Average LAP Prices (On-Peak Hours) in RTD
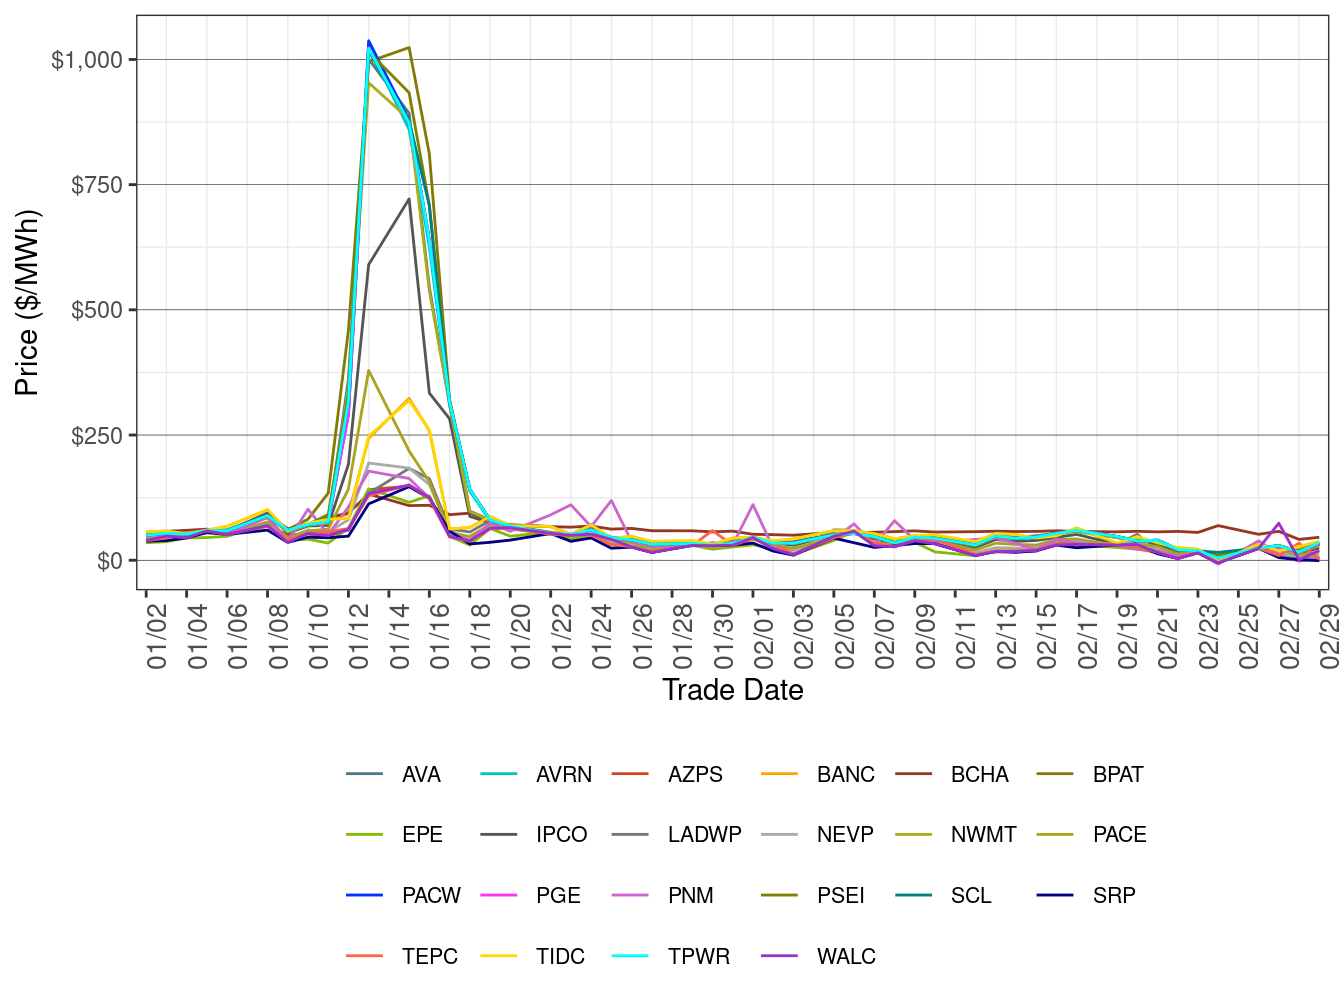
Figure 41: WEIM Simple Average LAP Prices (Off-Peak Hours) in RTD
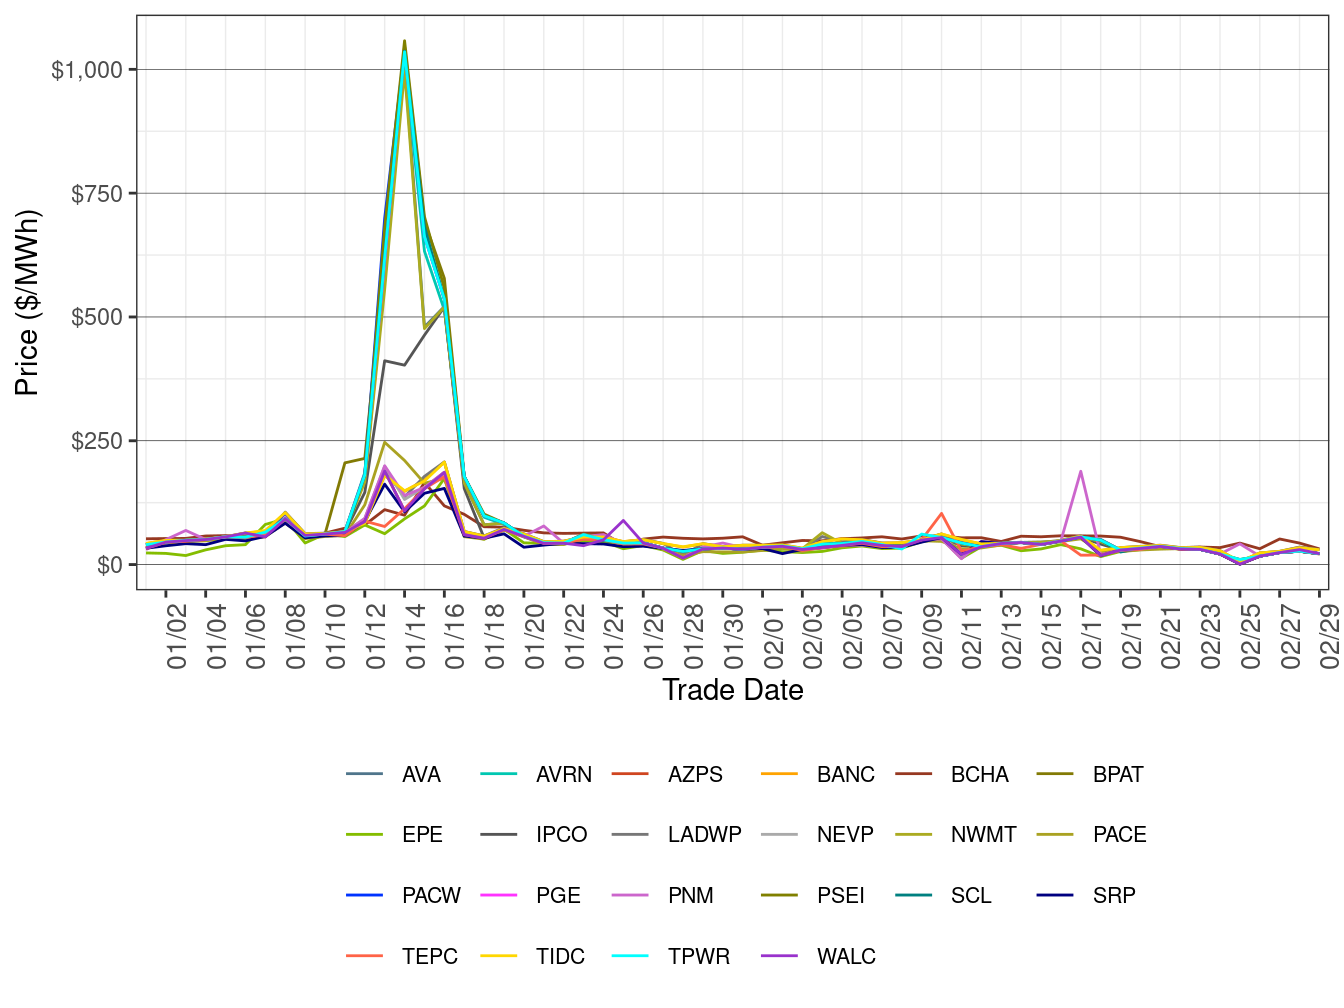
Figure 42 shows the daily price frequency for ELAP prices above $250/MWh and below $0/MWh in FMM.
The cumulative frequency of FMM ELAP prices above $250/MWh decreased to 0.09 percent in February from 7.20 percent in the previous month. The cumulative frequency of negative FMM ELAP prices increased to 5.74 percent in February from 0.71 percent in the previous month.
Figure 42: Daily Frequency of WEIM LAP Positive Price Spikes and Negative Prices in FMM
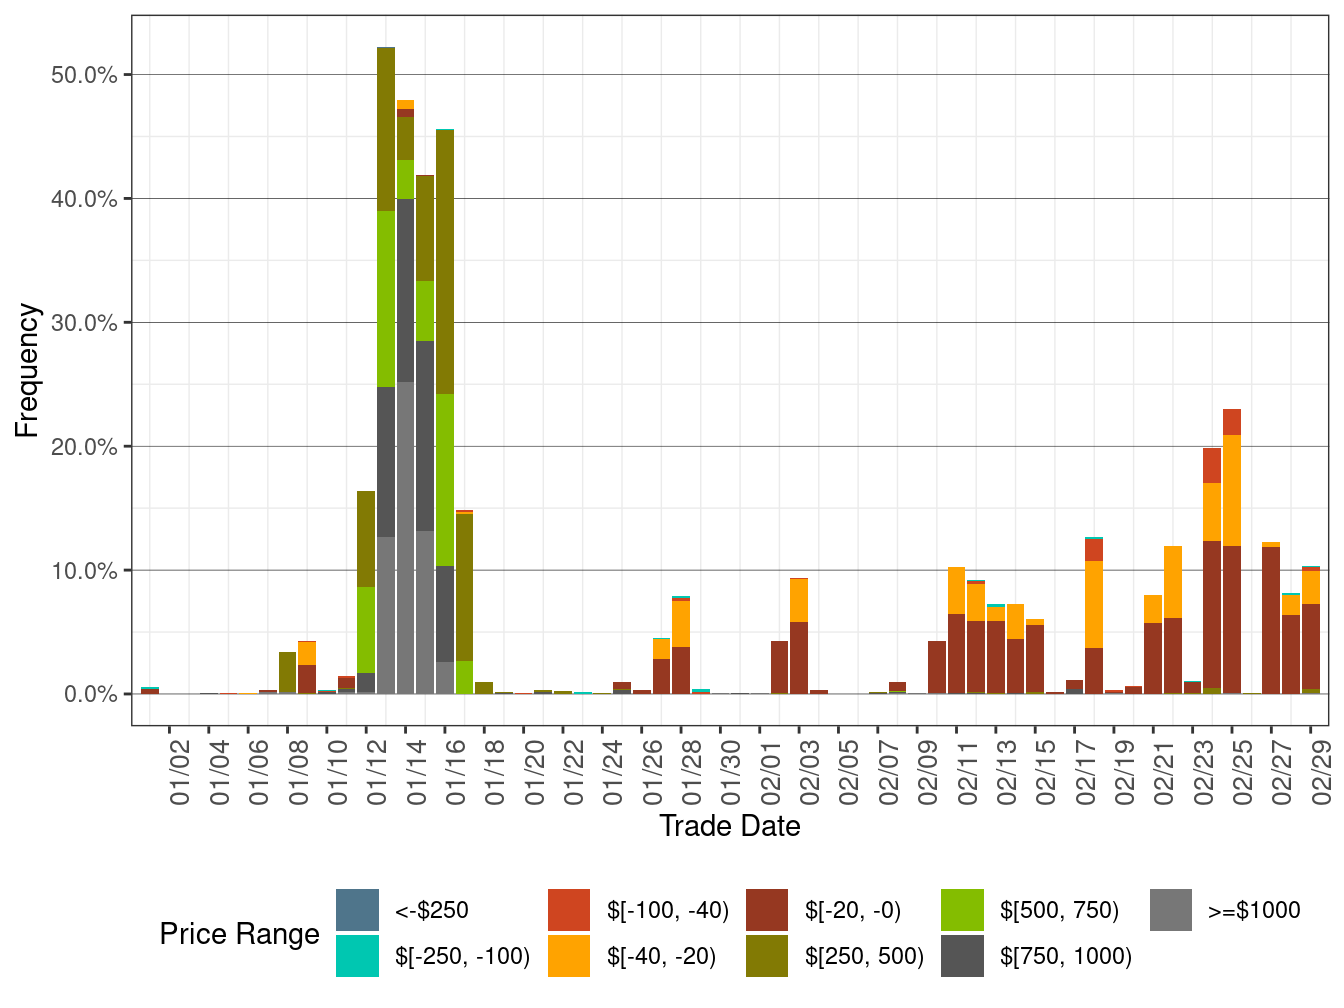
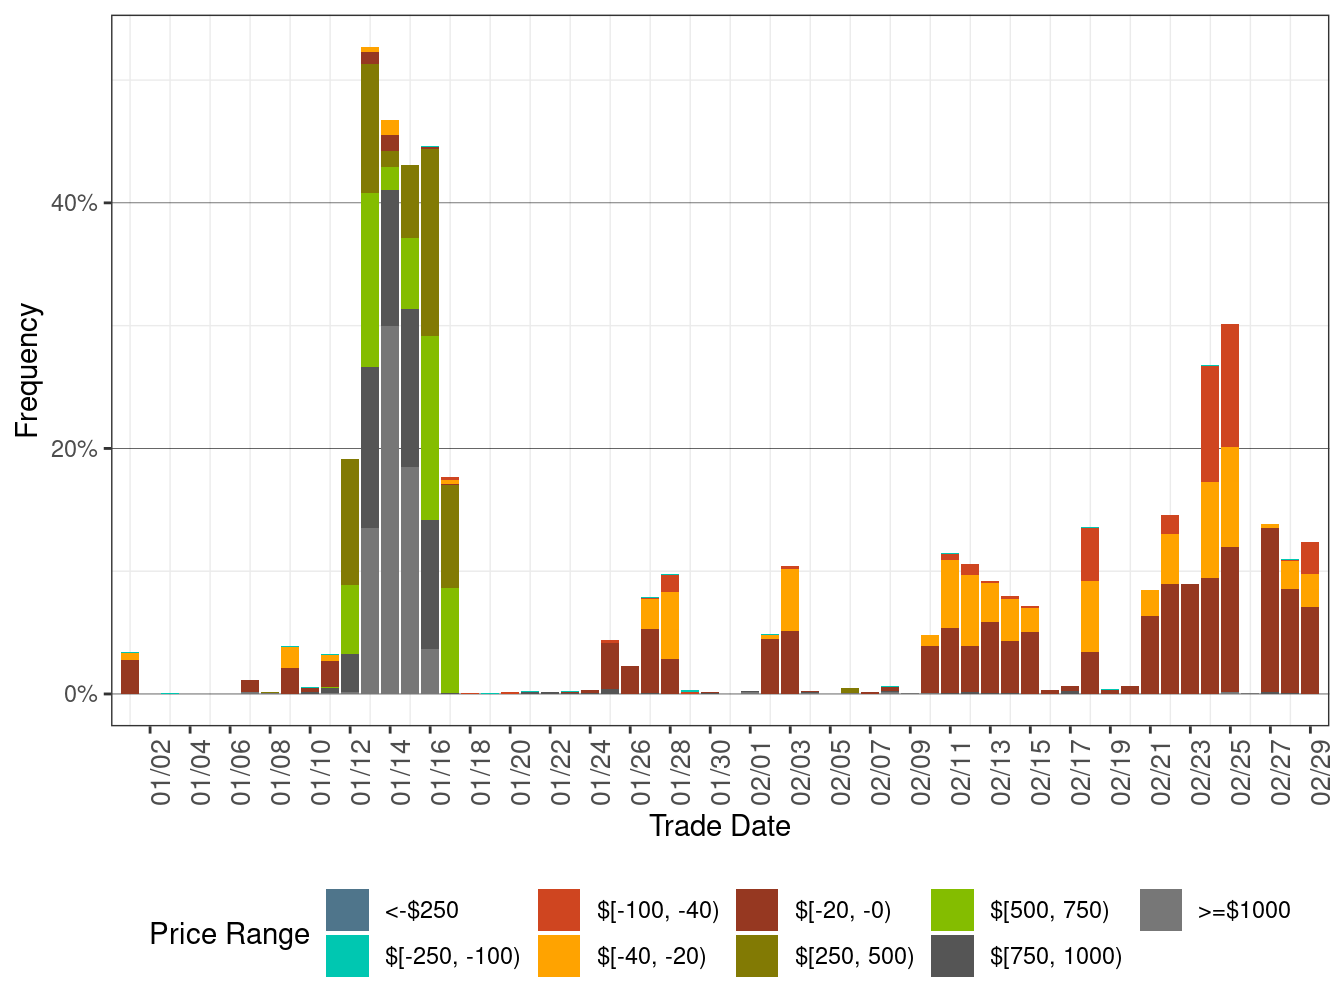
Figure 43 shows the daily price frequency for ELAP prices above $250/MWh and below $0/MWh in RTD.
The cumulative frequency of RTD ELAP prices above $250/MWh increased to 0.08 percent in February from 7.15 percent in the previous month. The cumulative frequency of RTD ELAP negative prices increased to 7.16 percent in February from 1.33 percent in the previous month.
Figure 43: Daily Frequency of WEIM LAP Positive Price Spikes and Negative Prices in RTD
WEIM Transfers
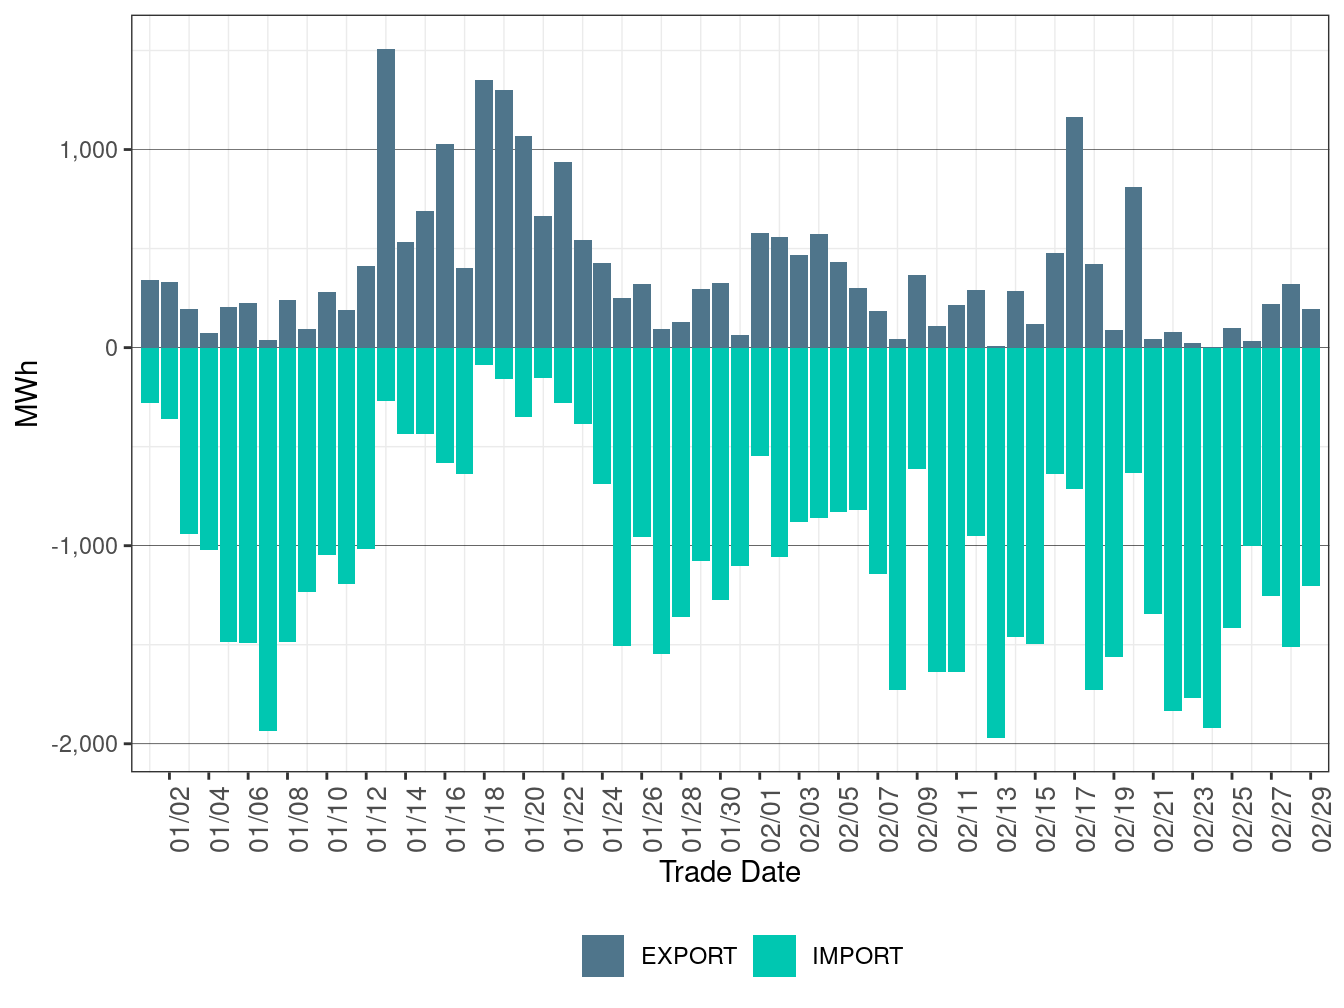
Figures 44 to 66 show the daily volume of WEIM transfers optimized in FMM for each of the BAAs participating in the WEIM. IMPORT represents the total WEIM transfers from other BAAs. EXPORT represents the total WEIM transfers out to other BAAs.
Figure 44: WEIM Transfers for CAISO in FMM
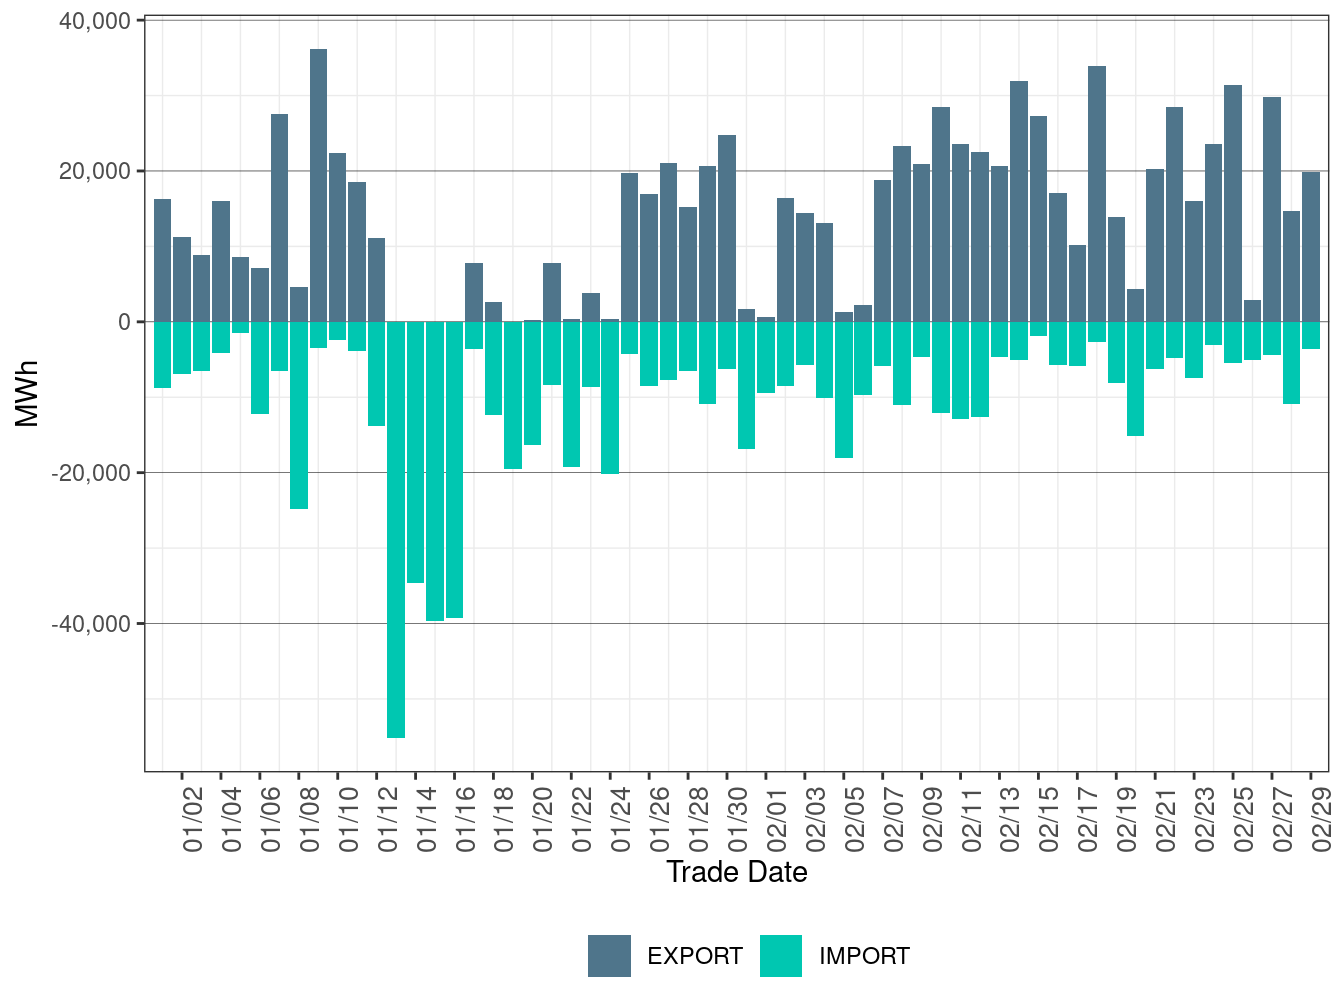
Figure 45: WEIM Transfers for AVA in FMM
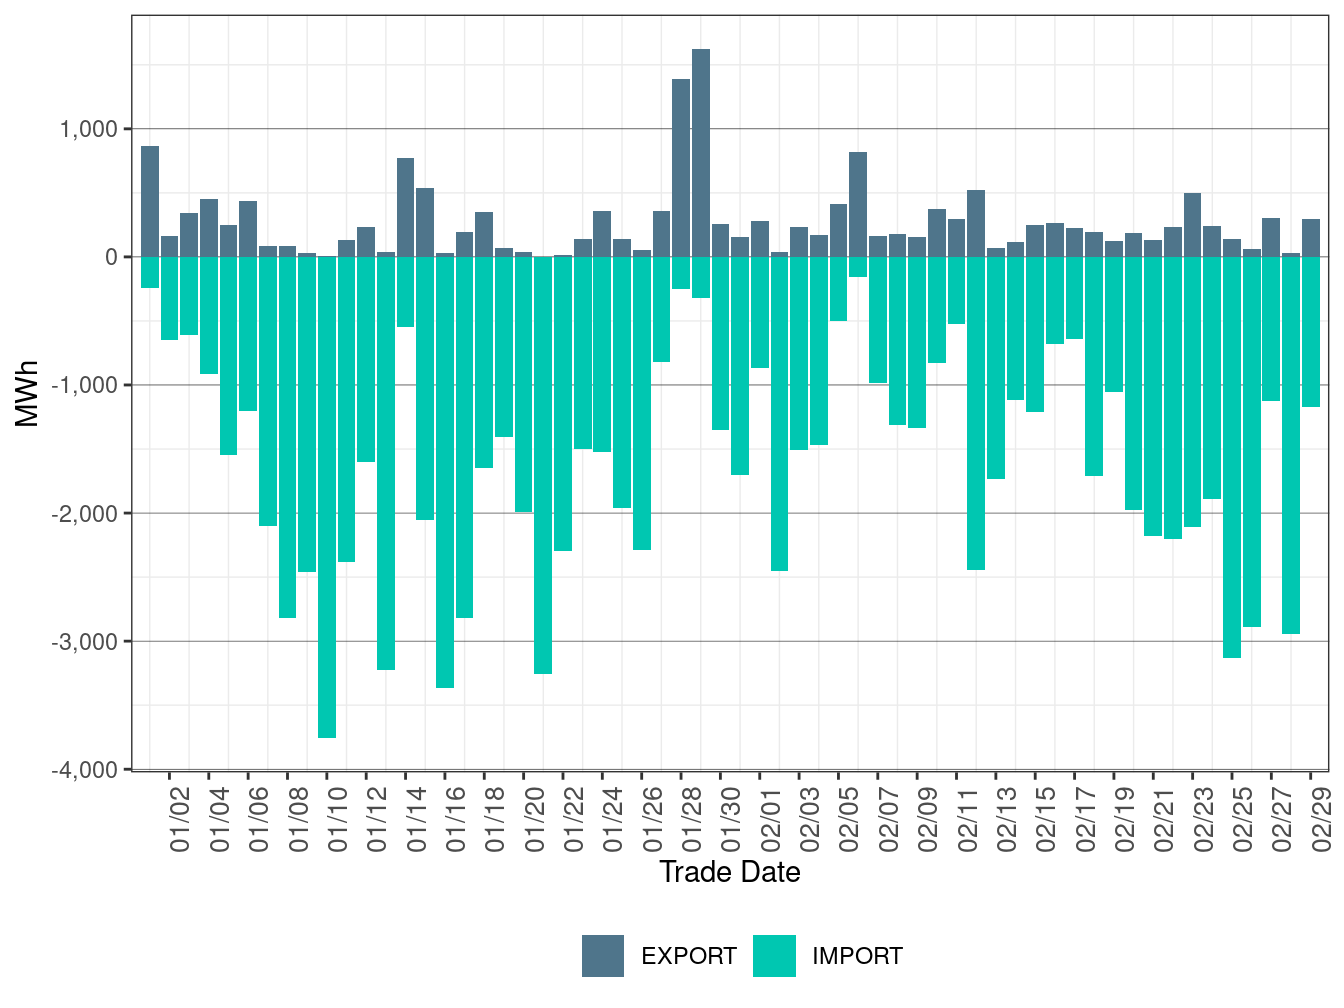
Figure 46: WEIM Transfers for AVRN in FMM
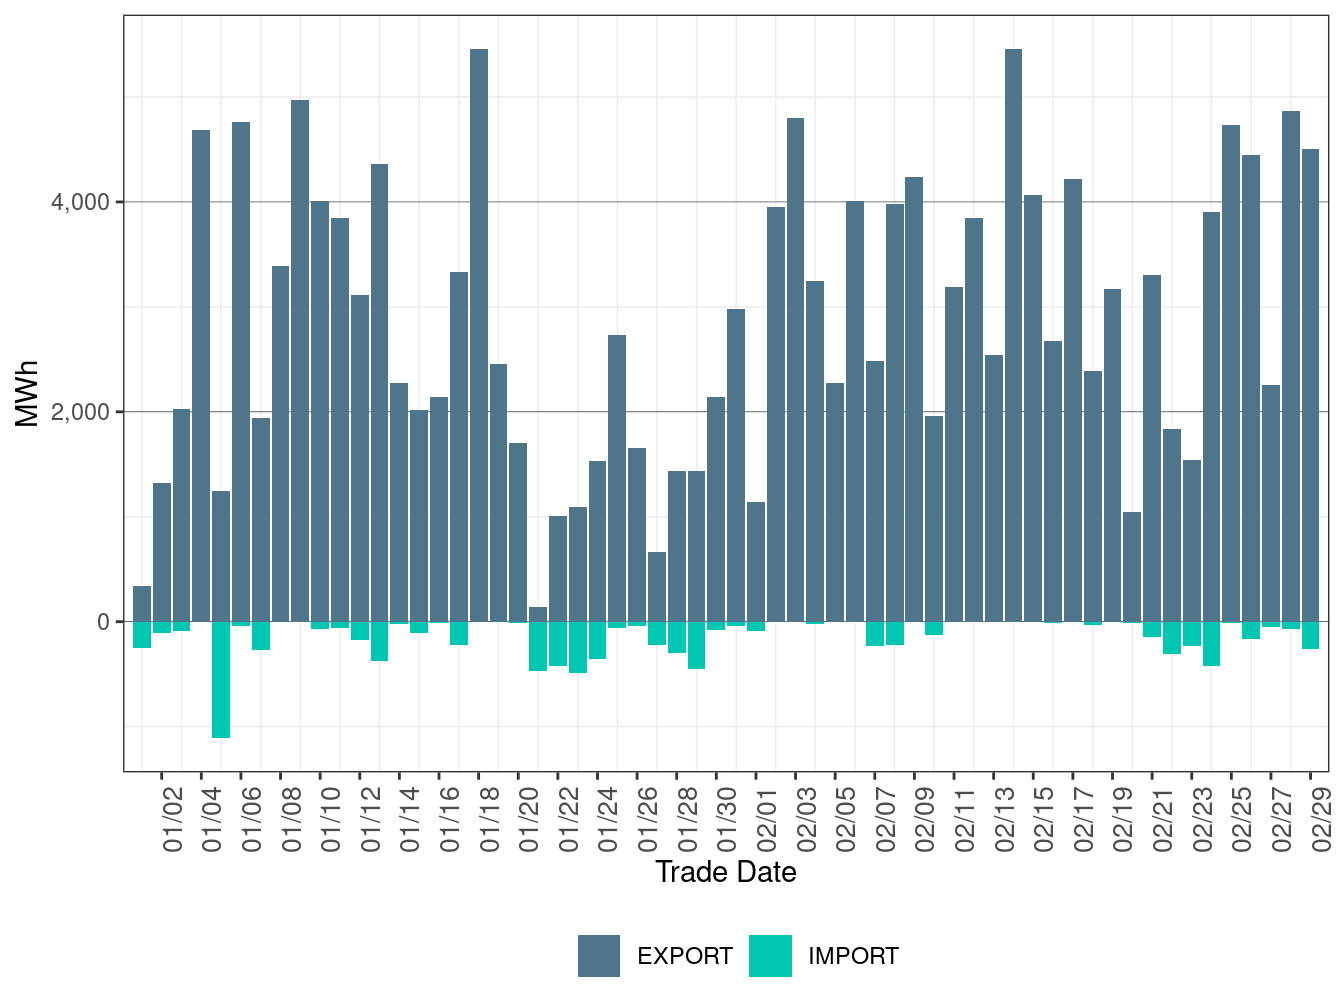
Figure 47: WEIM Transfers for AZPS in FMM
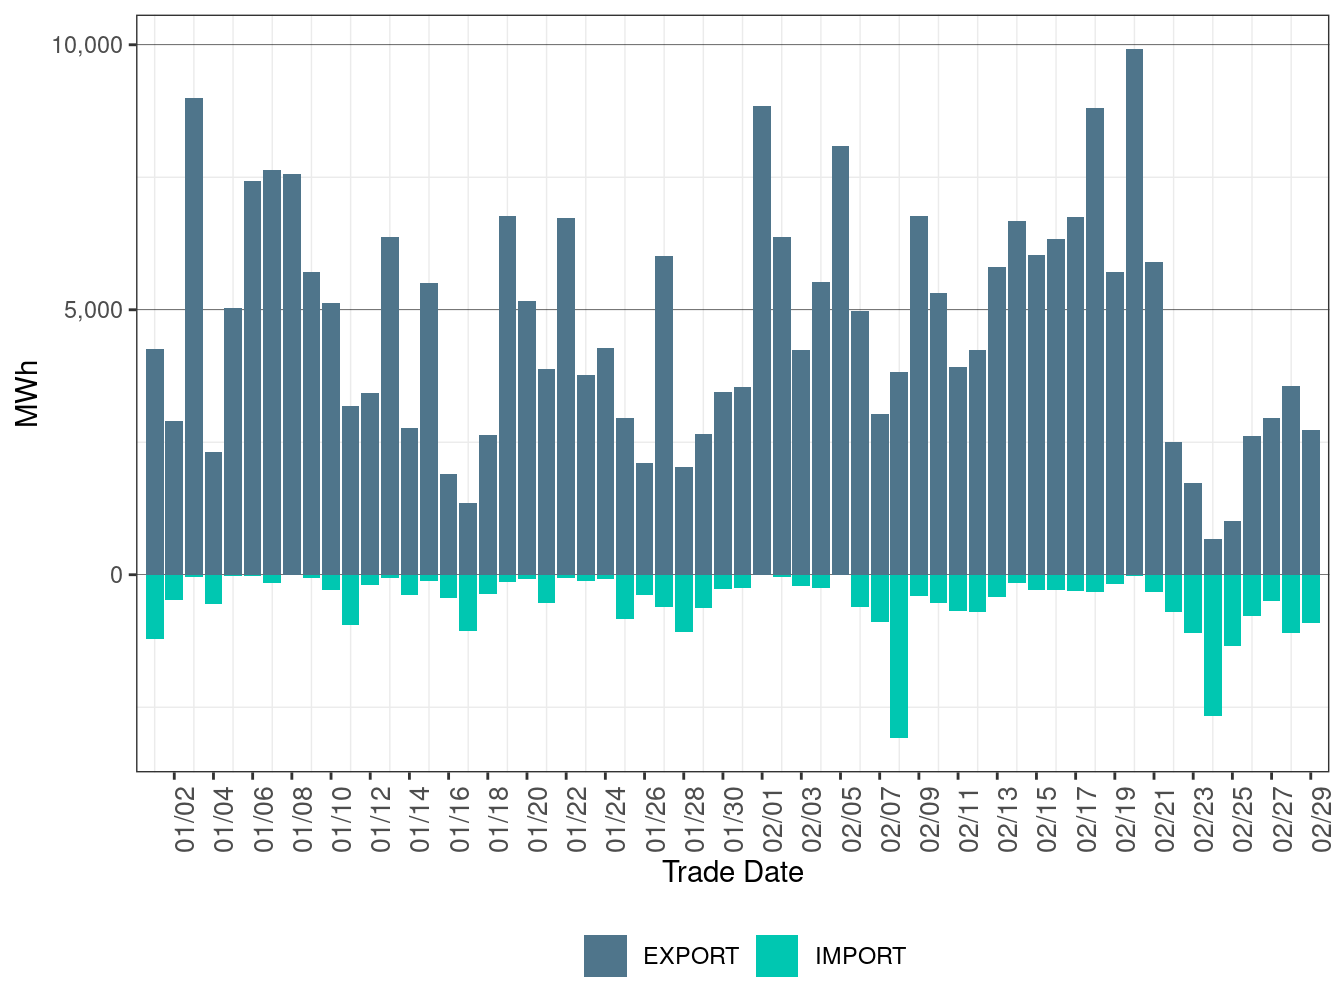
Figure 48: WEIM Transfers for BANC in FMM
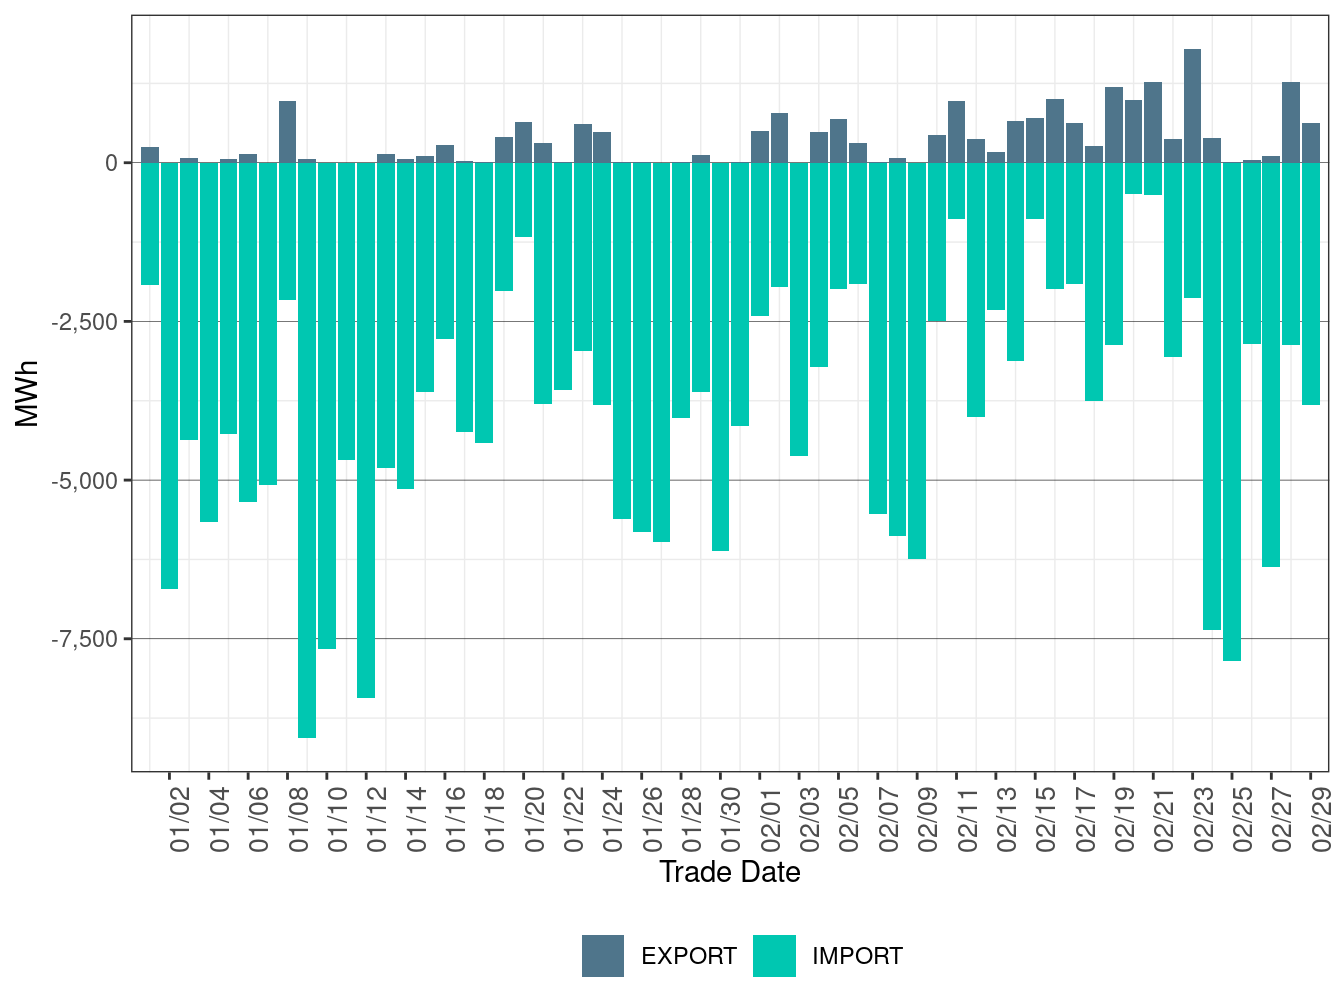
Figure 49: WEIM Transfers for BCHA in FMM
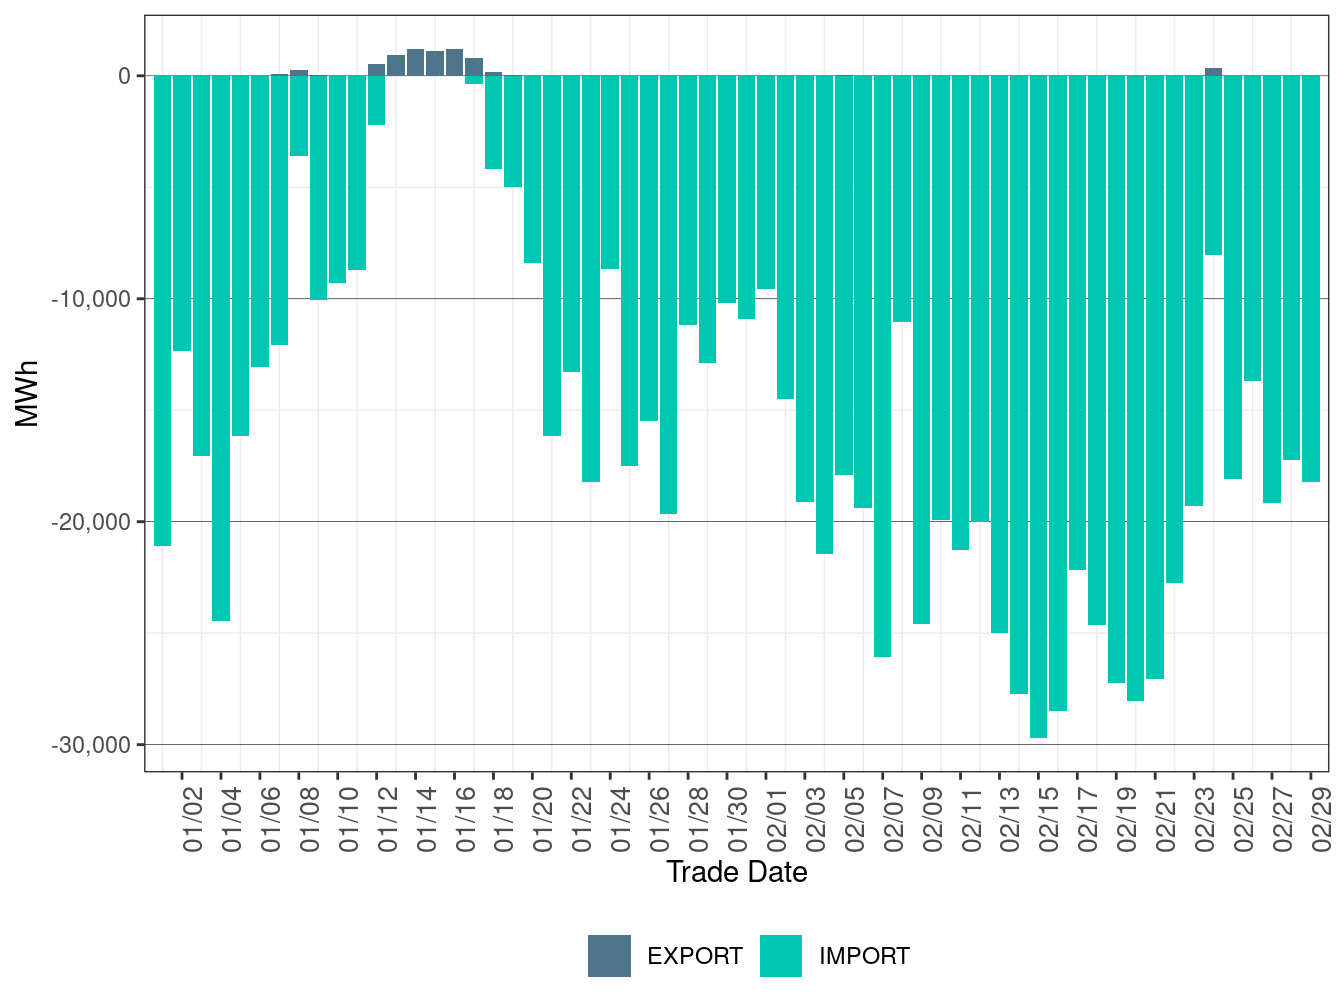
Figure 50: WEIM Transfers for BPAT in FMM
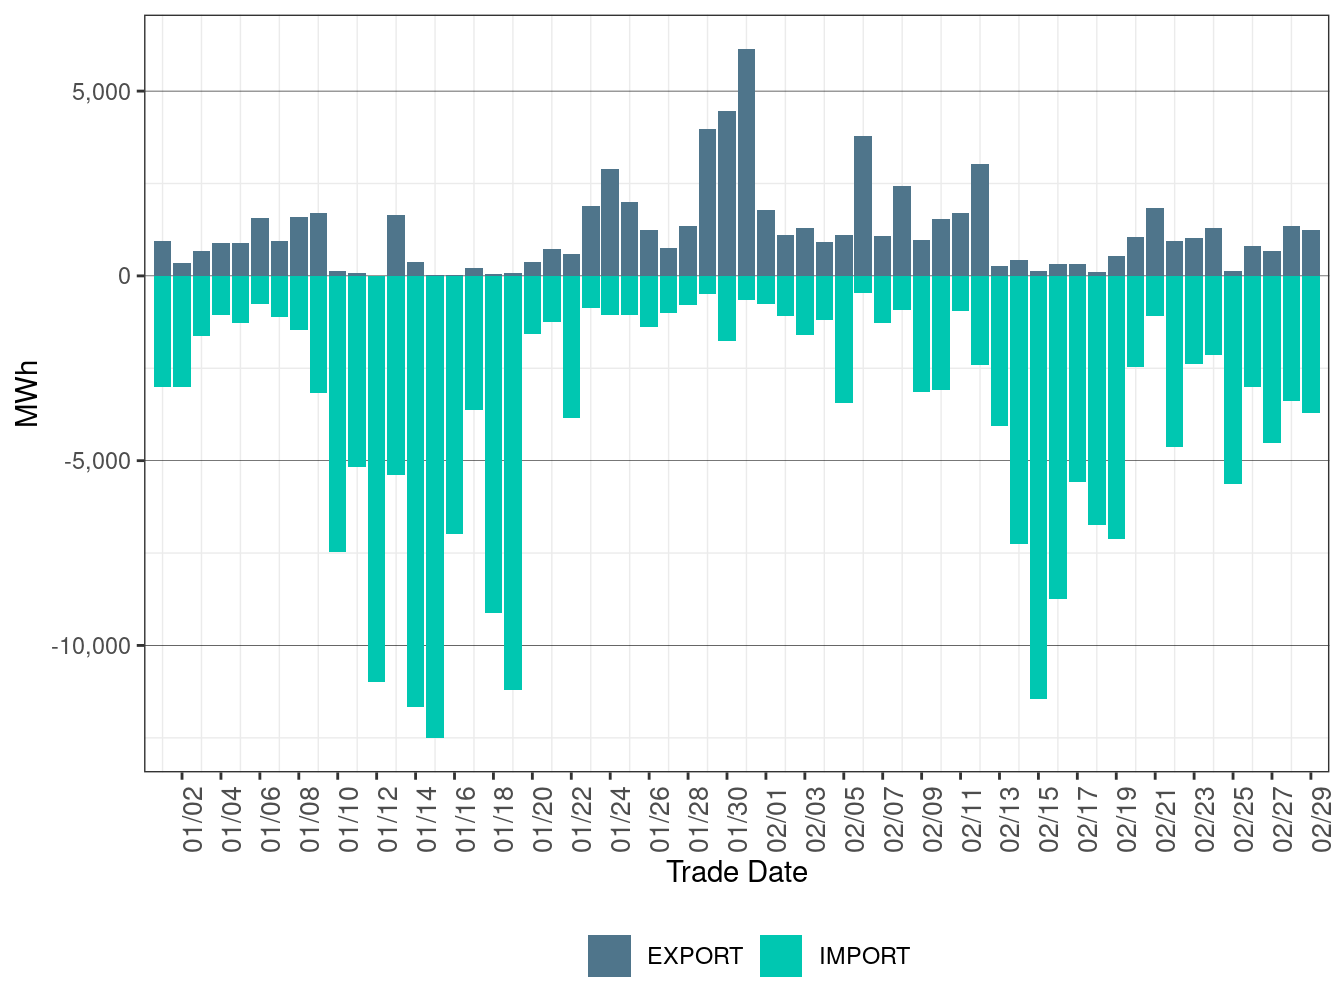
Figure 51: WEIM Transfers for EPE in FMM
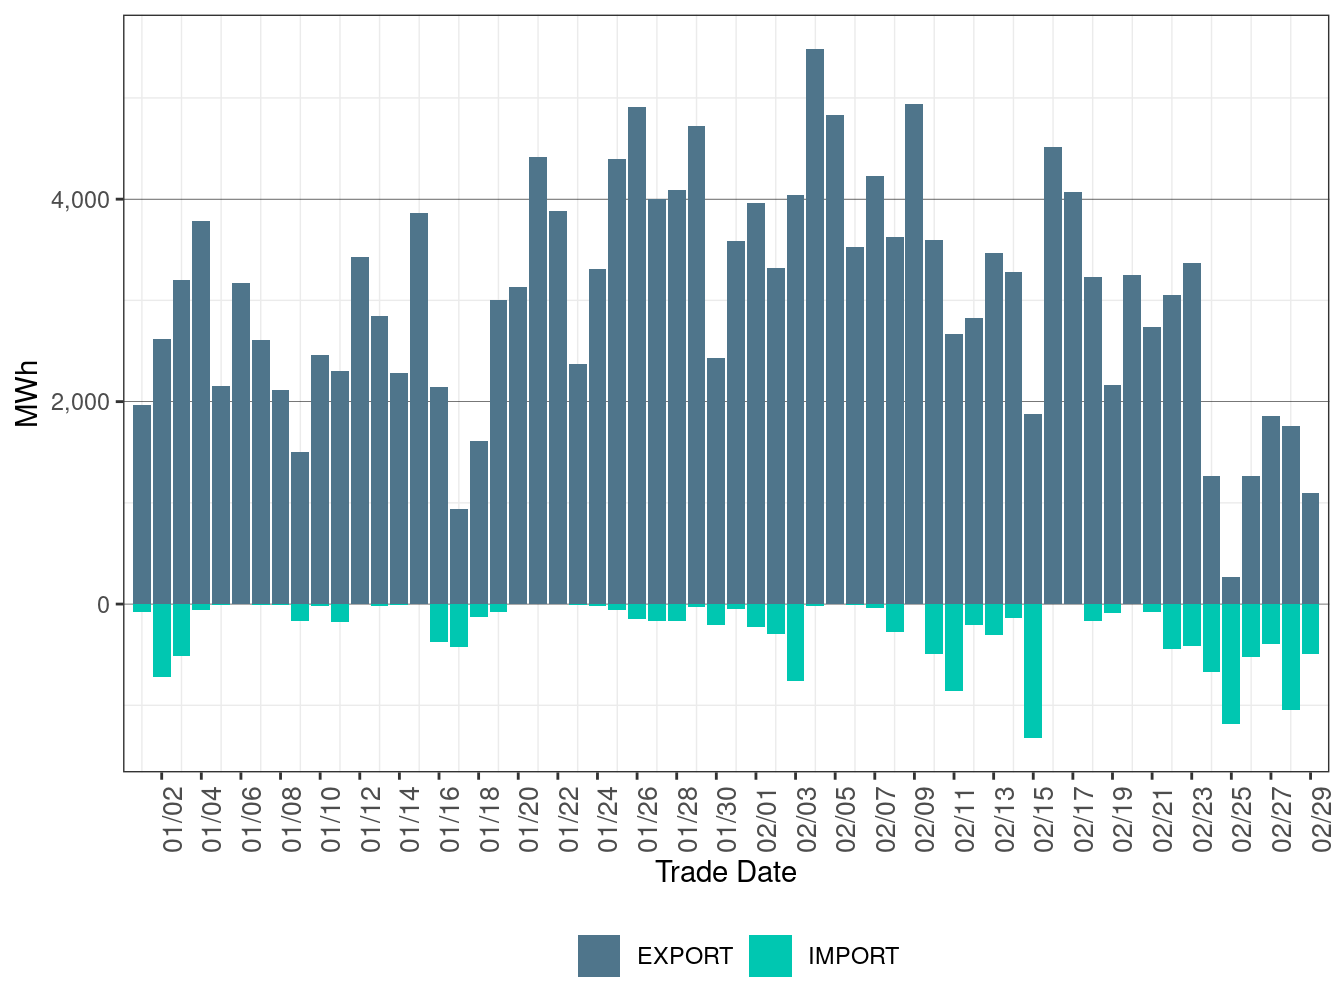
Figure 52: WEIM Transfers for IPCO in FMM
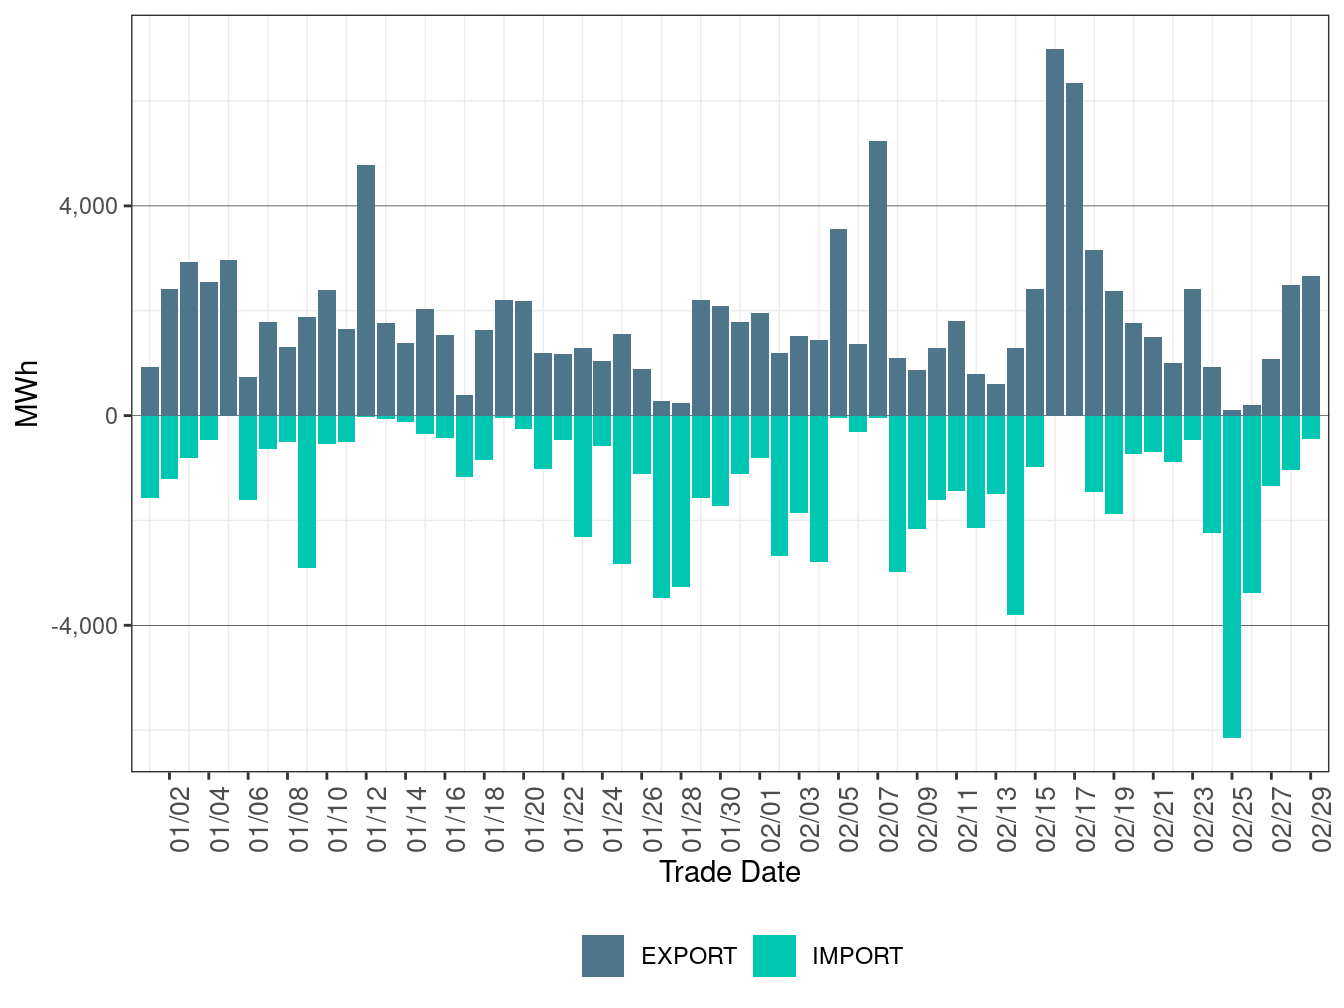
Figure 53: WEIM Transfers for LADWP in FMM
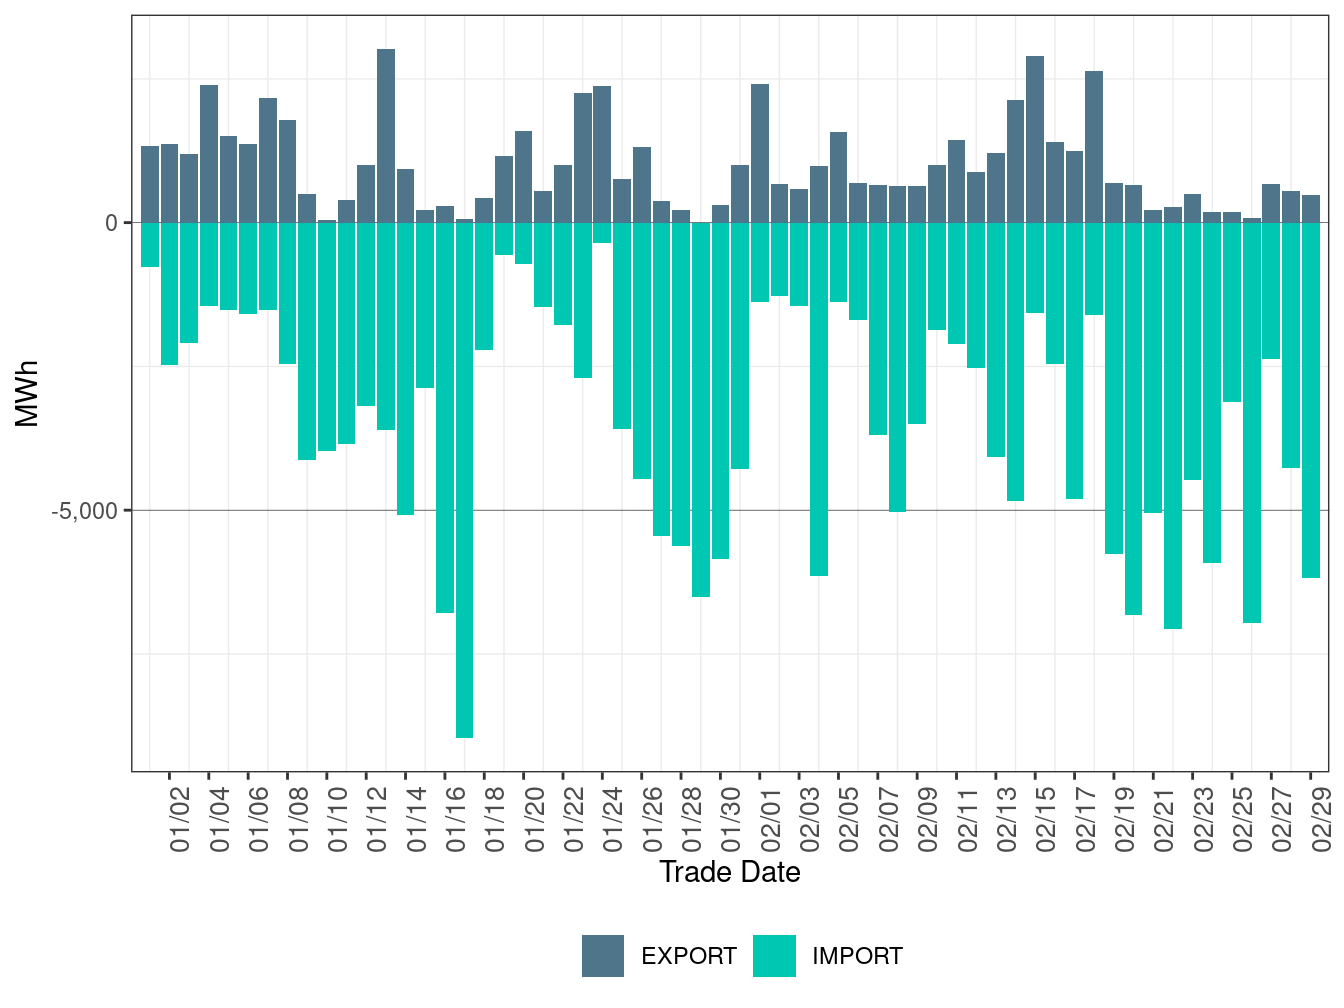
Figure 54: WEIM Transfers for NEVP in FMM
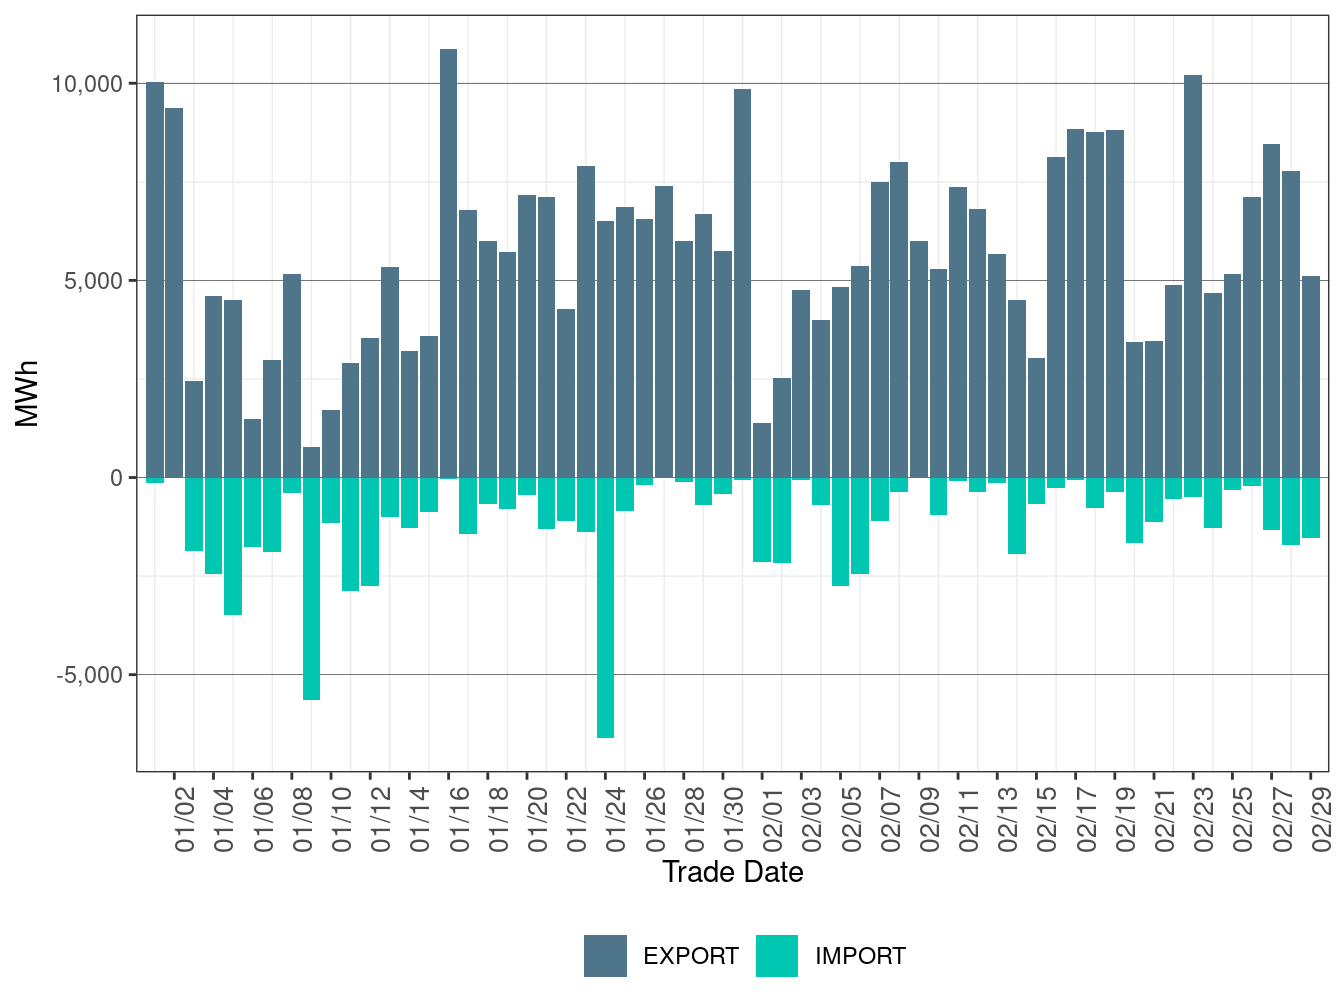
Figure 55: WEIM Transfers for NWMT in FMM
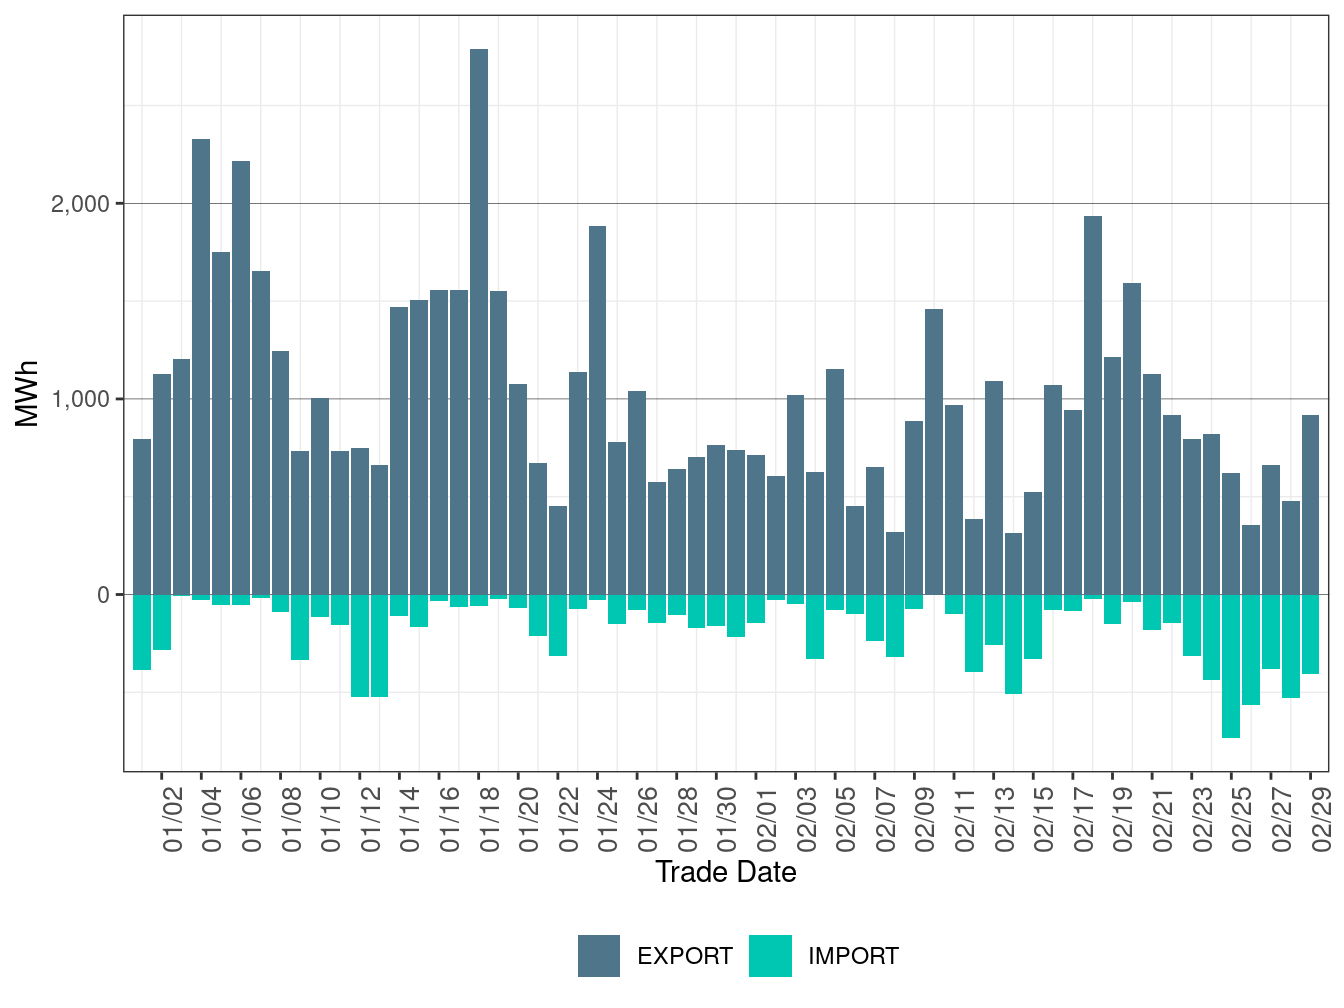
Figure 56: WEIM Transfers for PACE in FMM
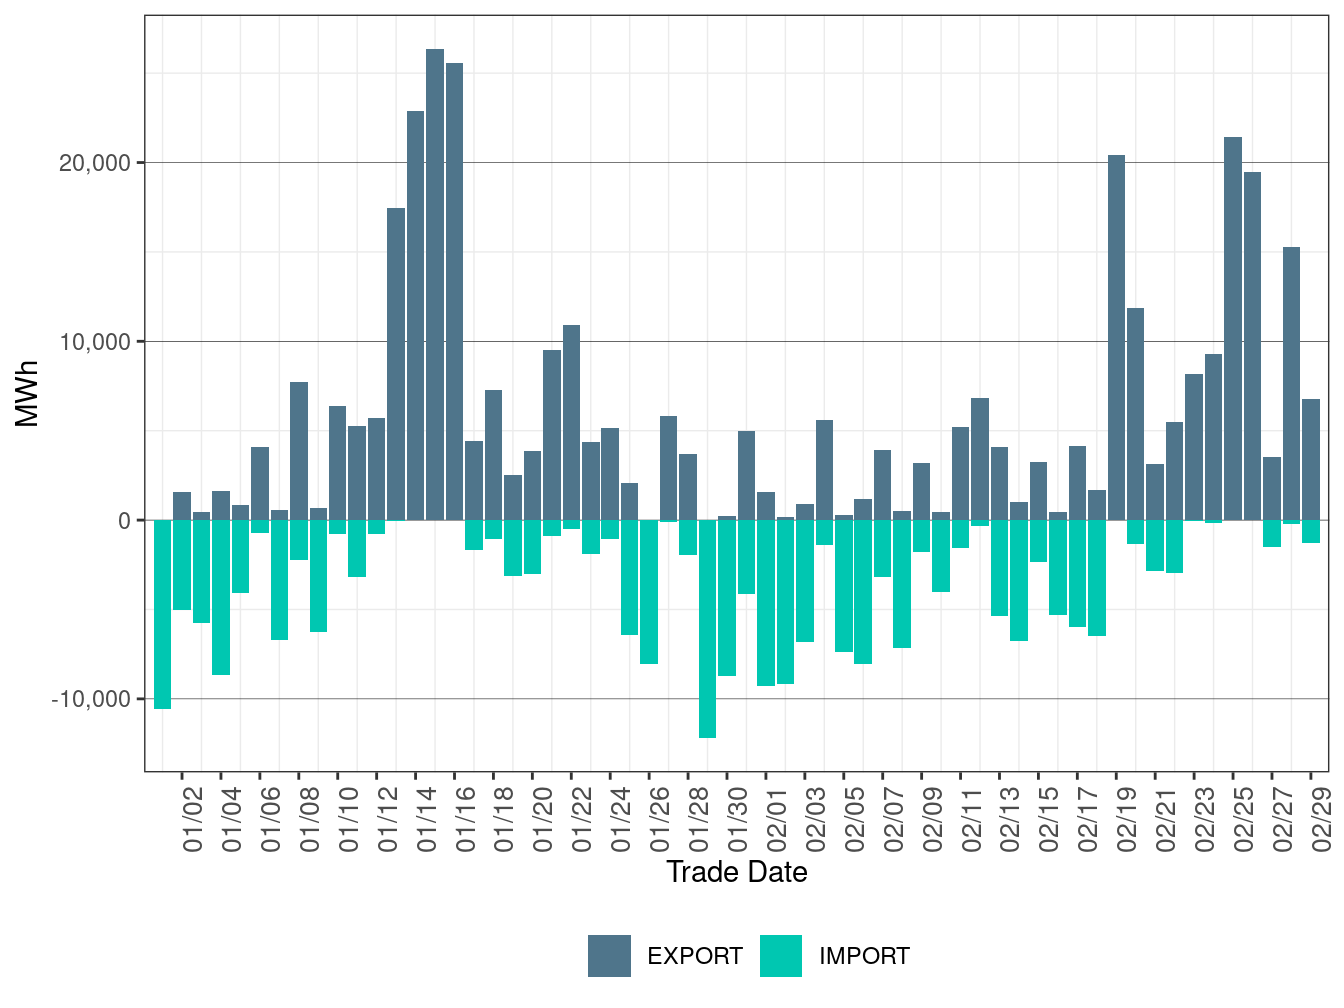
Figure 57: WEIM Transfers for PACW in FMM
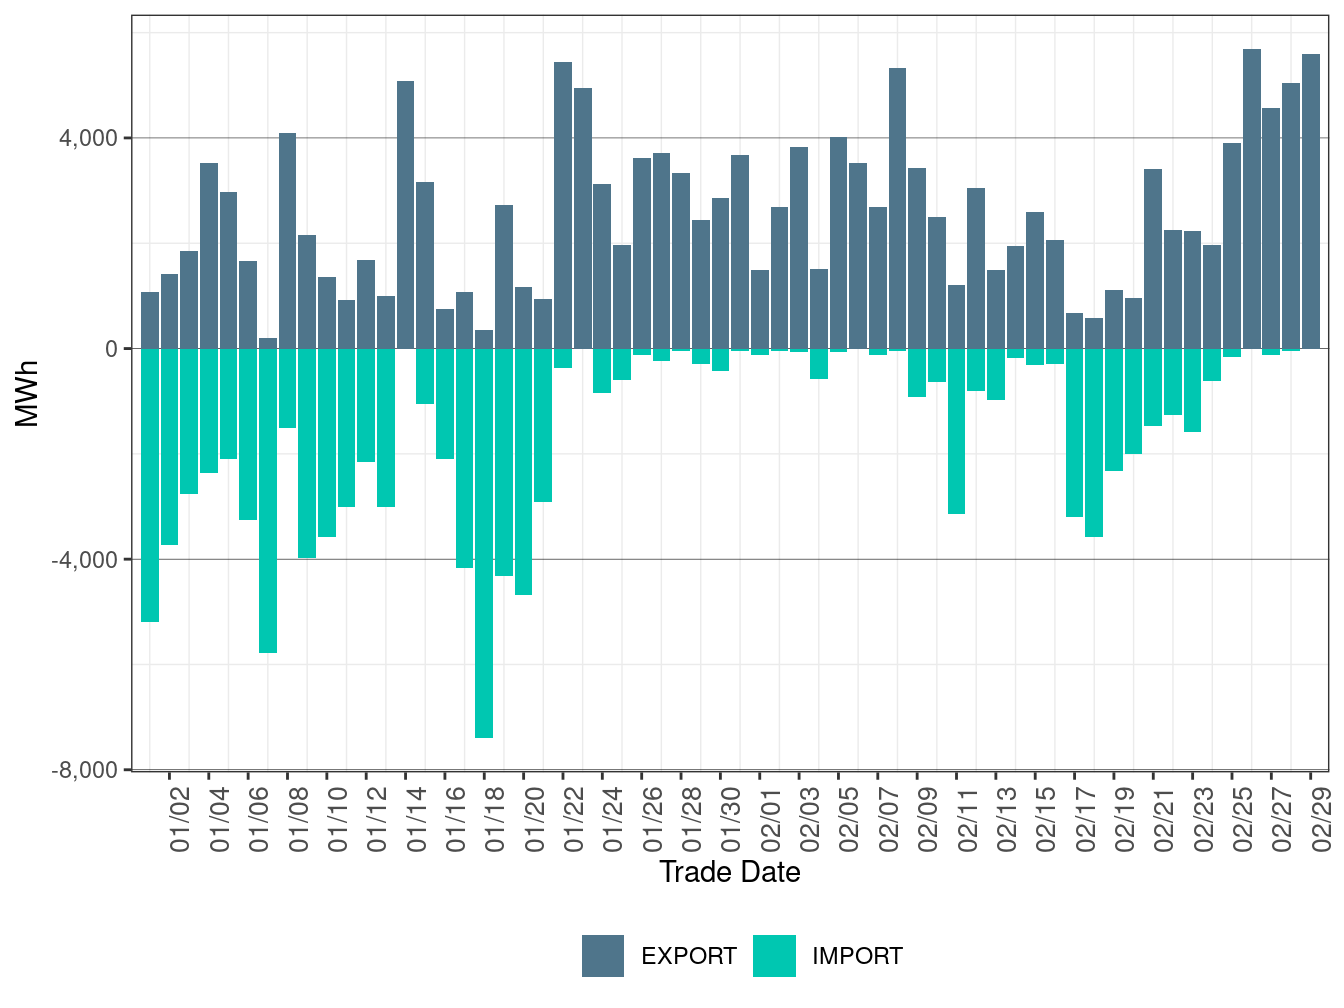
Figure 58: WEIM Transfers for PGE in FMM
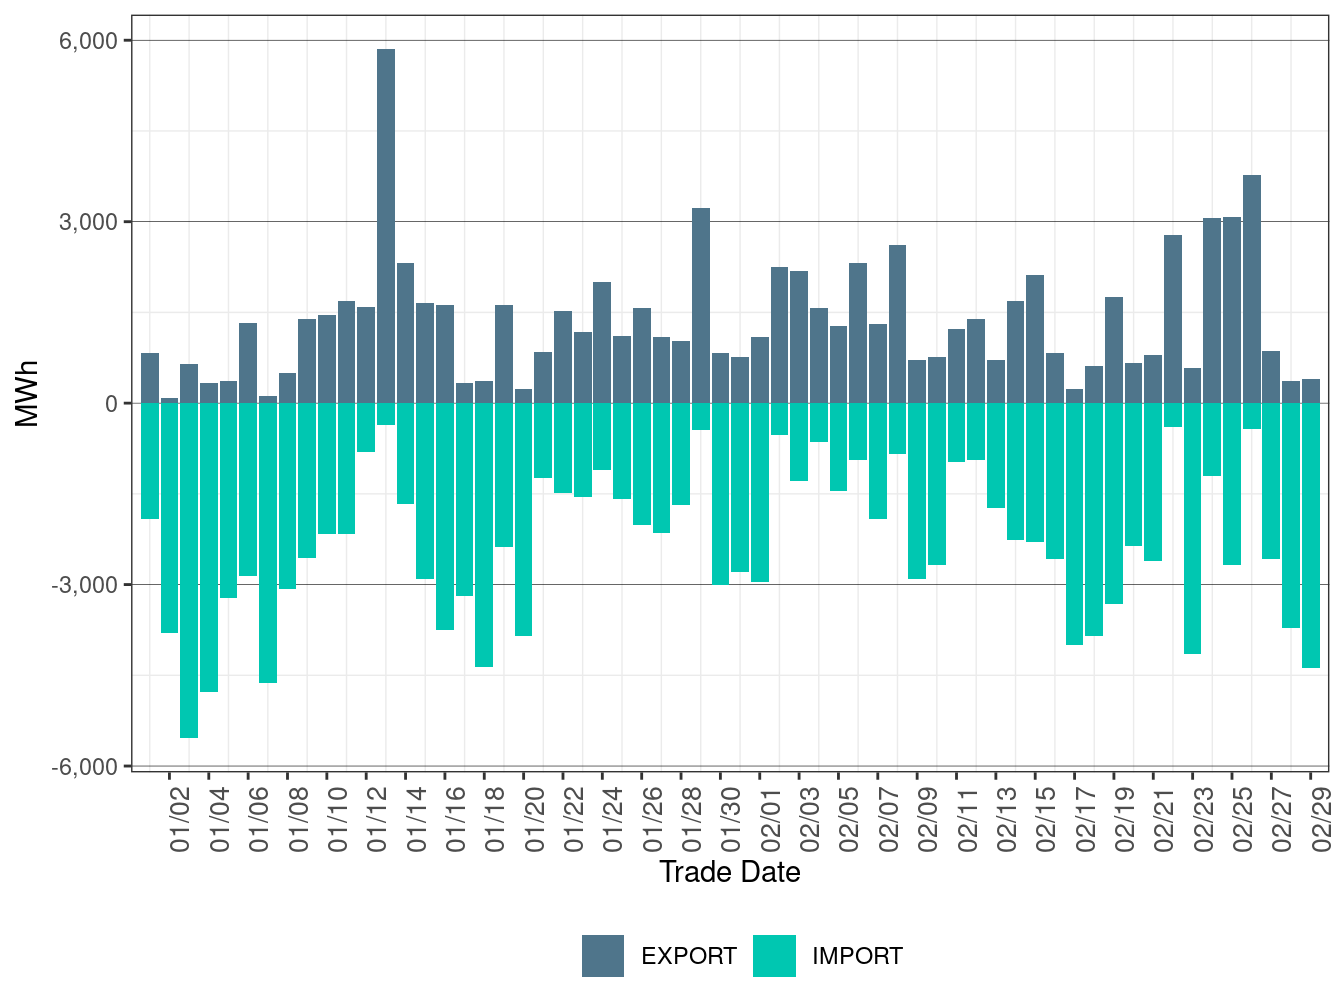
Figure 59: WEIM Transfers for PNM in FMM
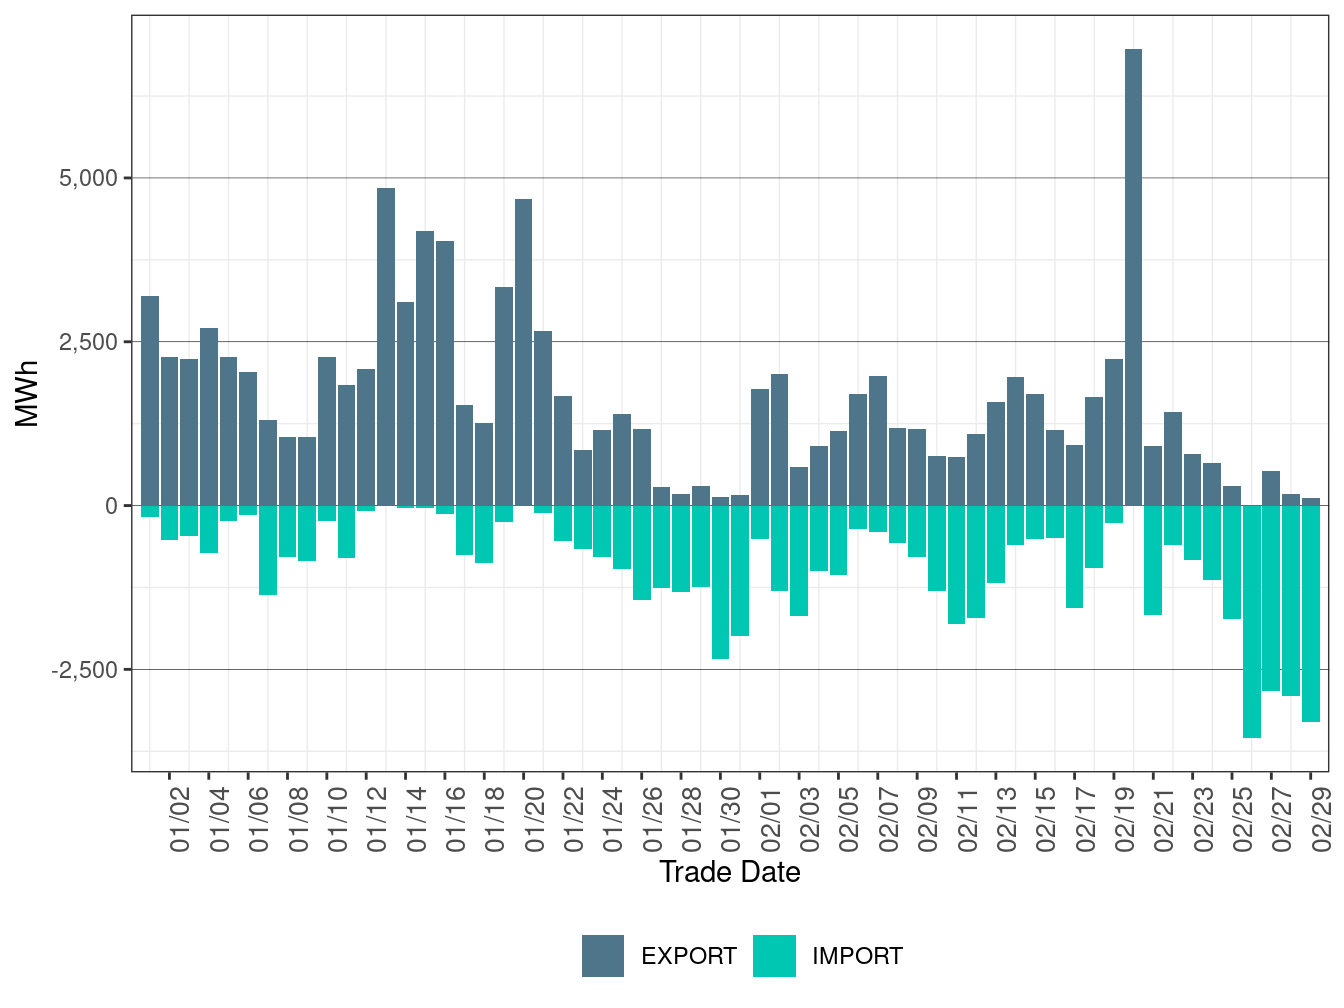
Figure 60: WEIM Transfers for PSEI in FMM
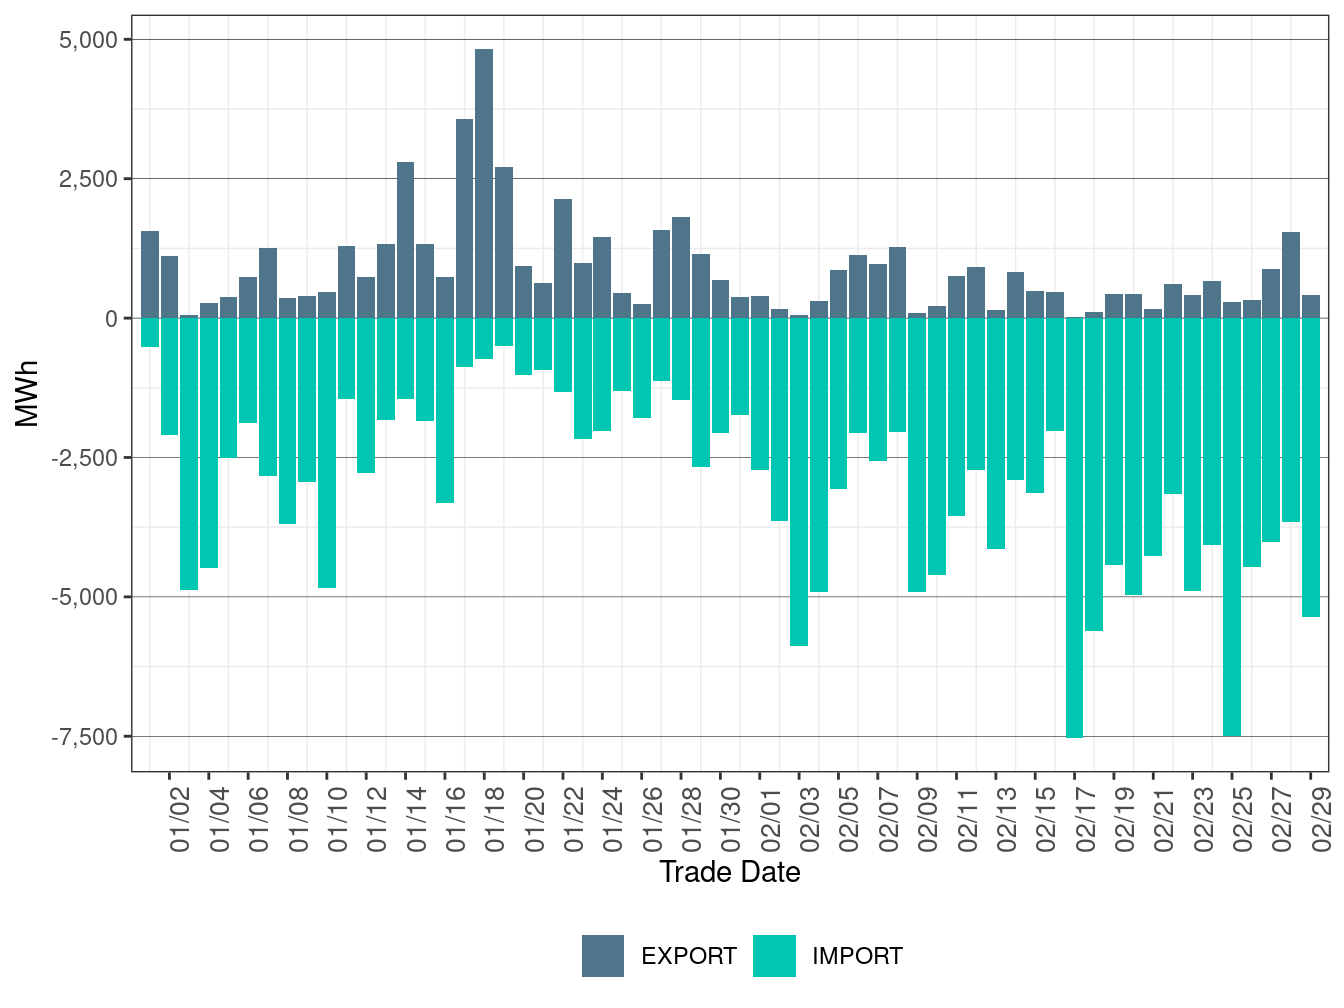
Figure 61: WEIM Transfers for SCL in FMM
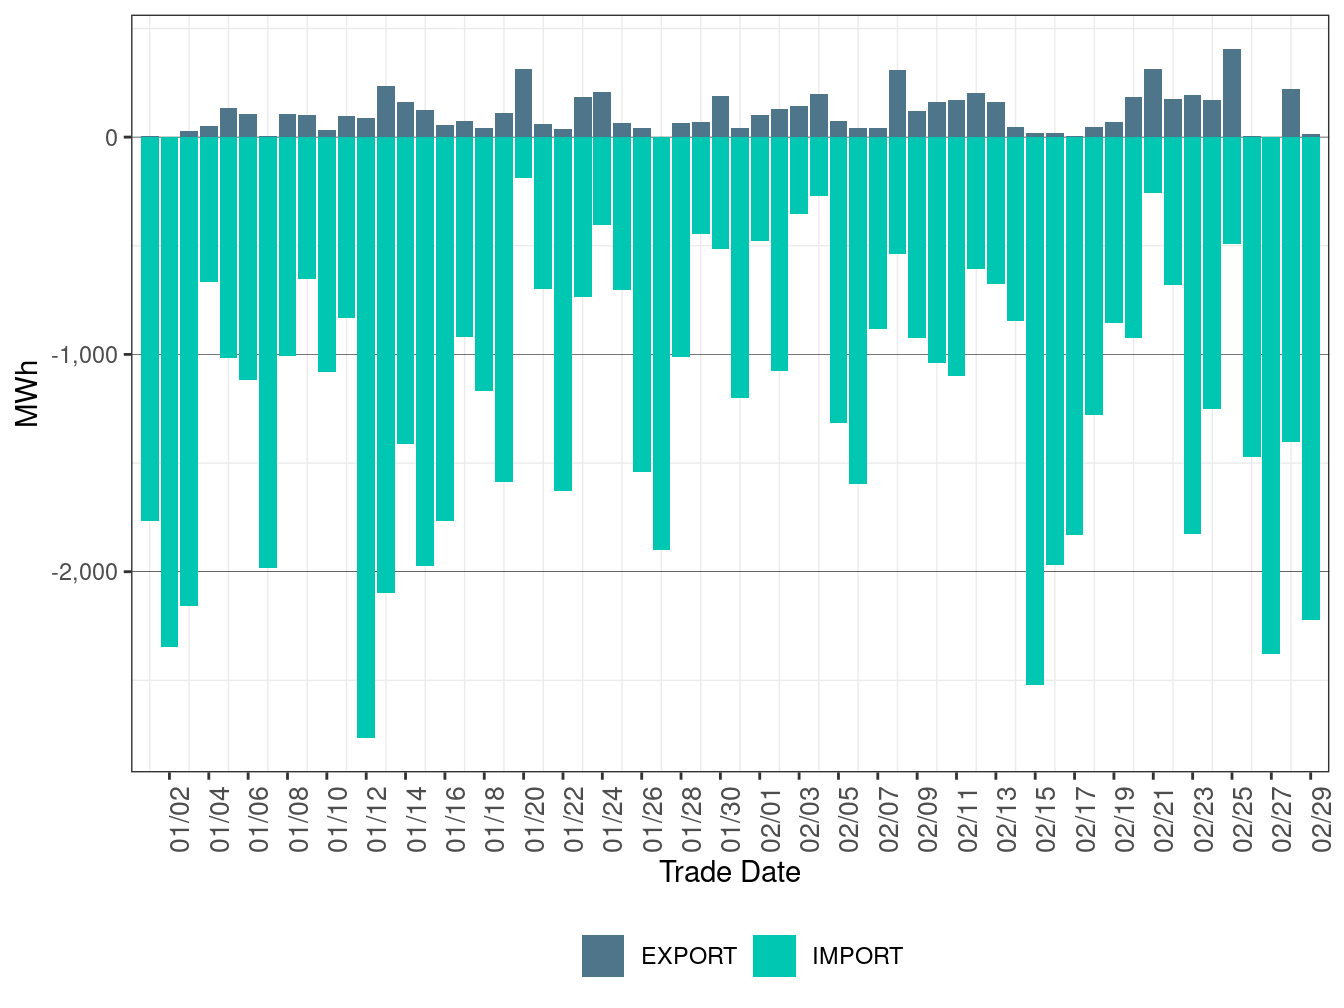
Figure 62: WEIM Transfers for SRP in FMM
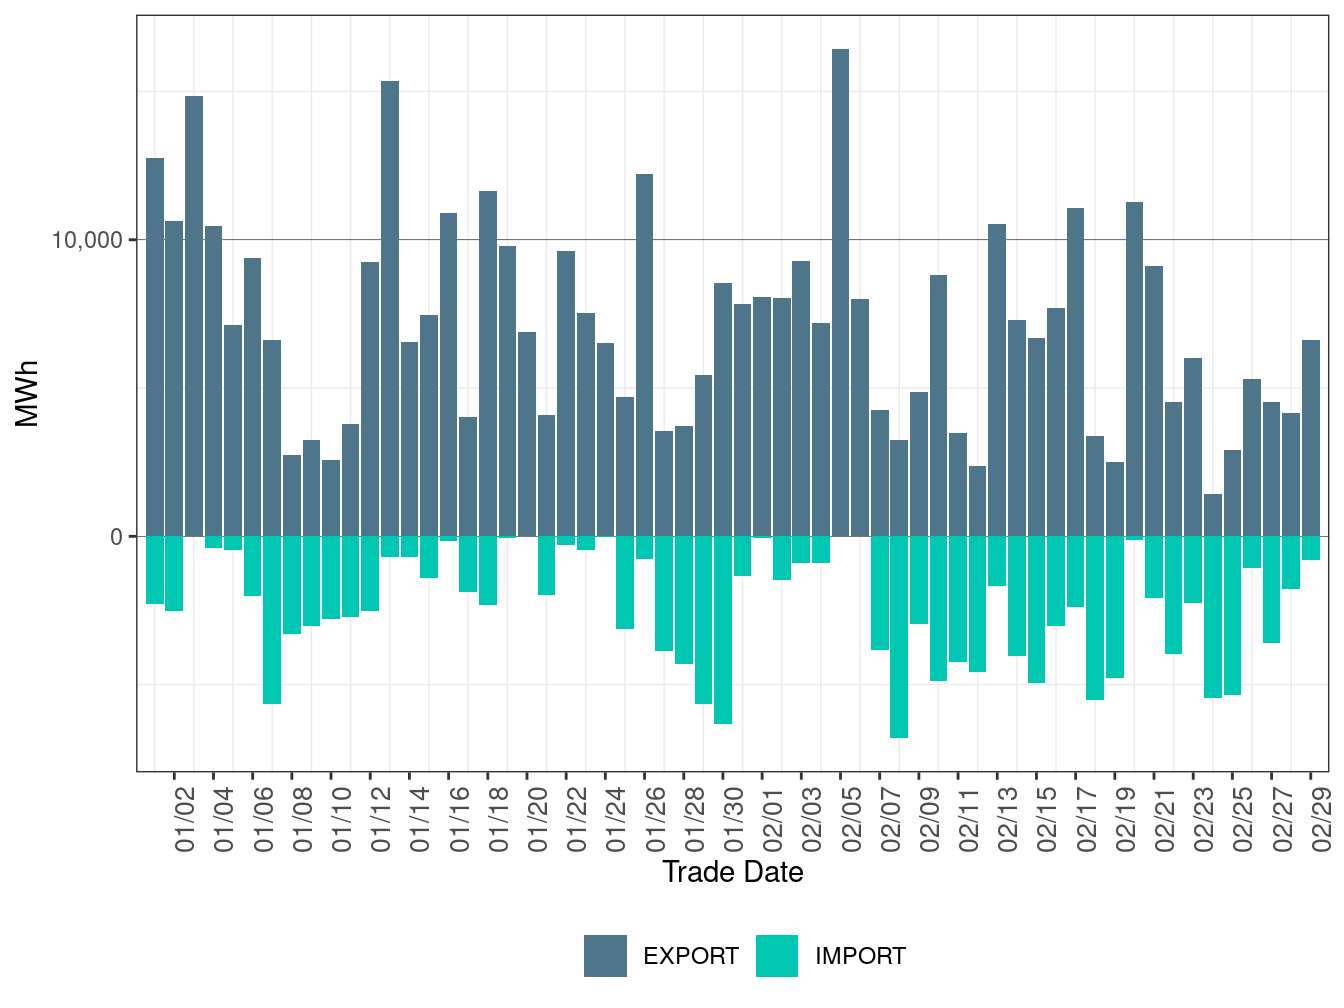
Figure 63: WEIM Transfers for TEPC in FMM
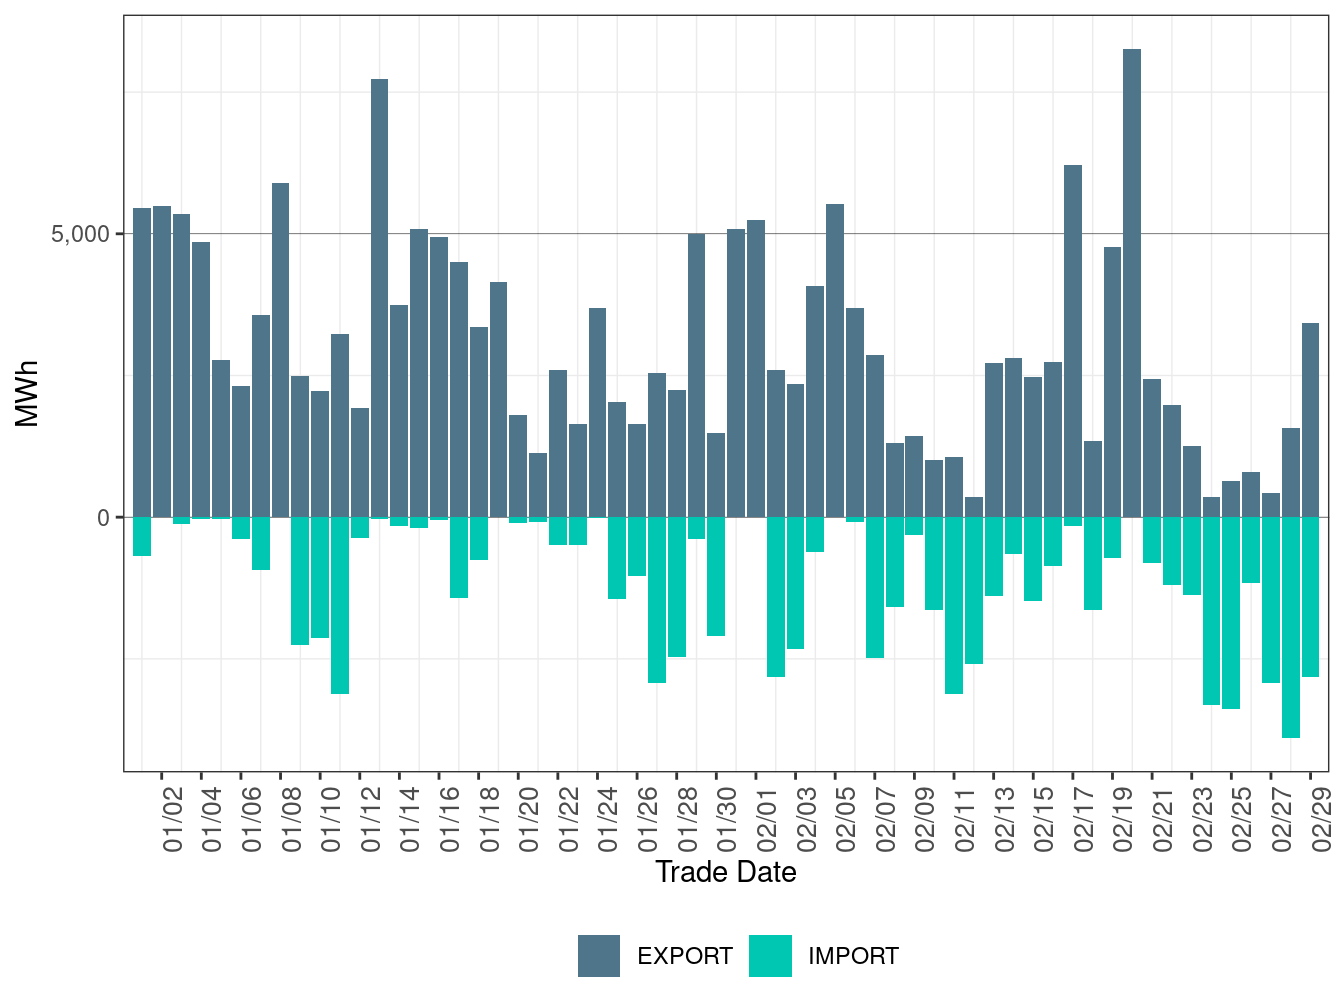
Figure 64: WEIM Transfers for TIDC in FMM
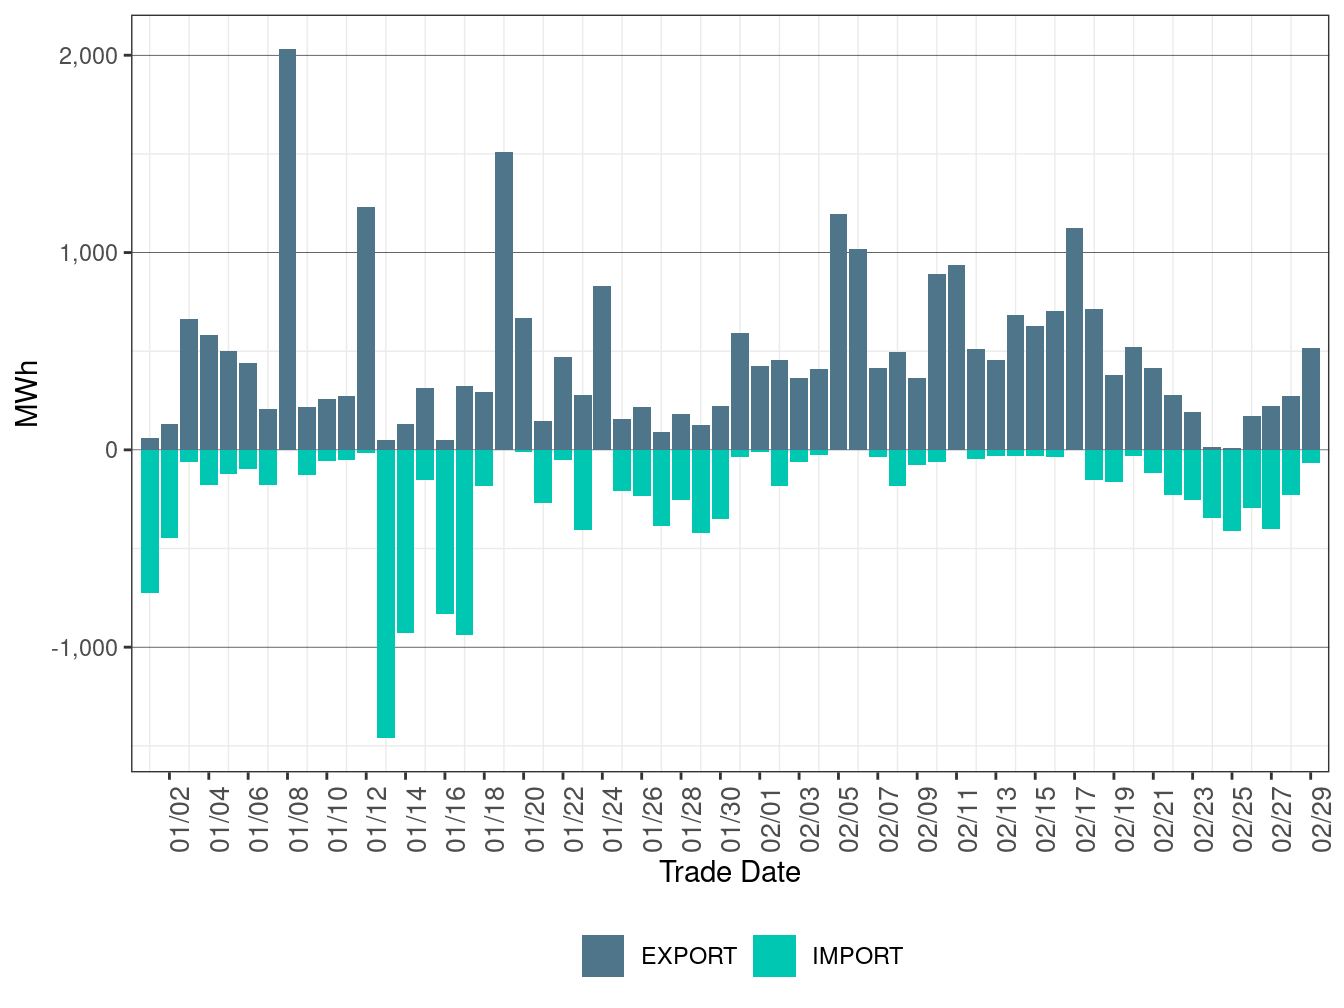
Figure 65: WEIM Transfers for TPWR in FMM
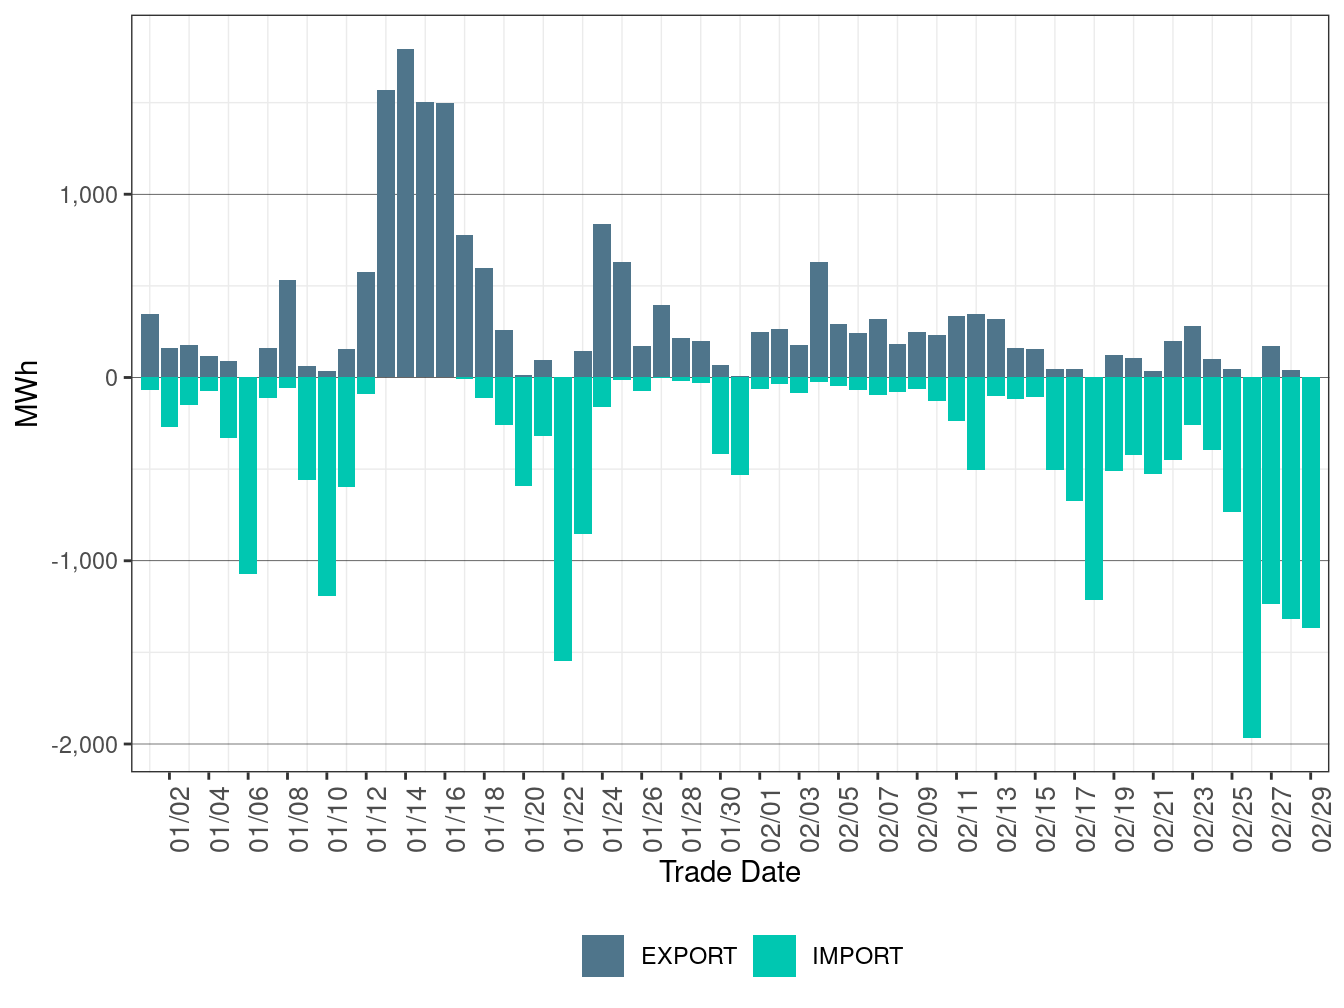
Figure 66: WEIM Transfers for WALC in FMM
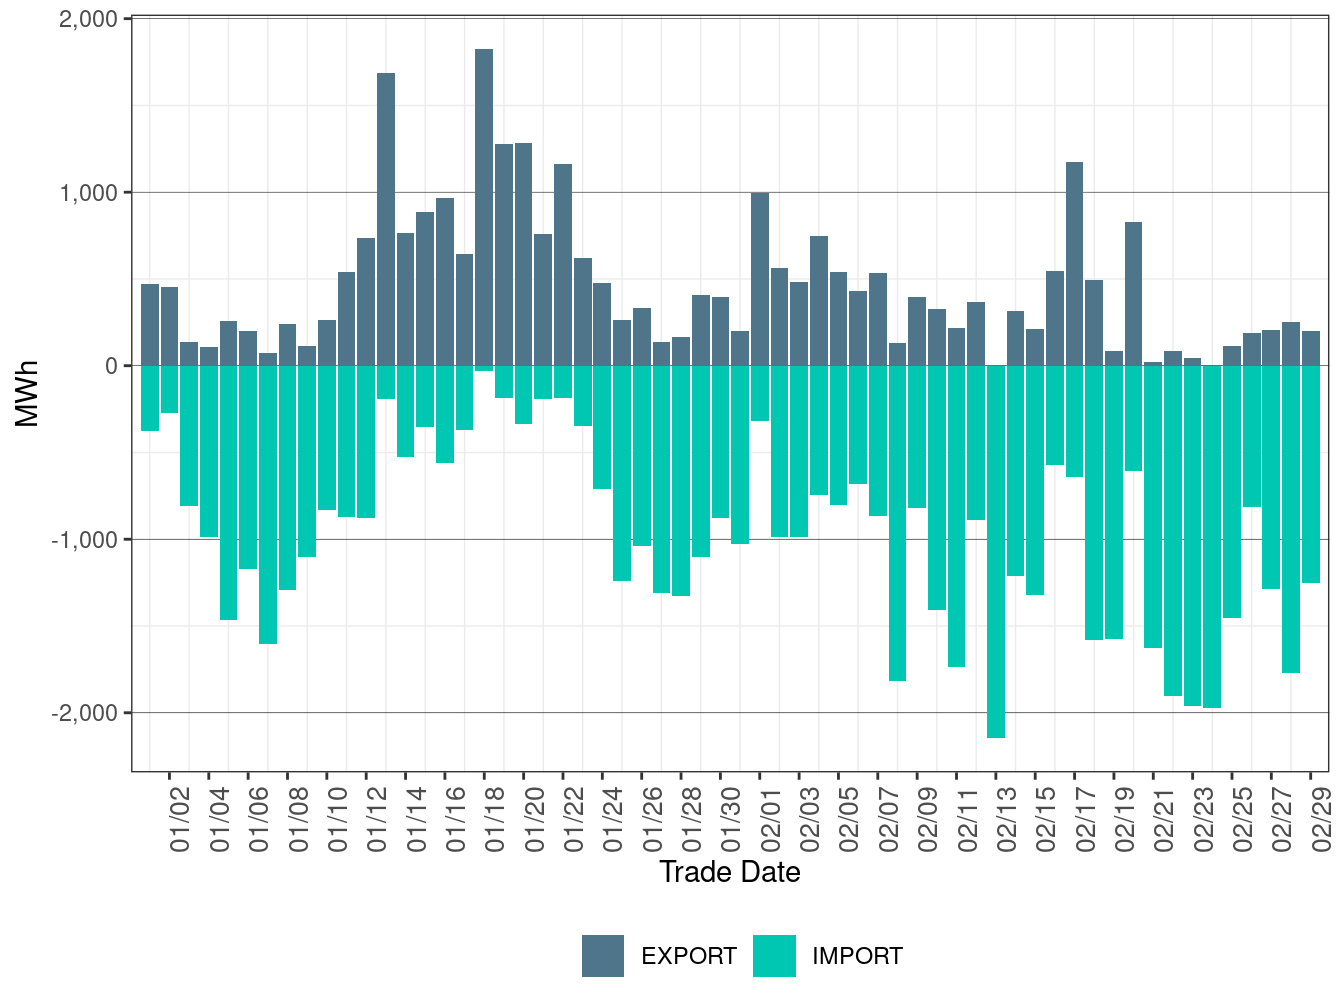
Figures 67 to 89 show the daily volume of WEIM transfers optimized in RTD for each of the BAAs participating in the WEIM. IMPORT represents the total WEIM transfers from other BAAs. EXPORT represents the total WEIM transfers out to other BAAs.
Figure 67: WEIM Transfers for CAISO in RTD
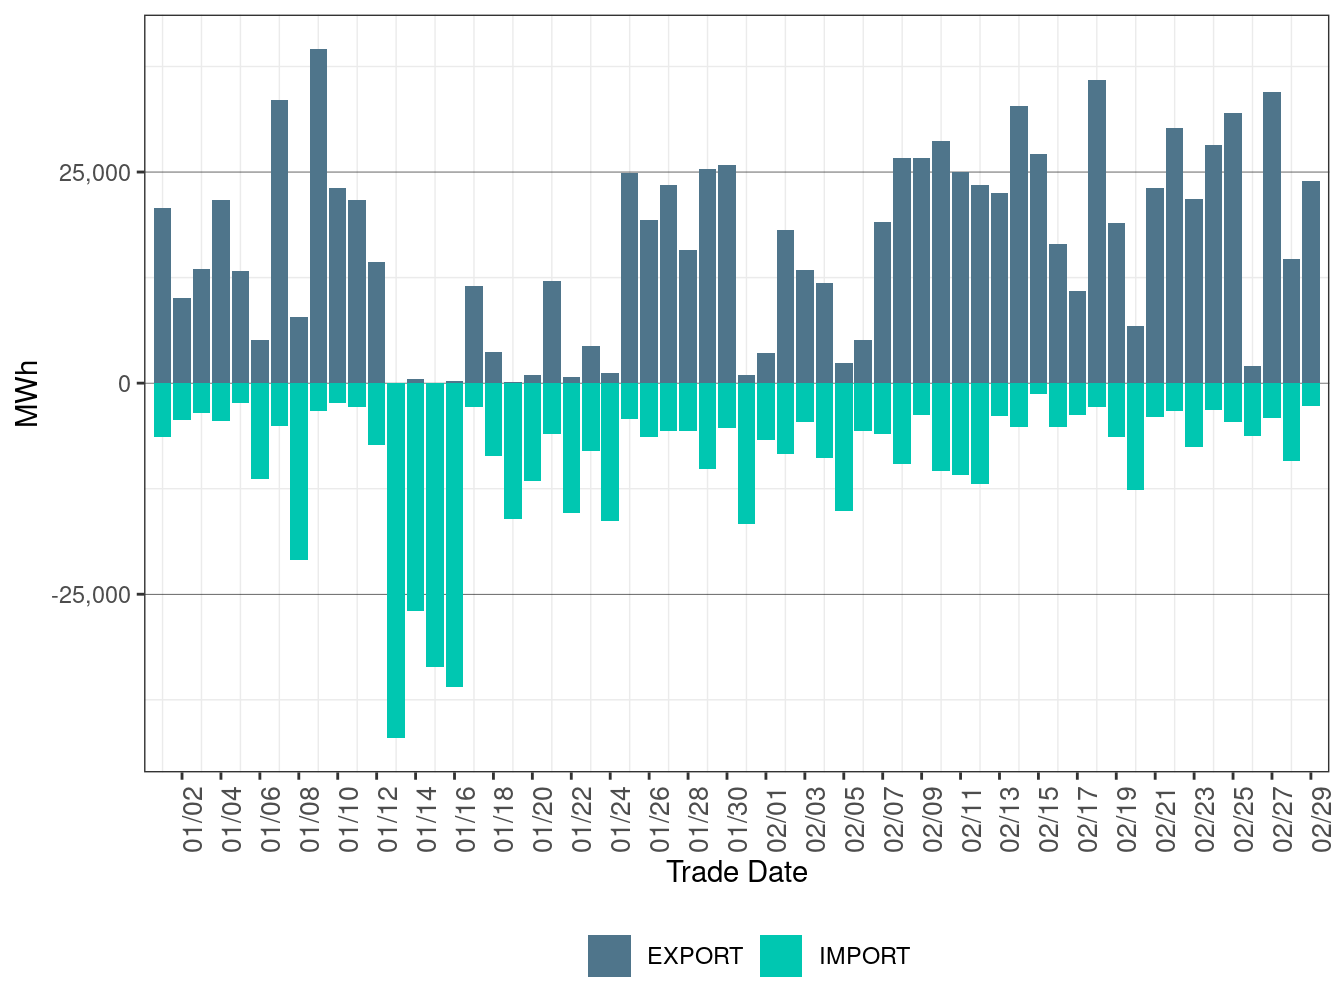
Figure 68: WEIM Transfers for AVA in RTD
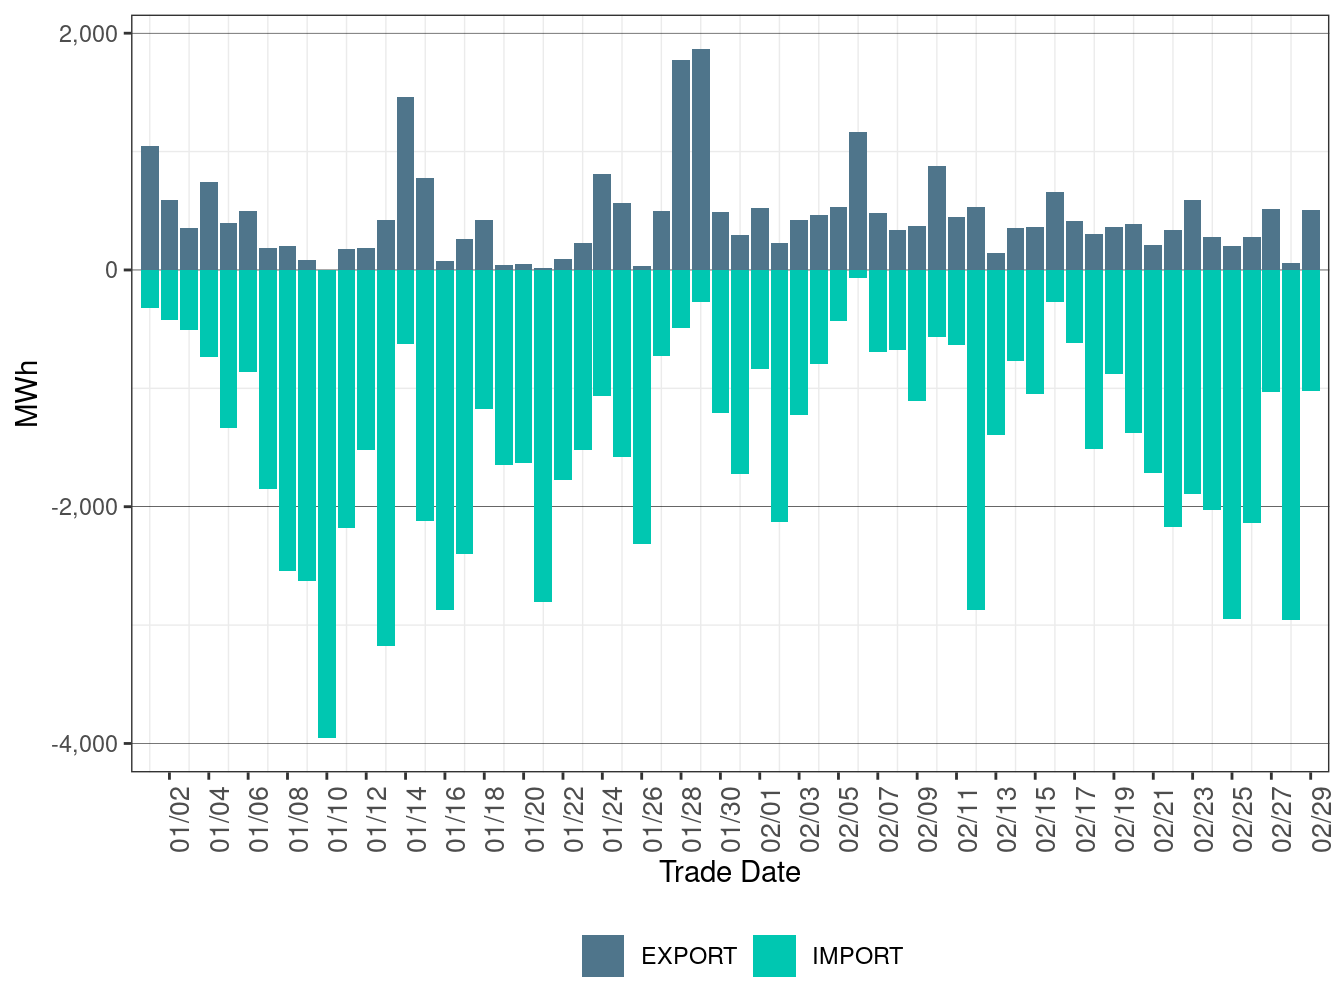
Figure 69: WEIM Transfers for AVRN in RTD
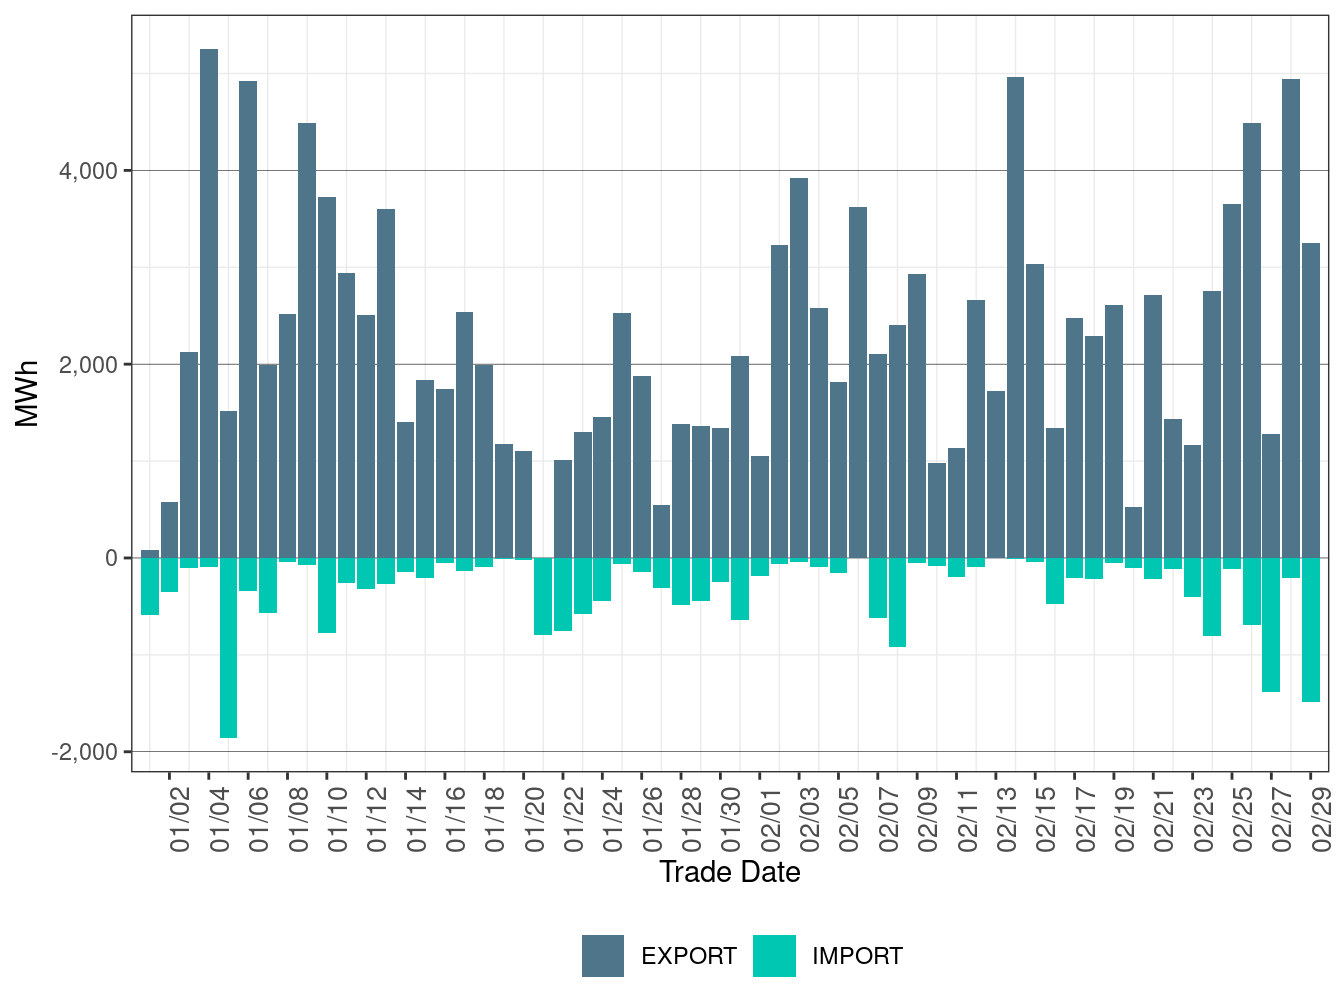
Figure 70: WEIM Transfers for AZPS in RTD
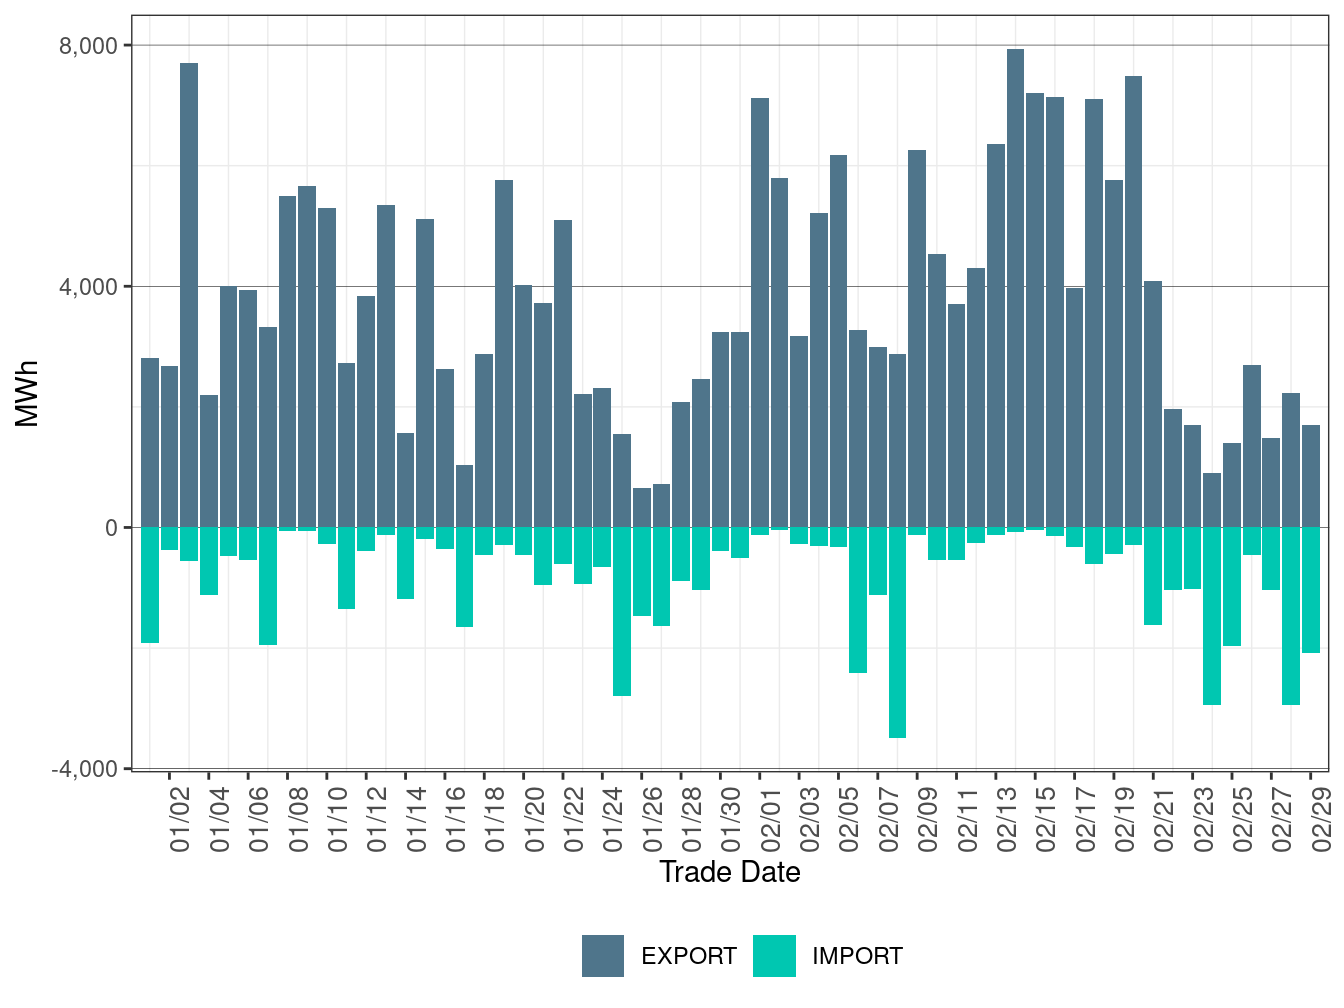
Figure 71: WEIM Transfers for BANC in RTD
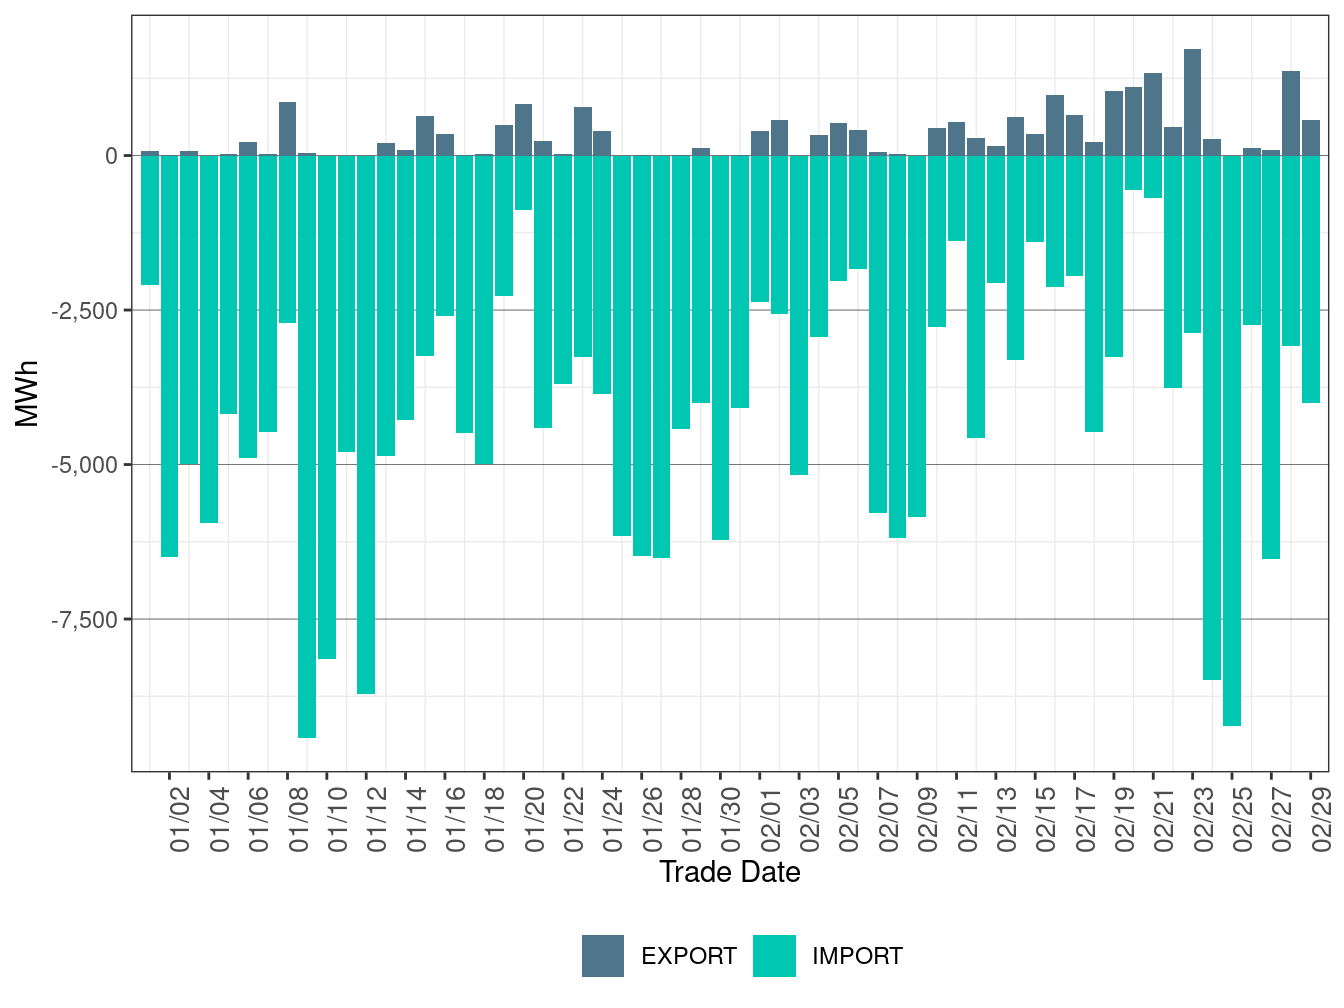
Figure 72: WEIM Transfers for BCHA in RTD
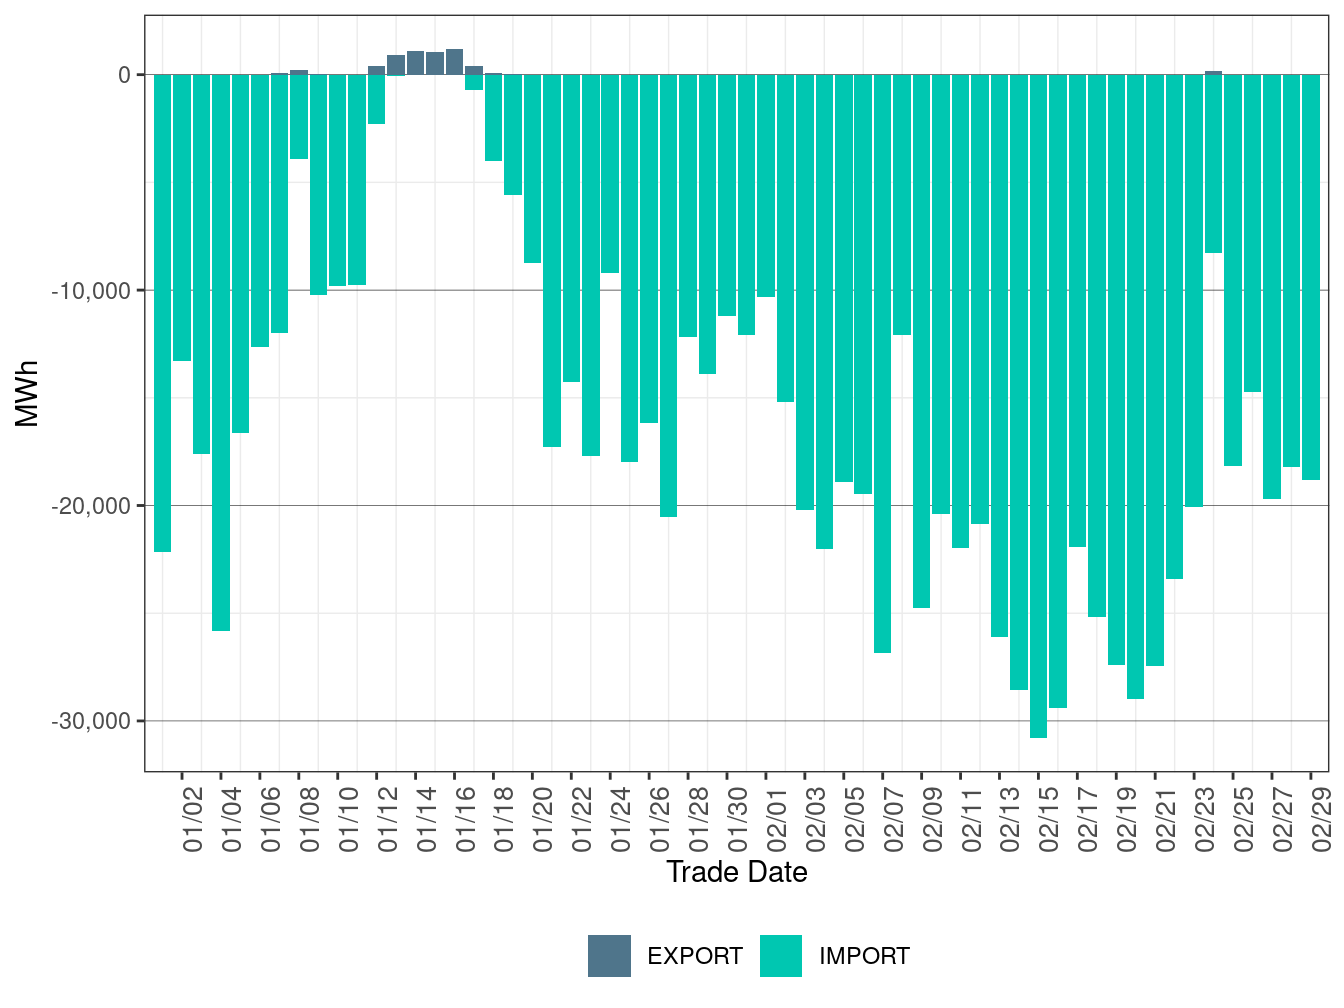
Figure 73: WEIM Transfers for BPAT in RTD
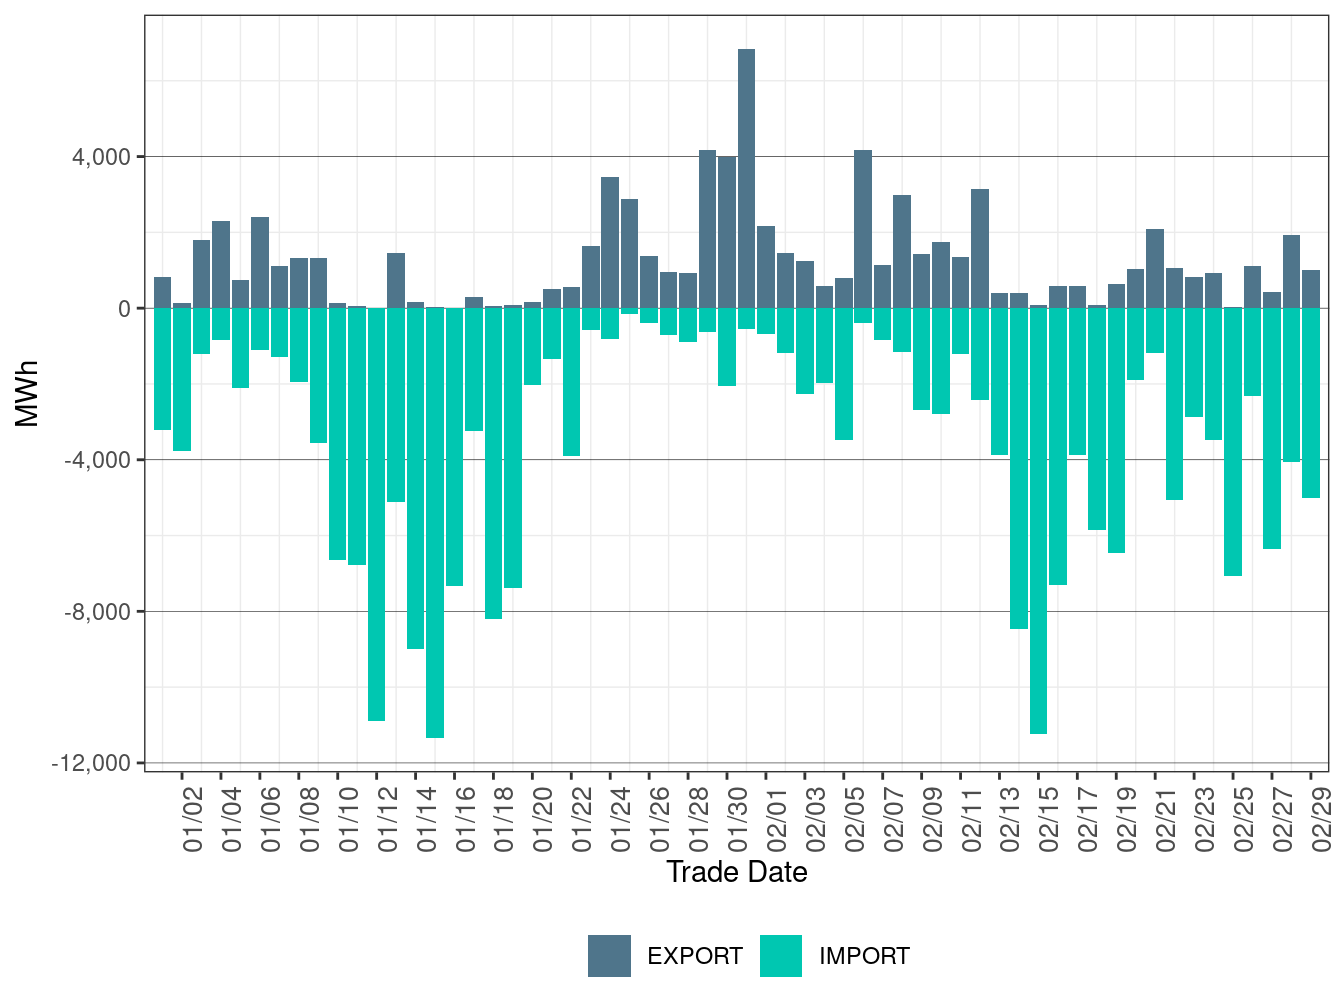
Figure 74: WEIM Transfers for EPE in RTD
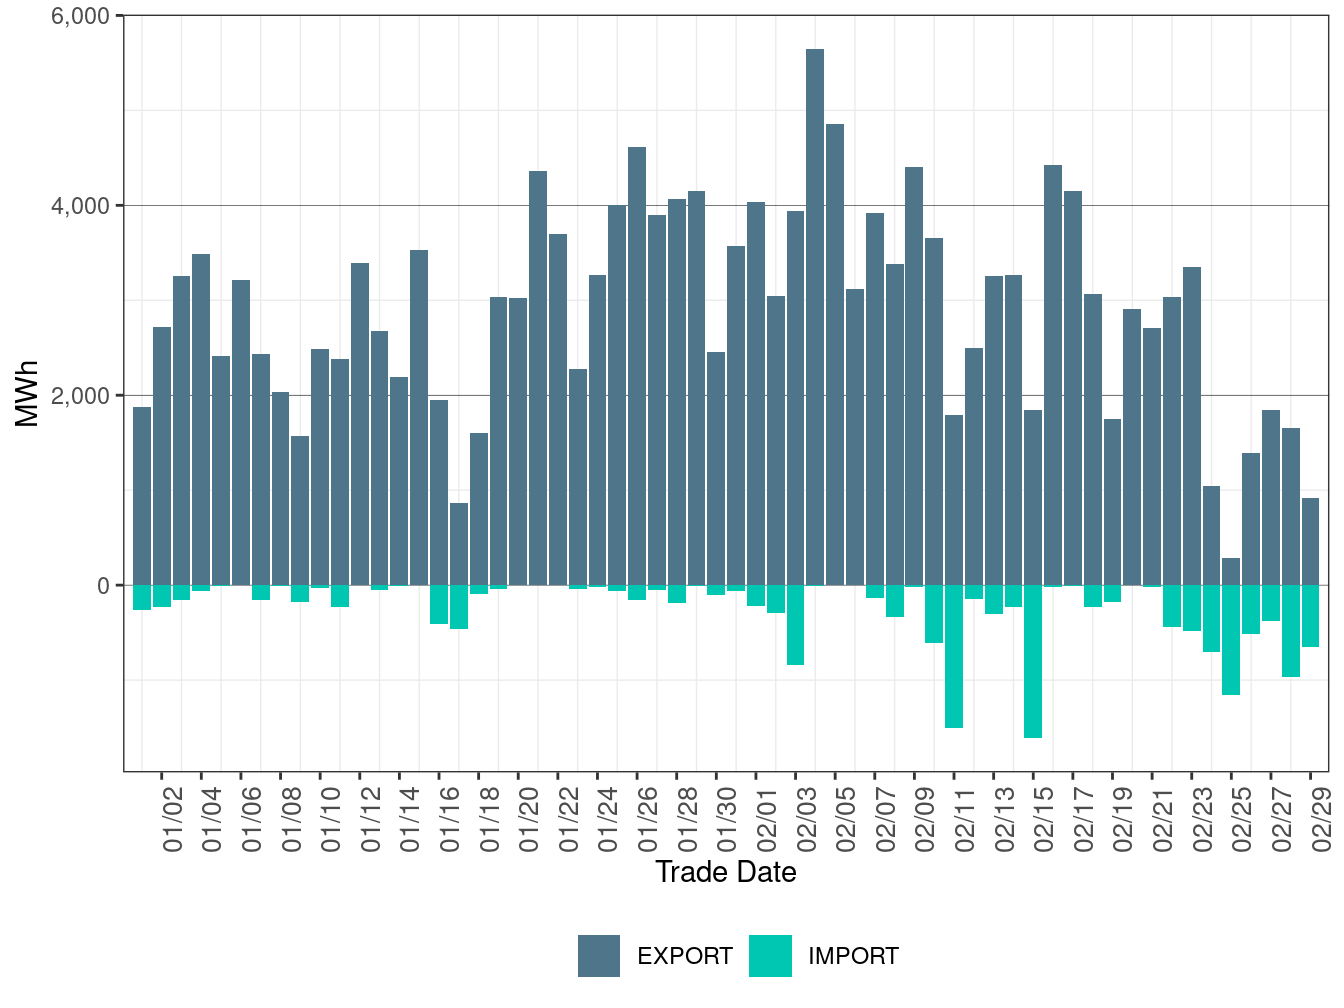
Figure 75: WEIM Transfers for IPCO in RTD
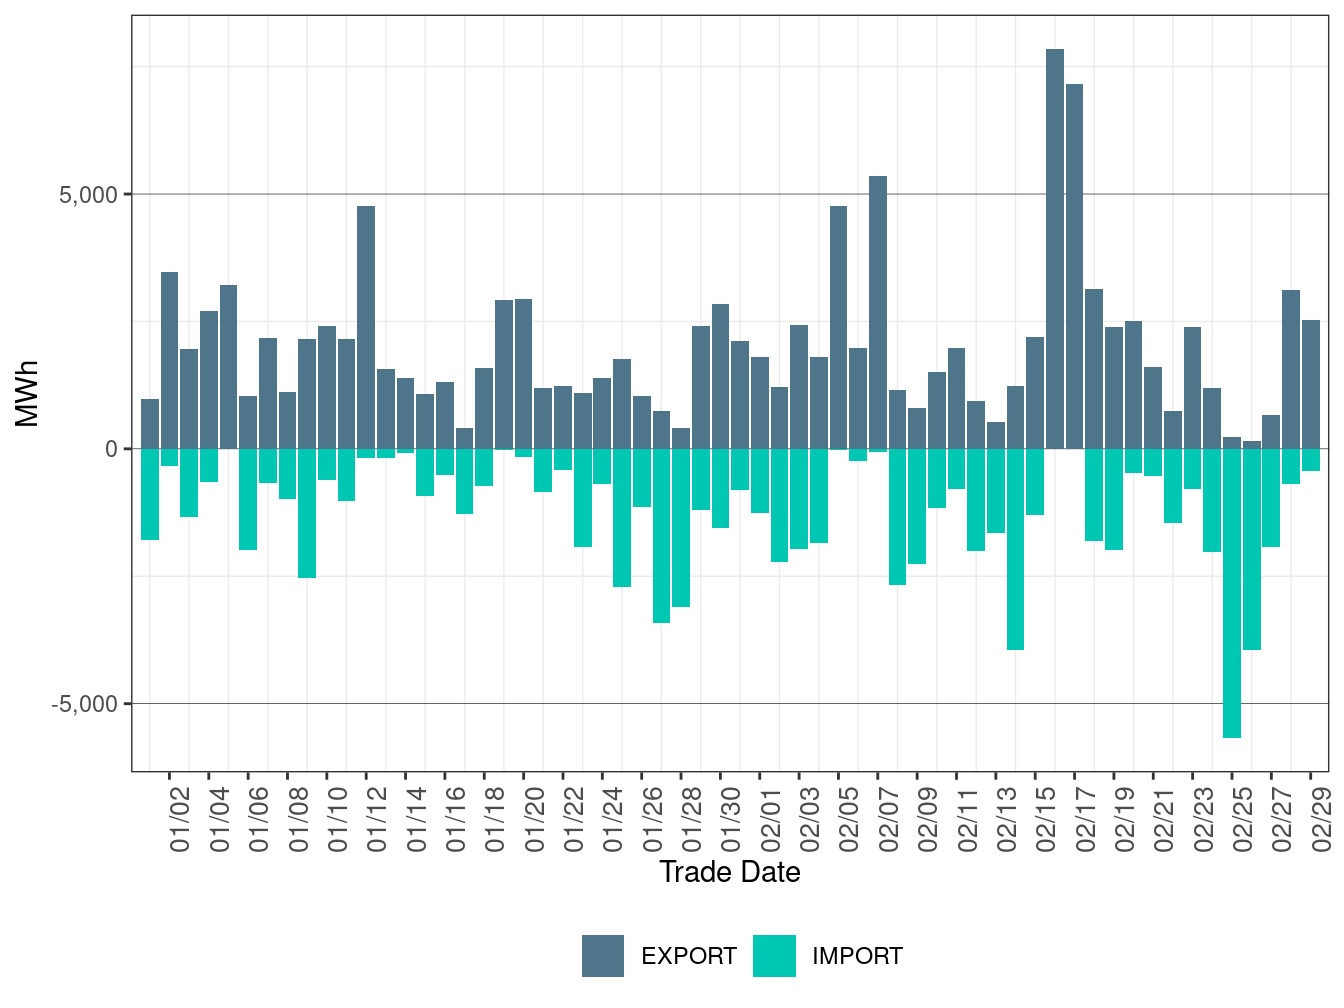
Figure 76: WEIM Transfers for LADWP in RTD
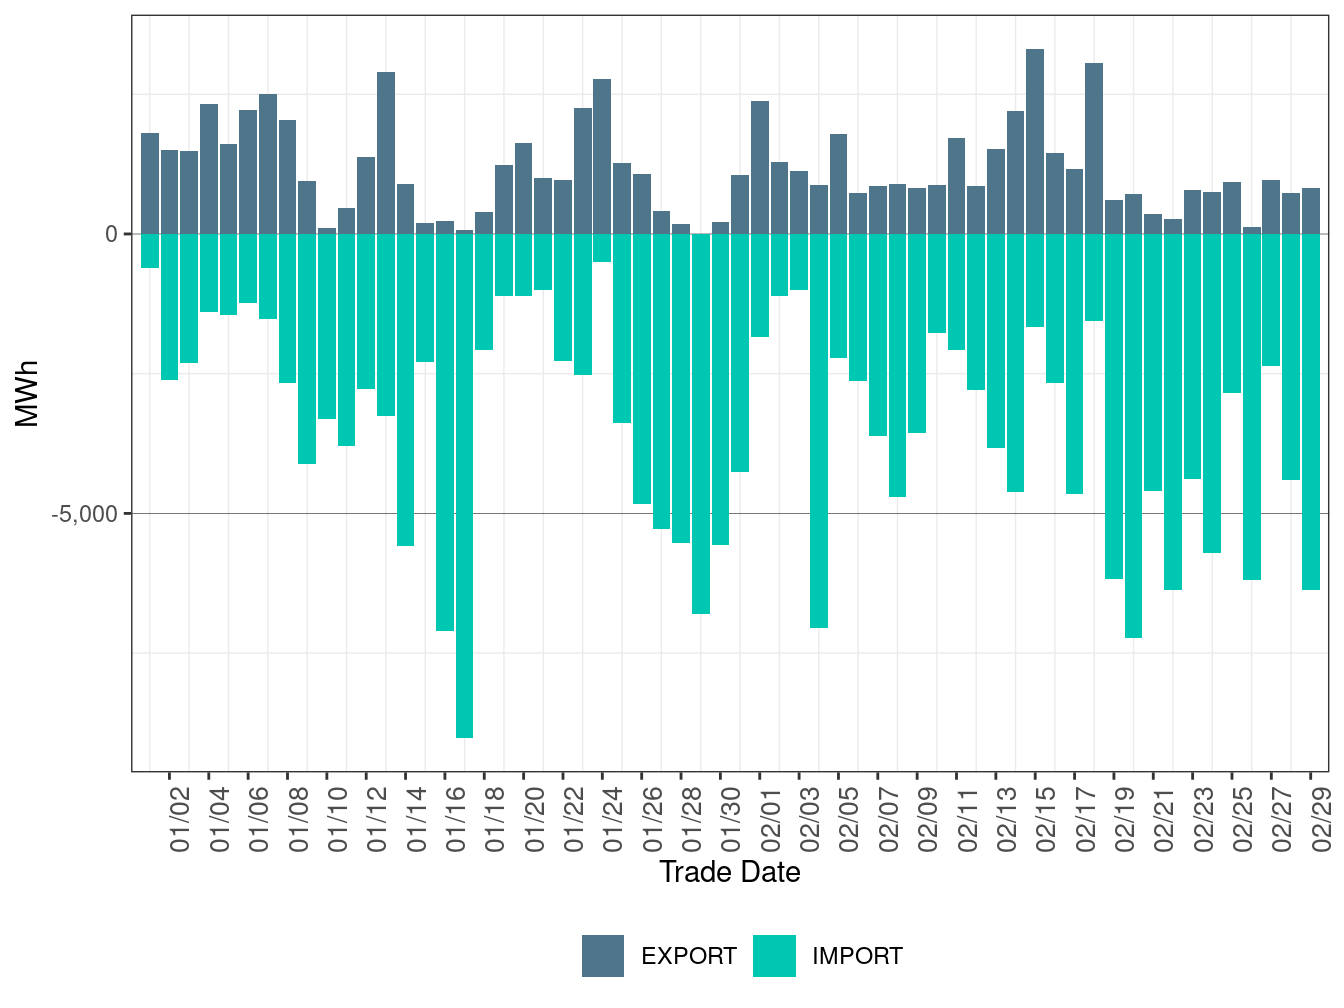
Figure 77: WEIM Transfers for NEVP in RTD
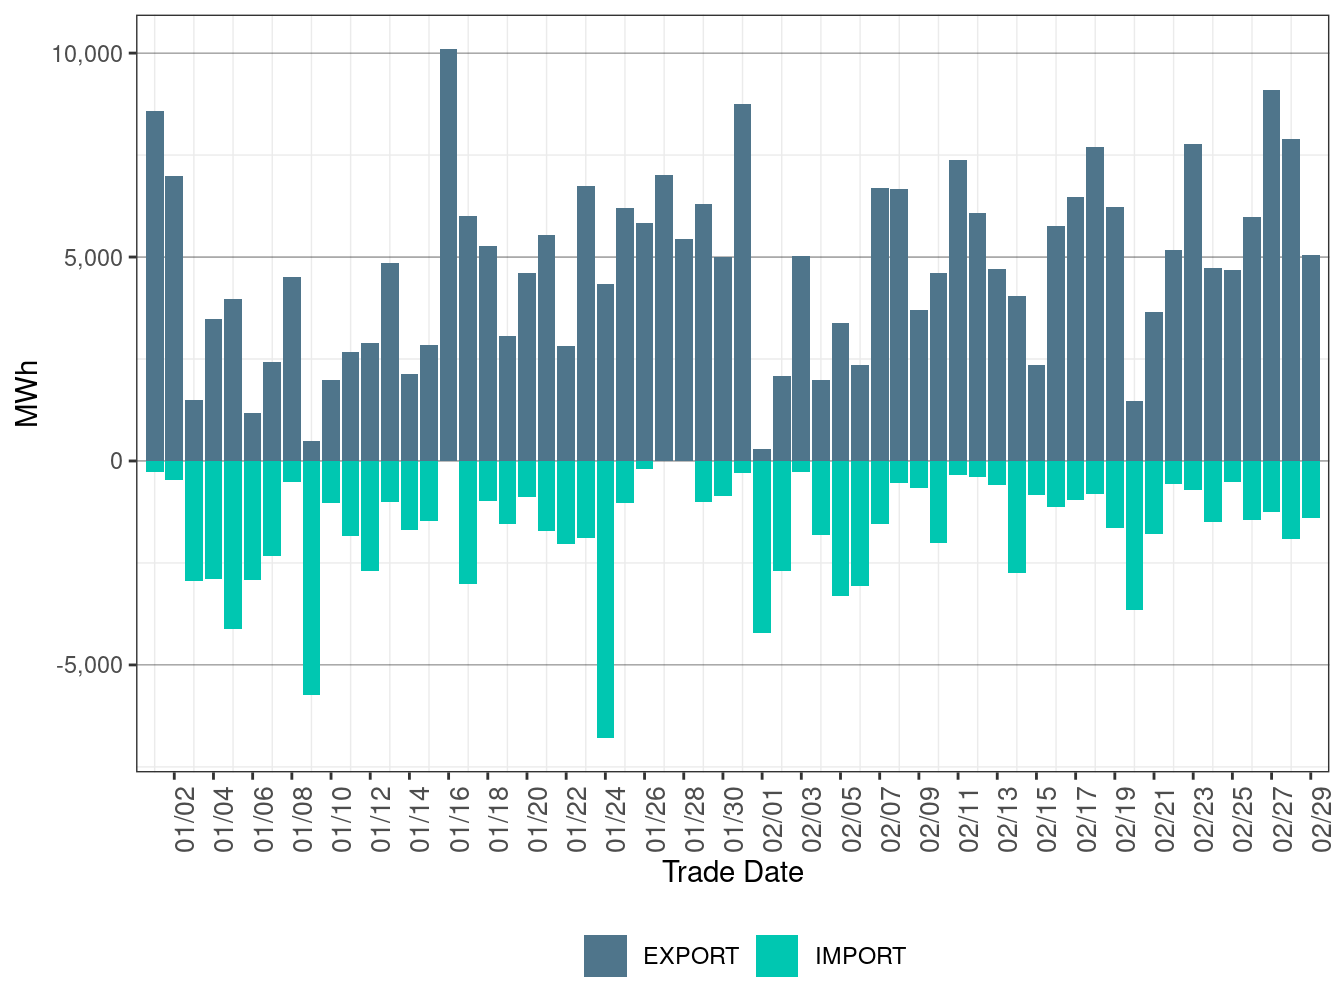
Figure 78: WEIM Transfers for NWMT in RTD
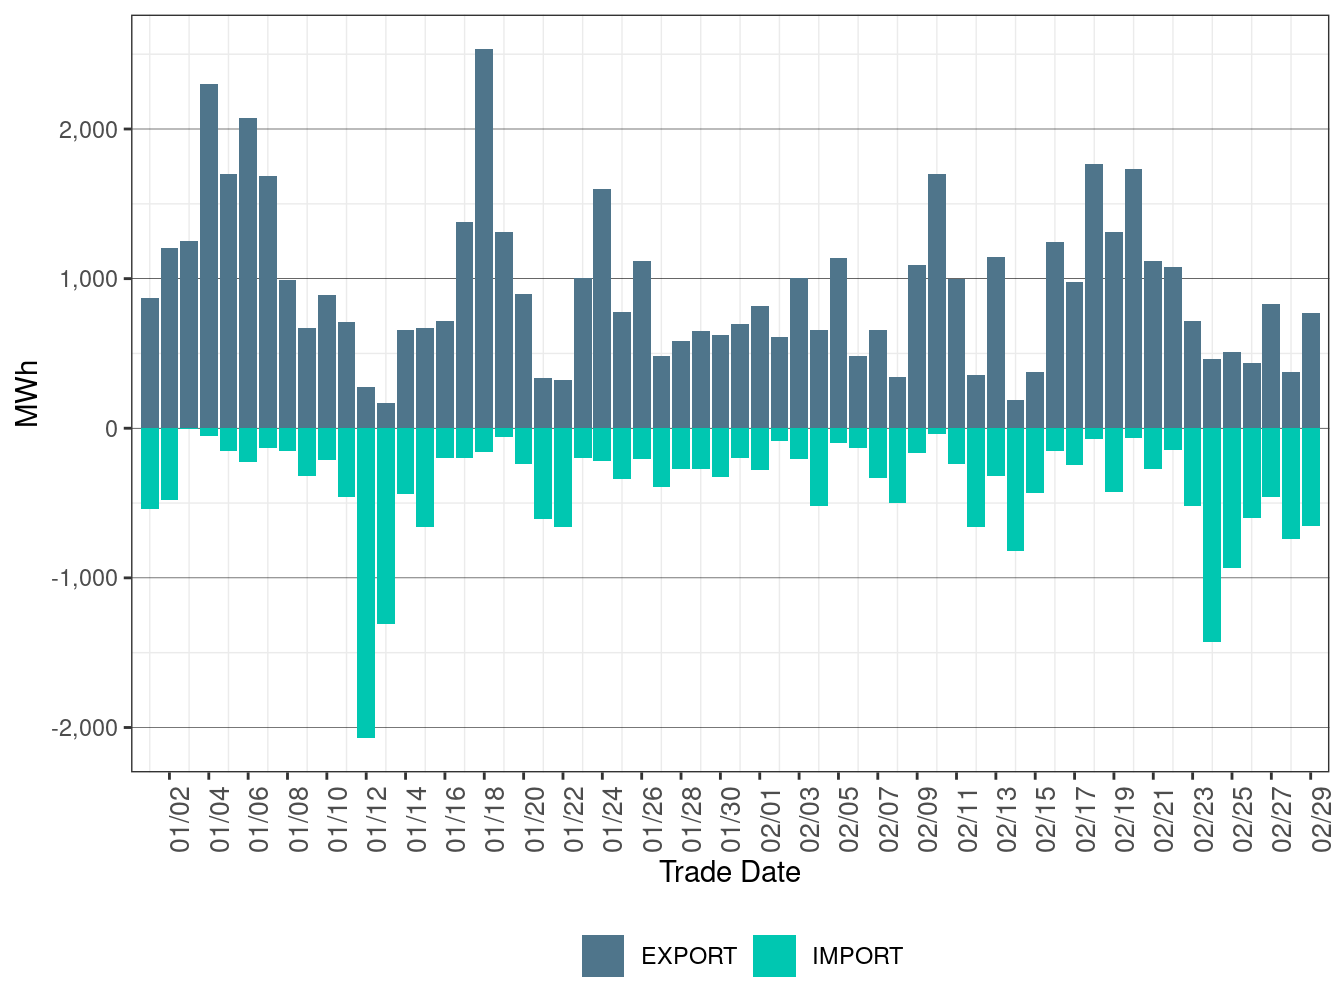
Figure 79: WEIM Transfers for PACE in RTD
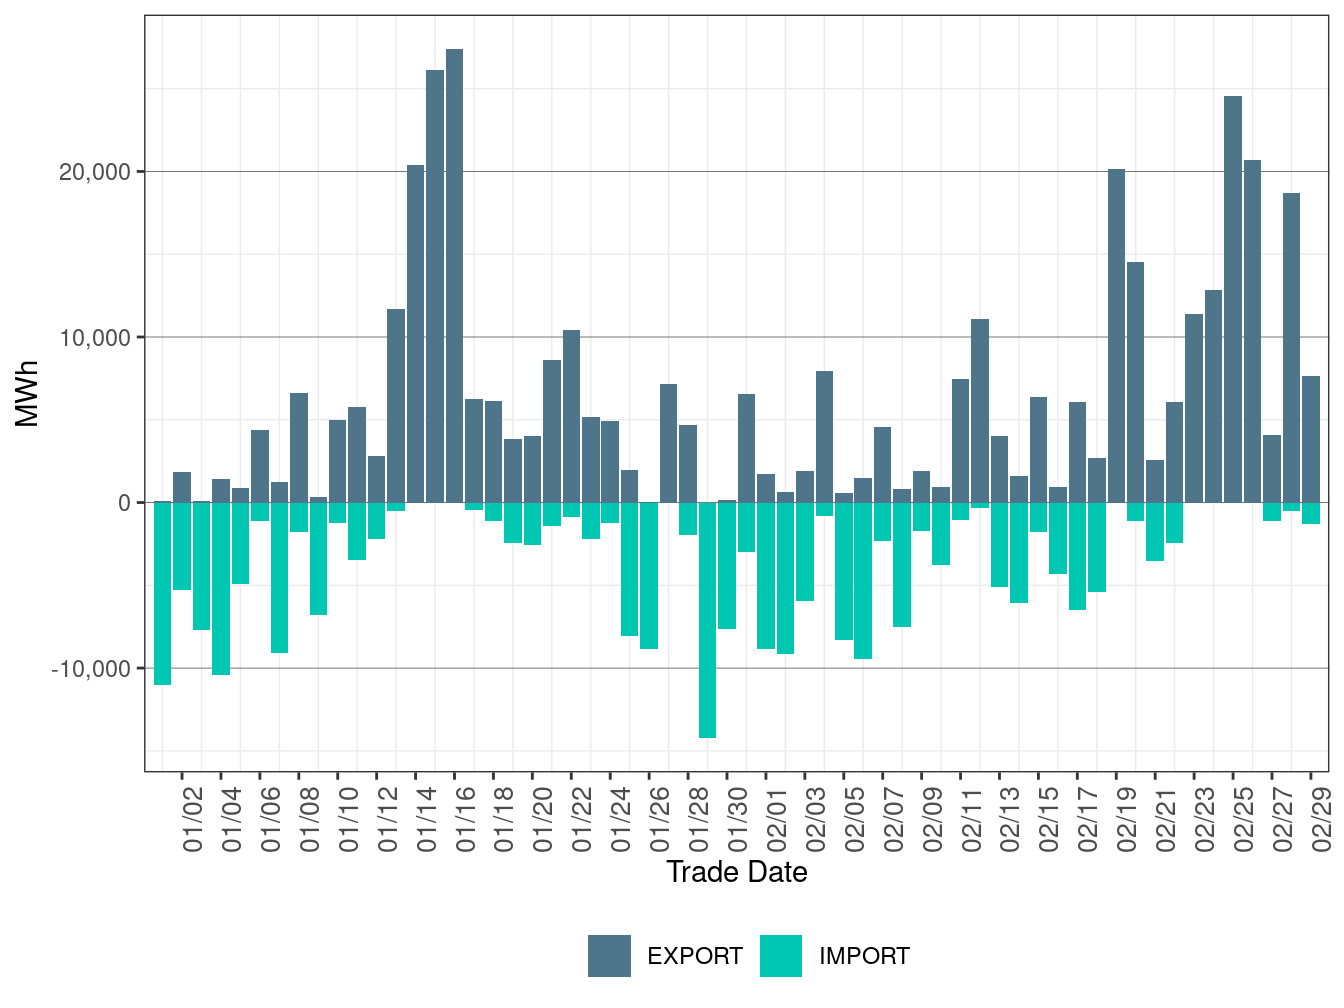
Figure 80: WEIM Transfers for PACW in RTD
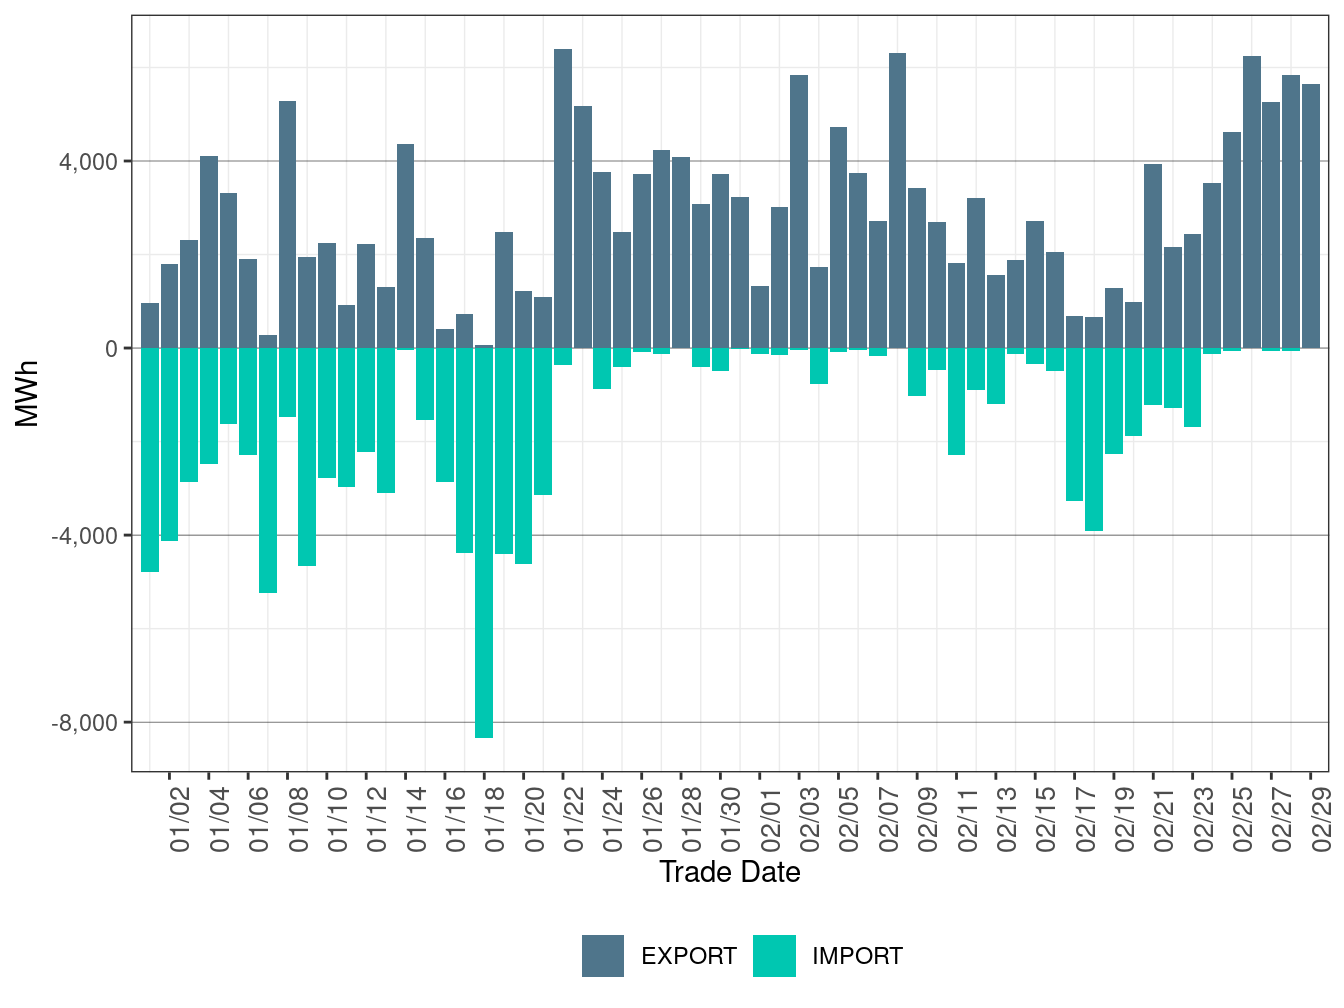
Figure 81: WEIM Transfers for PGE in RTD
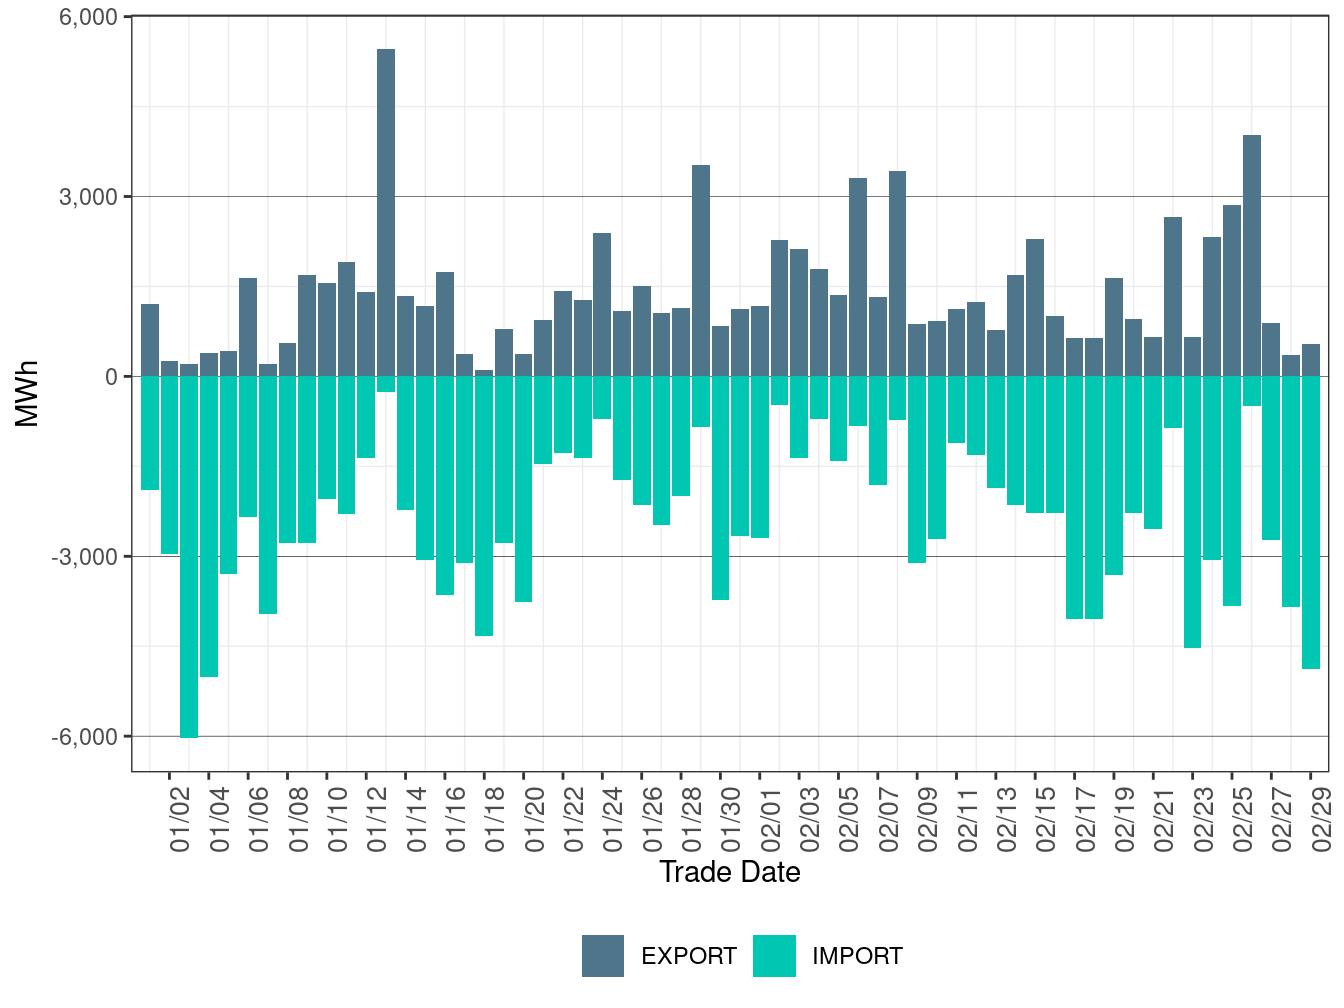
Figure 82: WEIM Transfers for PNM in RTD
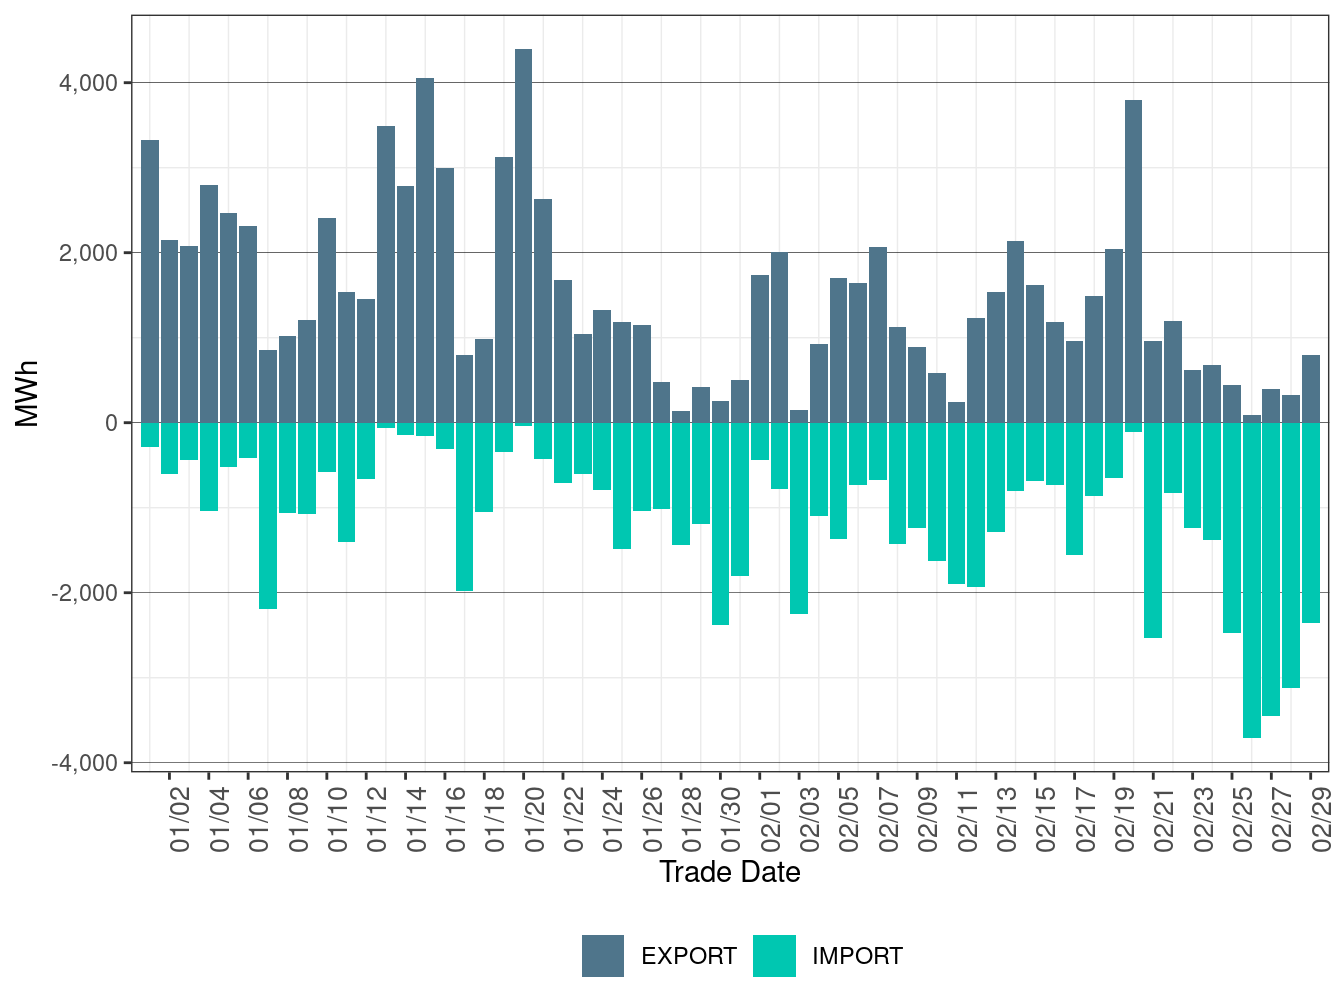
Figure 83: WEIM Transfers for PSEI in RTD
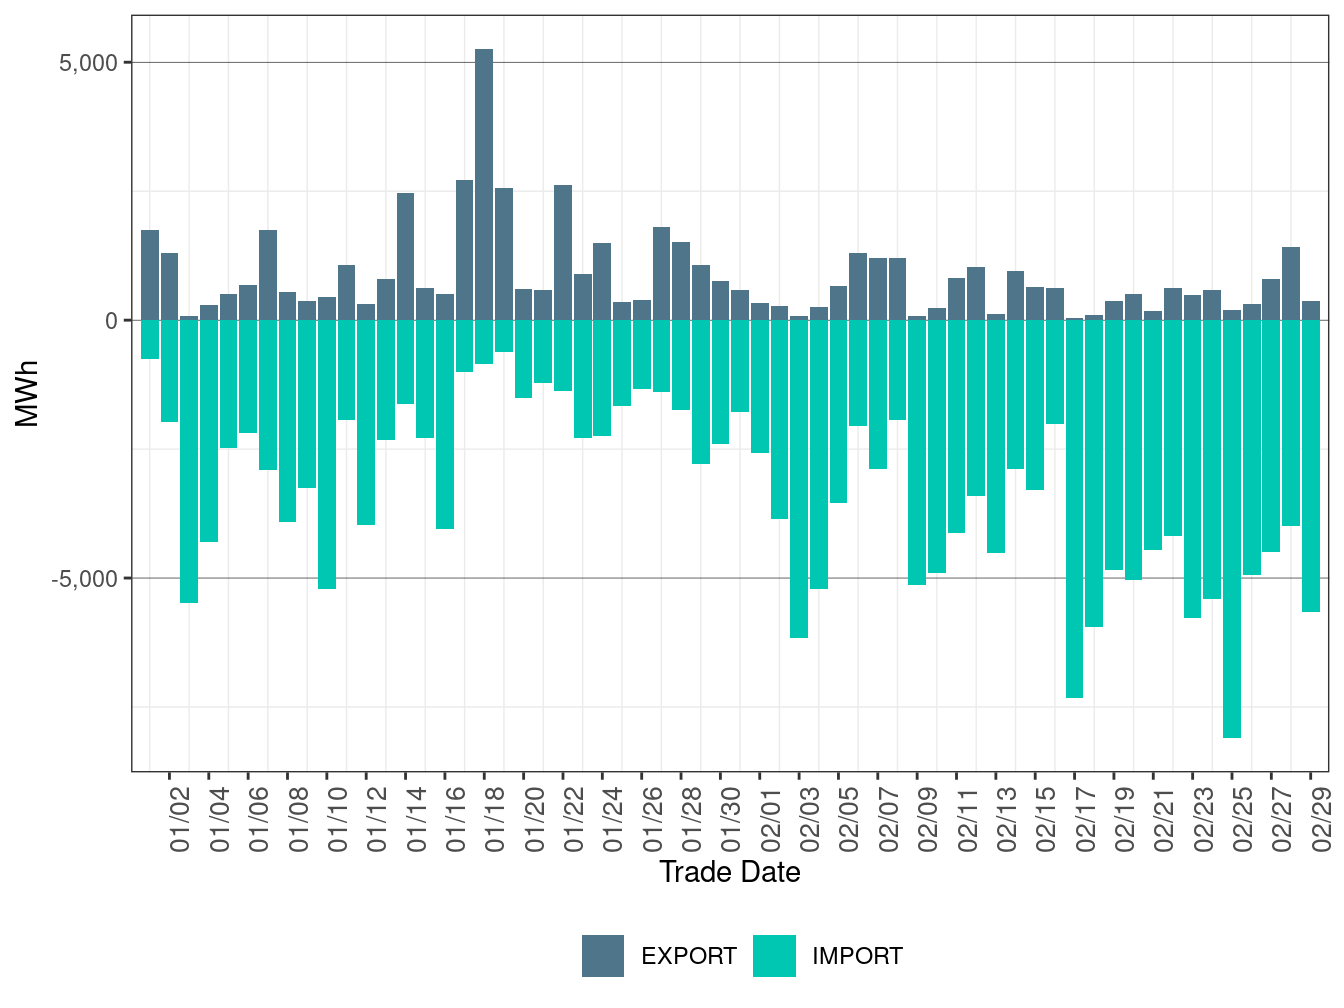
Figure 84: WEIM Transfers for SCL in RTD
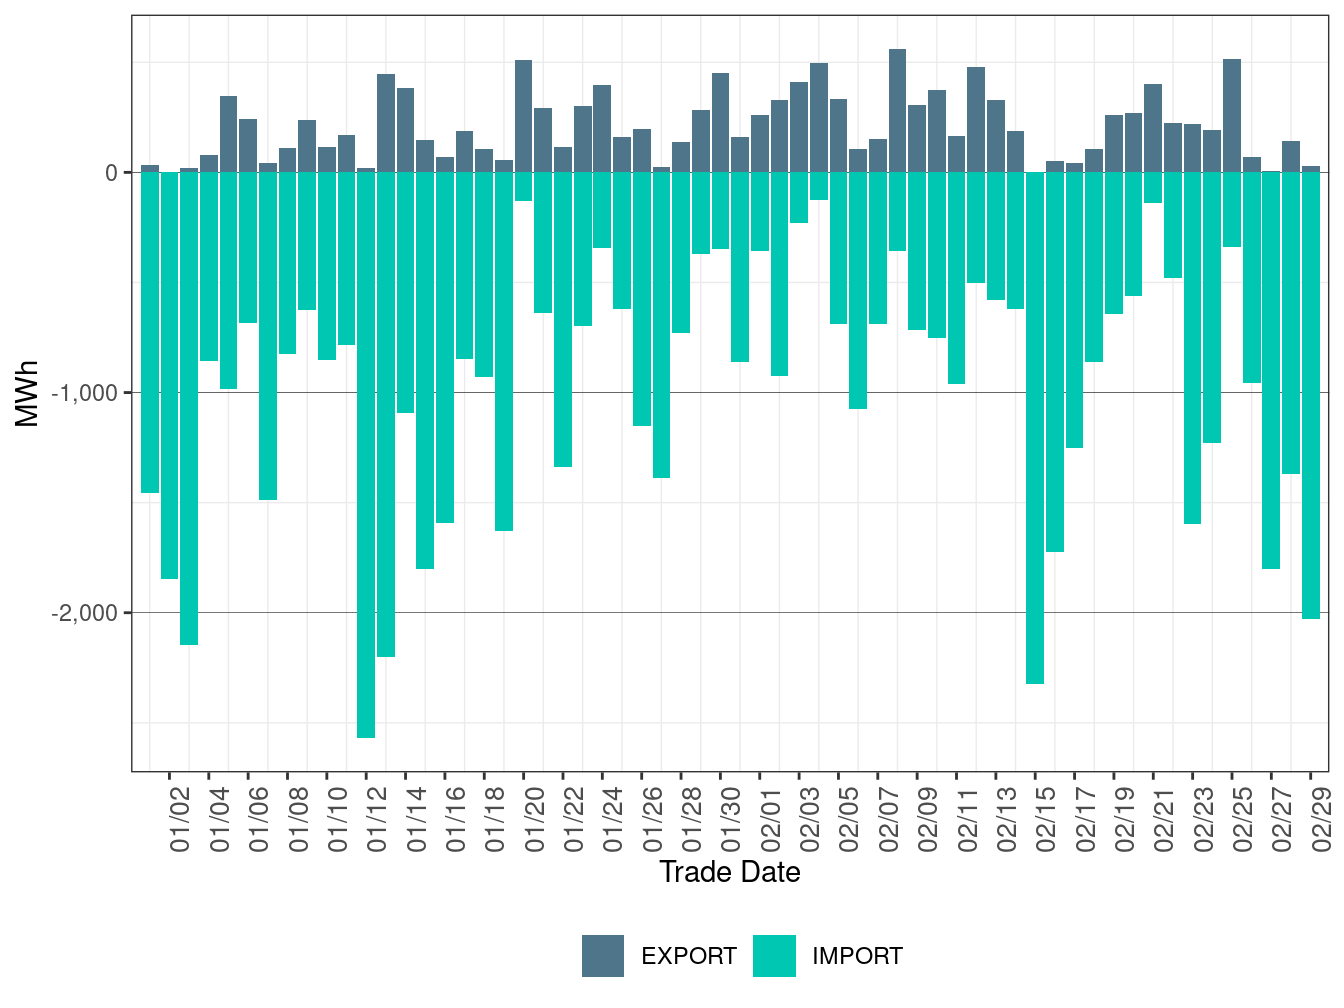
Figure 85: WEIM Transfers for SRP in RTD
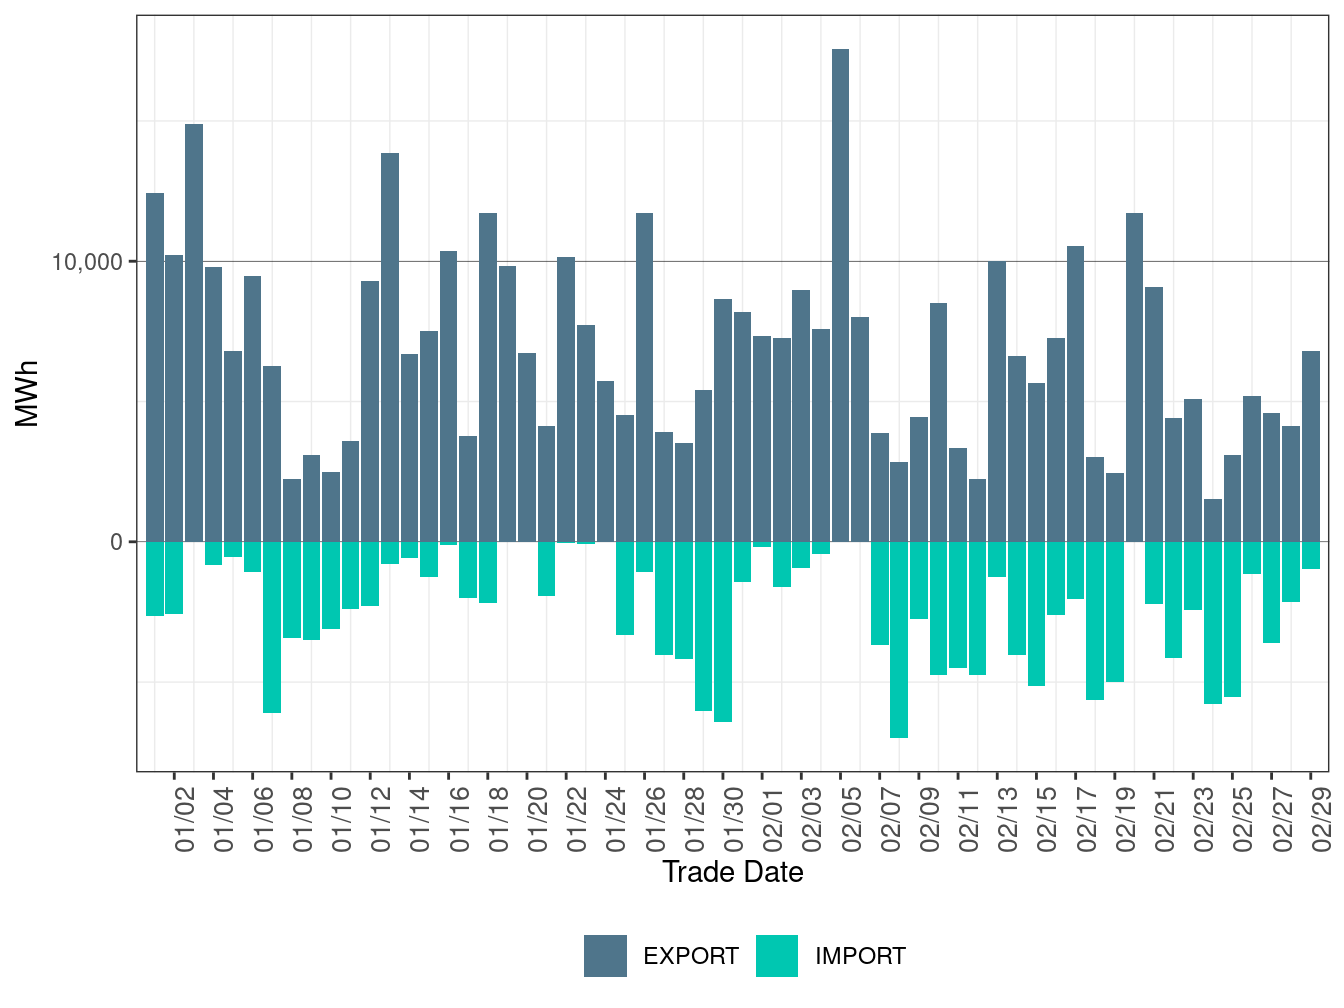
Figure 86: WEIM Transfers for TEP in RTD
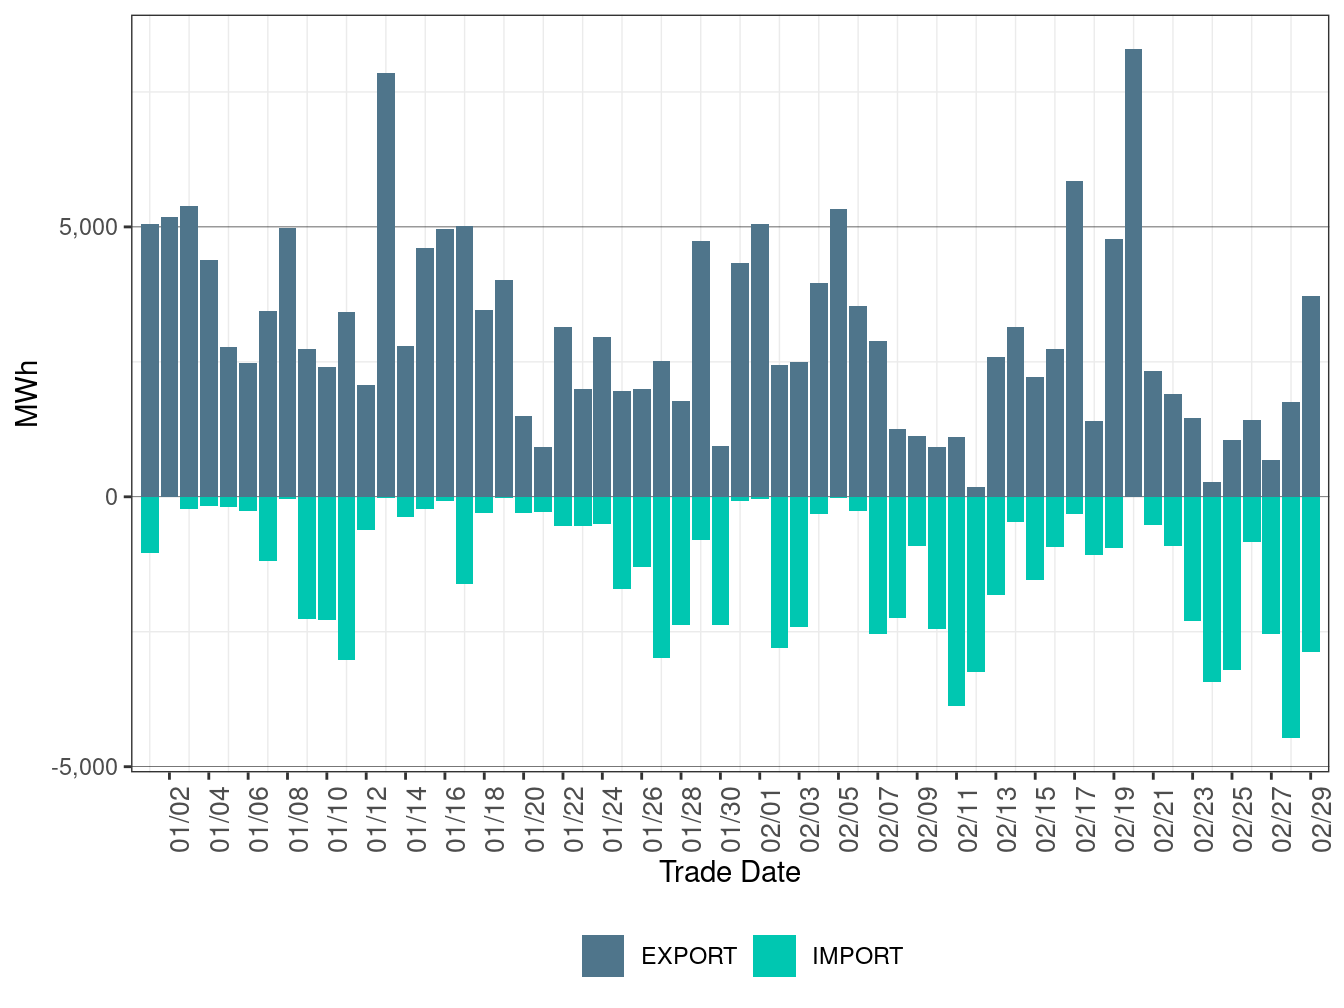
Figure 87: WEIM Transfers for TID in RTD
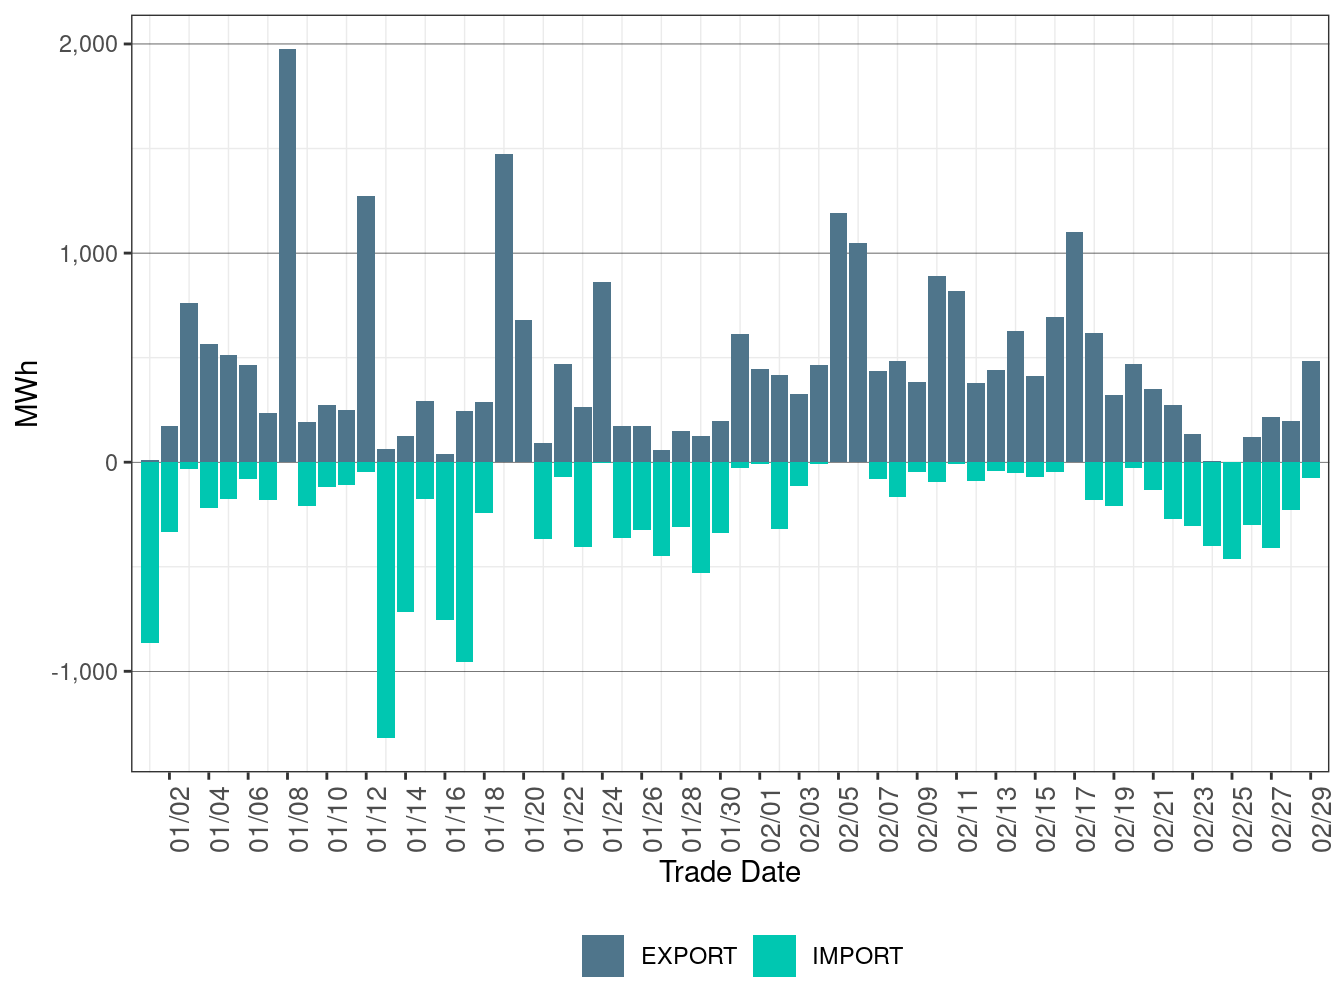
Figure 88: WEIM Transfers for TPWR in RTD
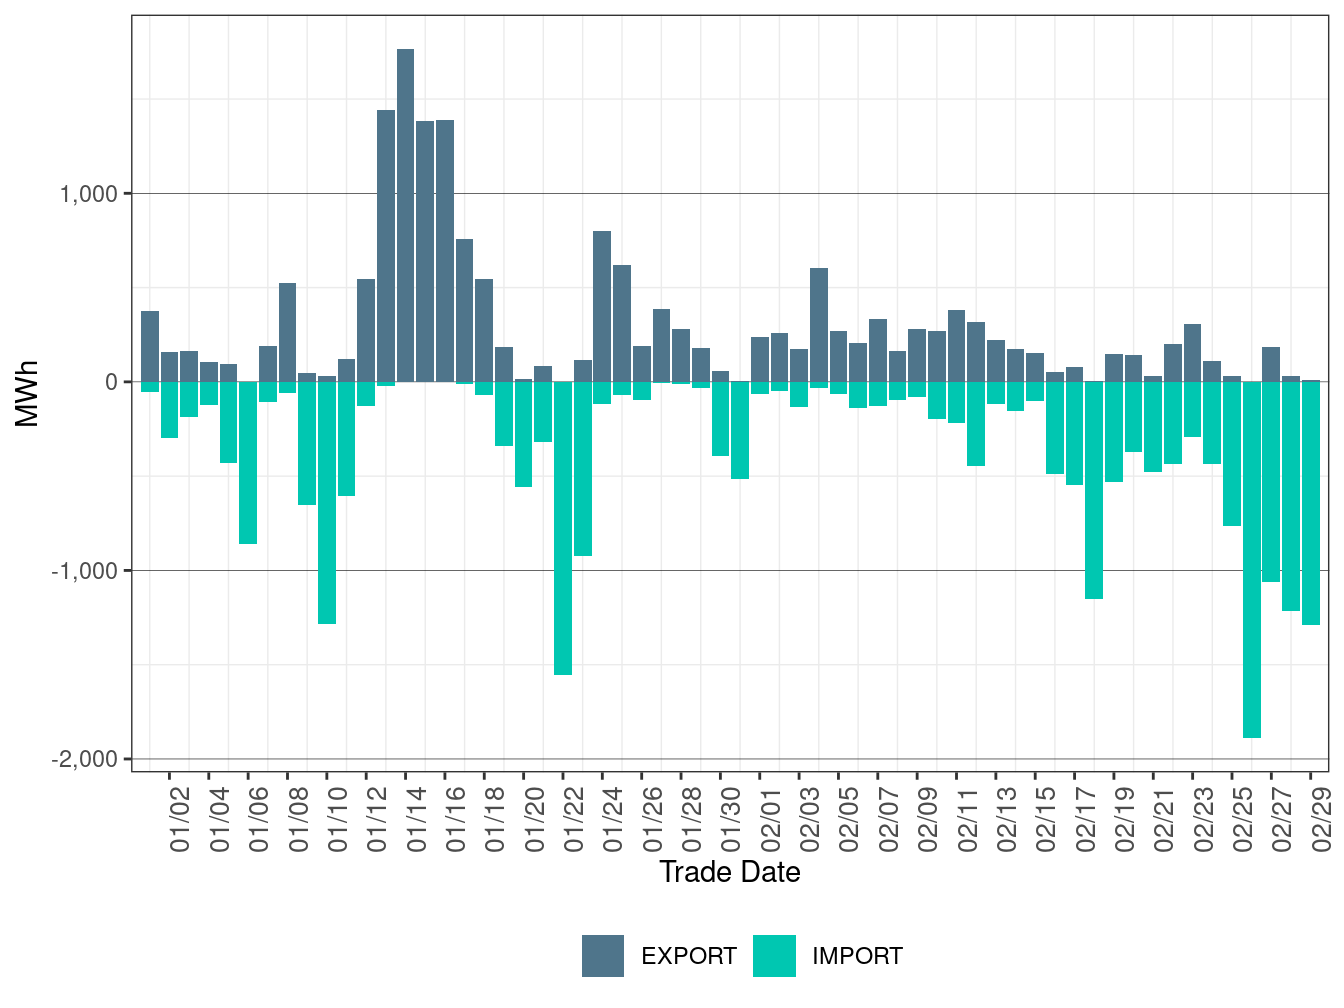
Figure 89: WEIM Transfers for WALC in RTD
WEIM Cost Allocation
Figure 90 shows daily real-time imbalance energy offset (RTIEO) cost for each WEIM entity and Figure 91 shows daily real-time congestion imbalance offset (RTCIO) cost for each WEIM entity. RTIEO and RTCIO are calculated as per Tariff Section 11.5.4. Since the implementation of the new market, imbalance offset is a charge allocated to measured demand. A positive value indicates a charge to measured demand and a negative value indicates a payment to measured demand.
Total WEIM RTIEO in February increased to $2.70 million from -$0.69 million in the previous month. Total WEIM RTICO increased to -$19.89 million in February from -$50.05 million in the previous month.
Figure 90: WEIM Real-Time Imbalance Energy Offset by Area
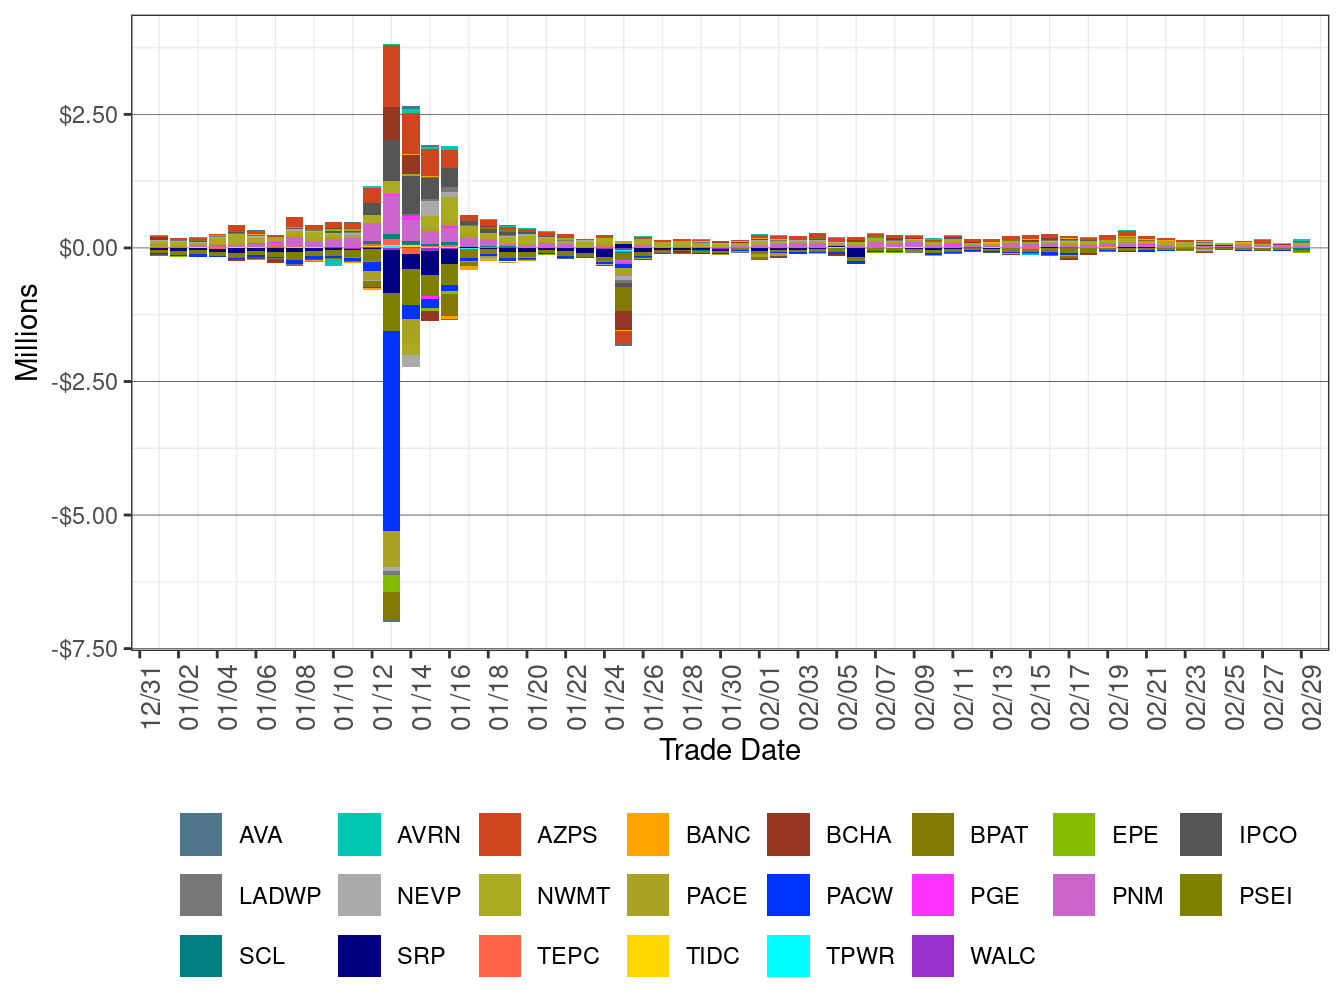
Figure 91: WEIM Real-Time Congestion Imbalance Offset by Area
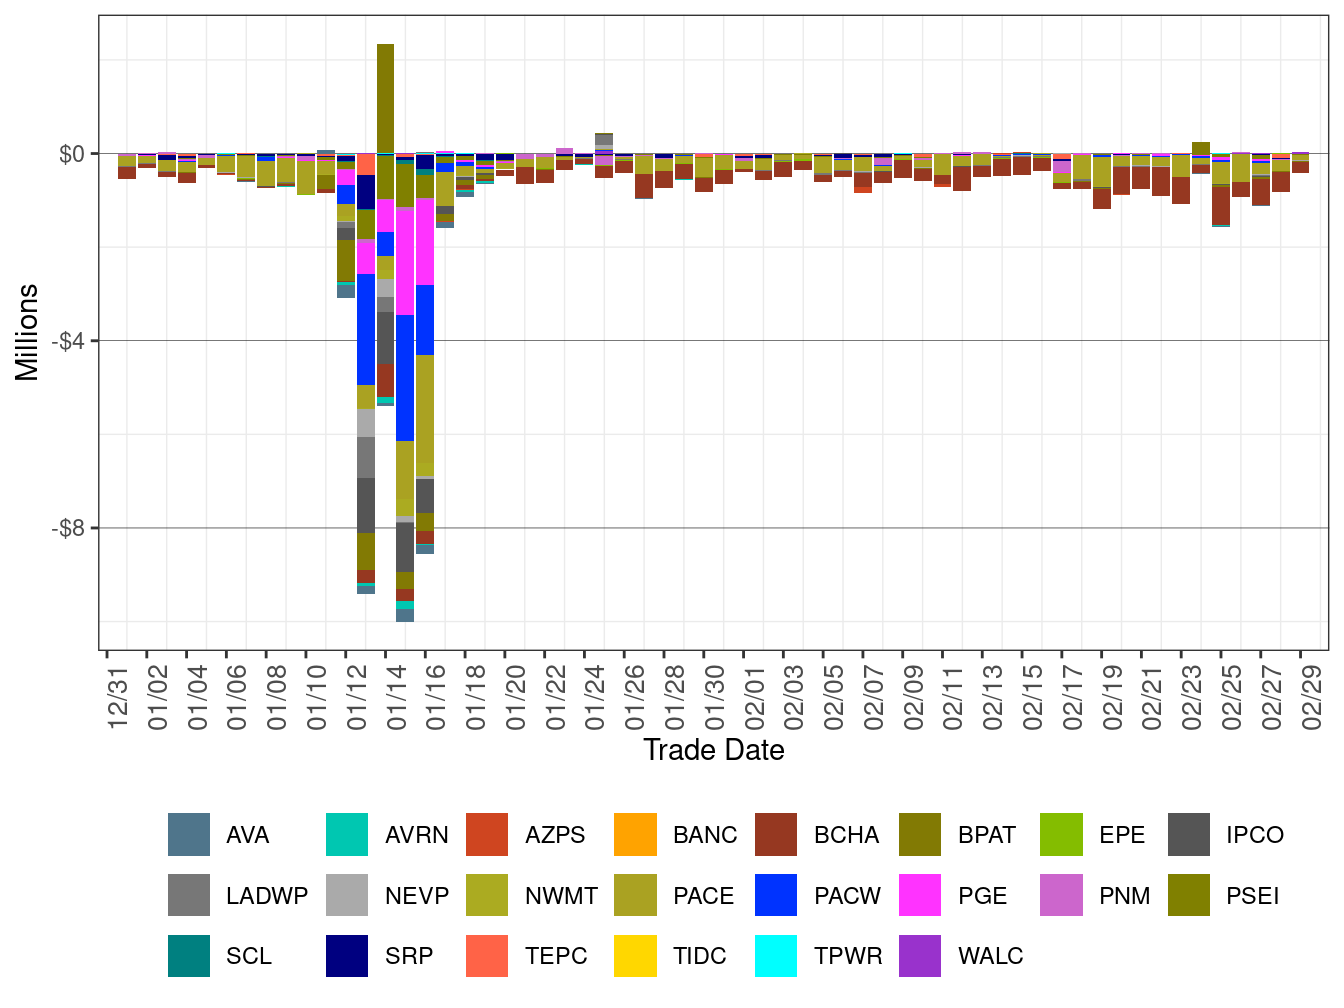
Figure 92 shows daily bid cost recovery for each WEIM entity.
Total WEIM BCR decreased to $0.87 million in February from $3.05 million in the previous month.
Figure 92: WEIM Bid Cost Recovery by Area
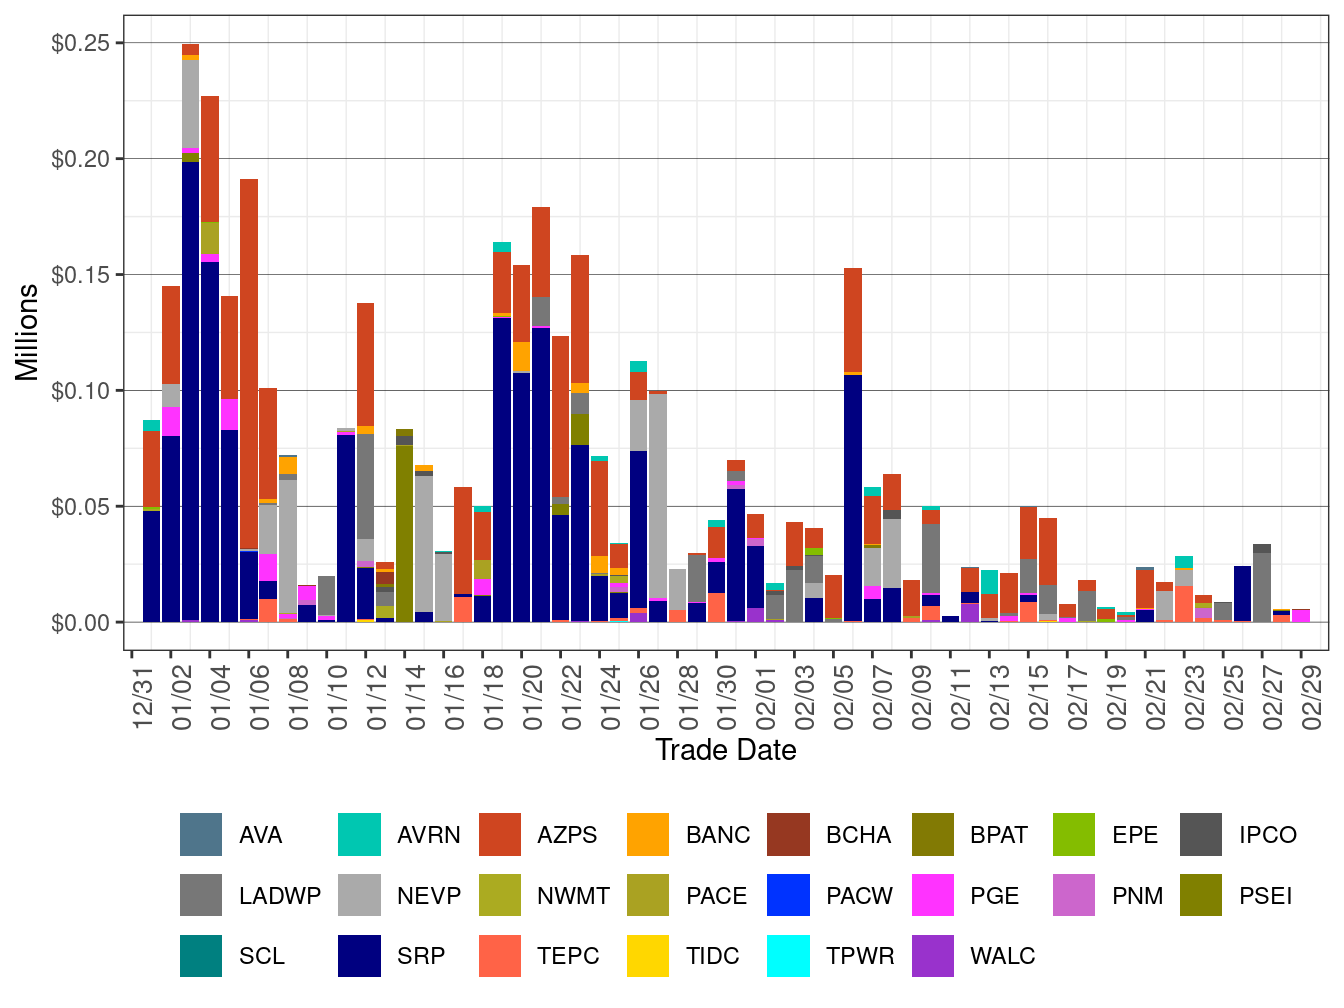
Figure 93 shows the flexible ramping up uncertainty payment for each WEIM entity.
Total flexible ramping up uncertainty payment in February increased to $0.35 million from $0.30 million compared to the previous month.
Figure 94 shows the flexible ramping down uncertainty payment for each WEIM entity.
Total flexible ramping down uncertainty payment in February decreased to $10,800 from $37,600 in the previous month.
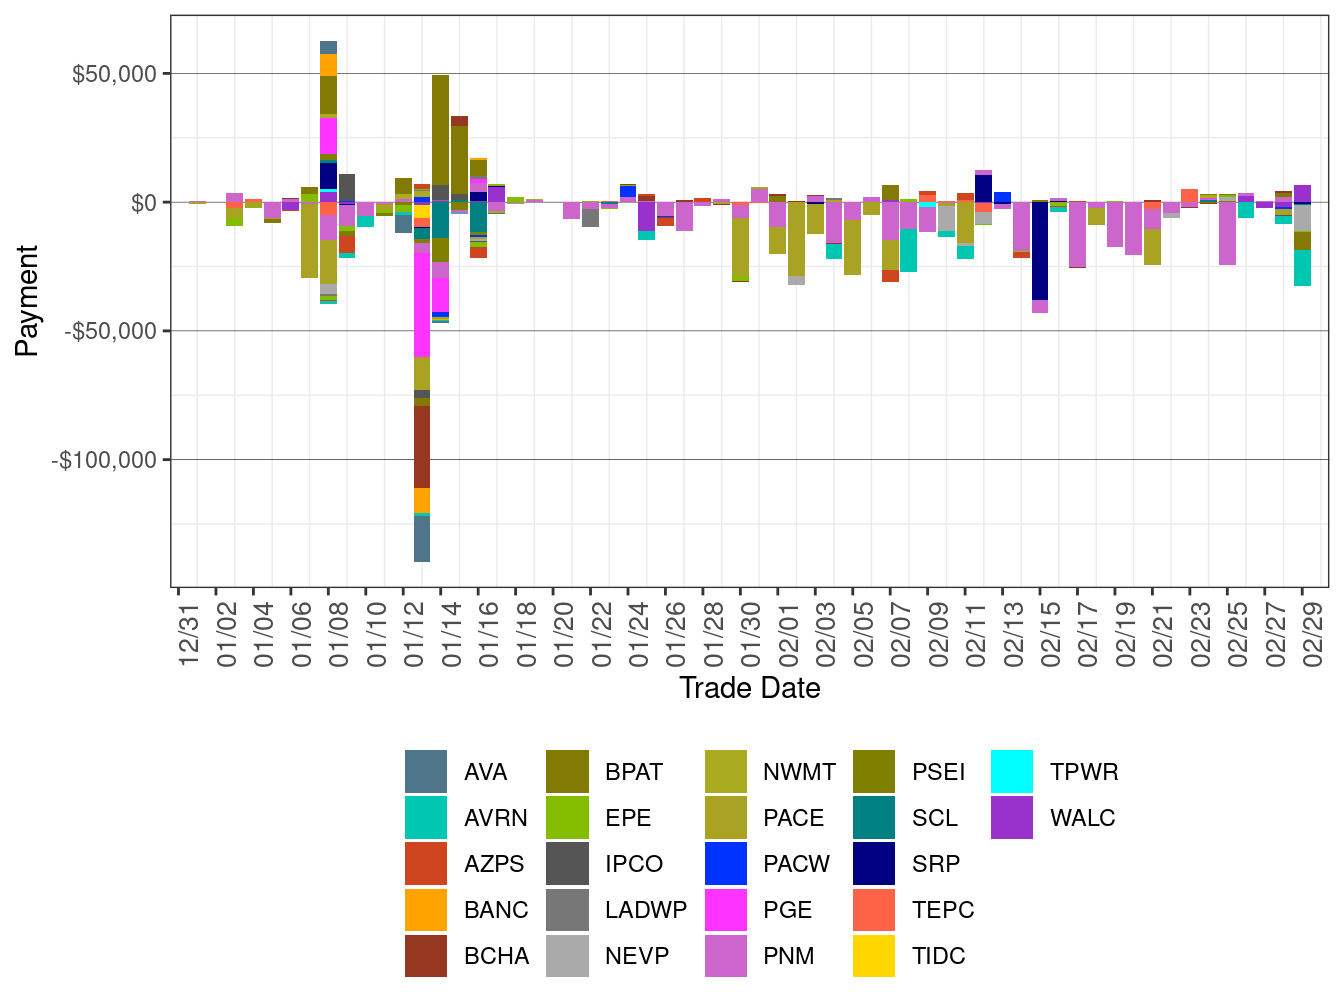
Figure 95 shows the flexible ramping forecast payment for each WEIM entity.
Total forecast payment in February decreased to -$413,000 from -$214,000 in the previous month.
Figure 93: Flexible Ramping Up Uncertainty Payment
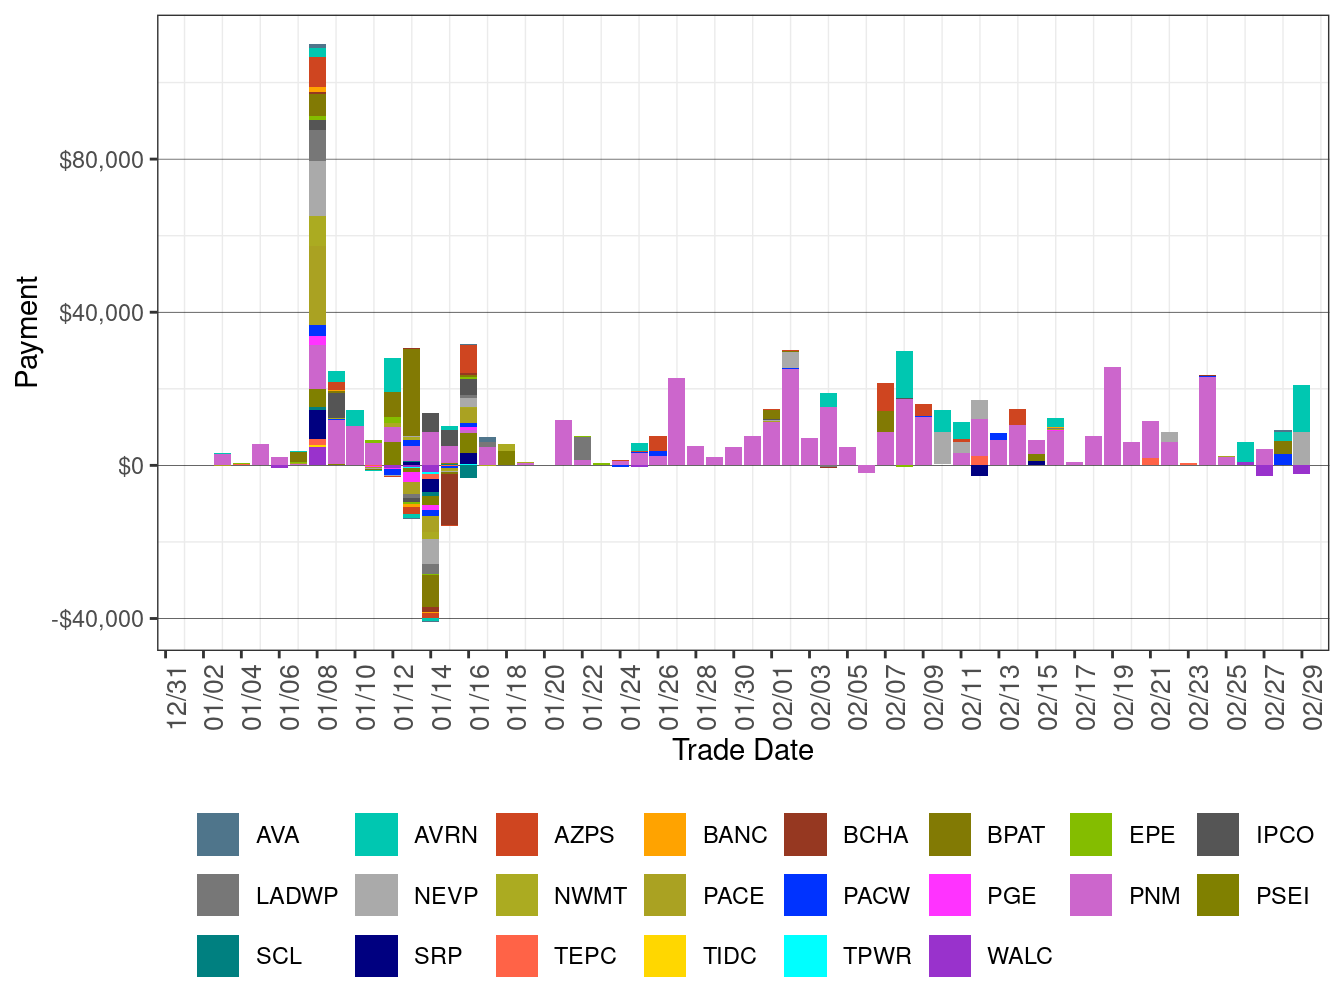
Figure 94: Flexible Ramping Down Uncertainty Payment
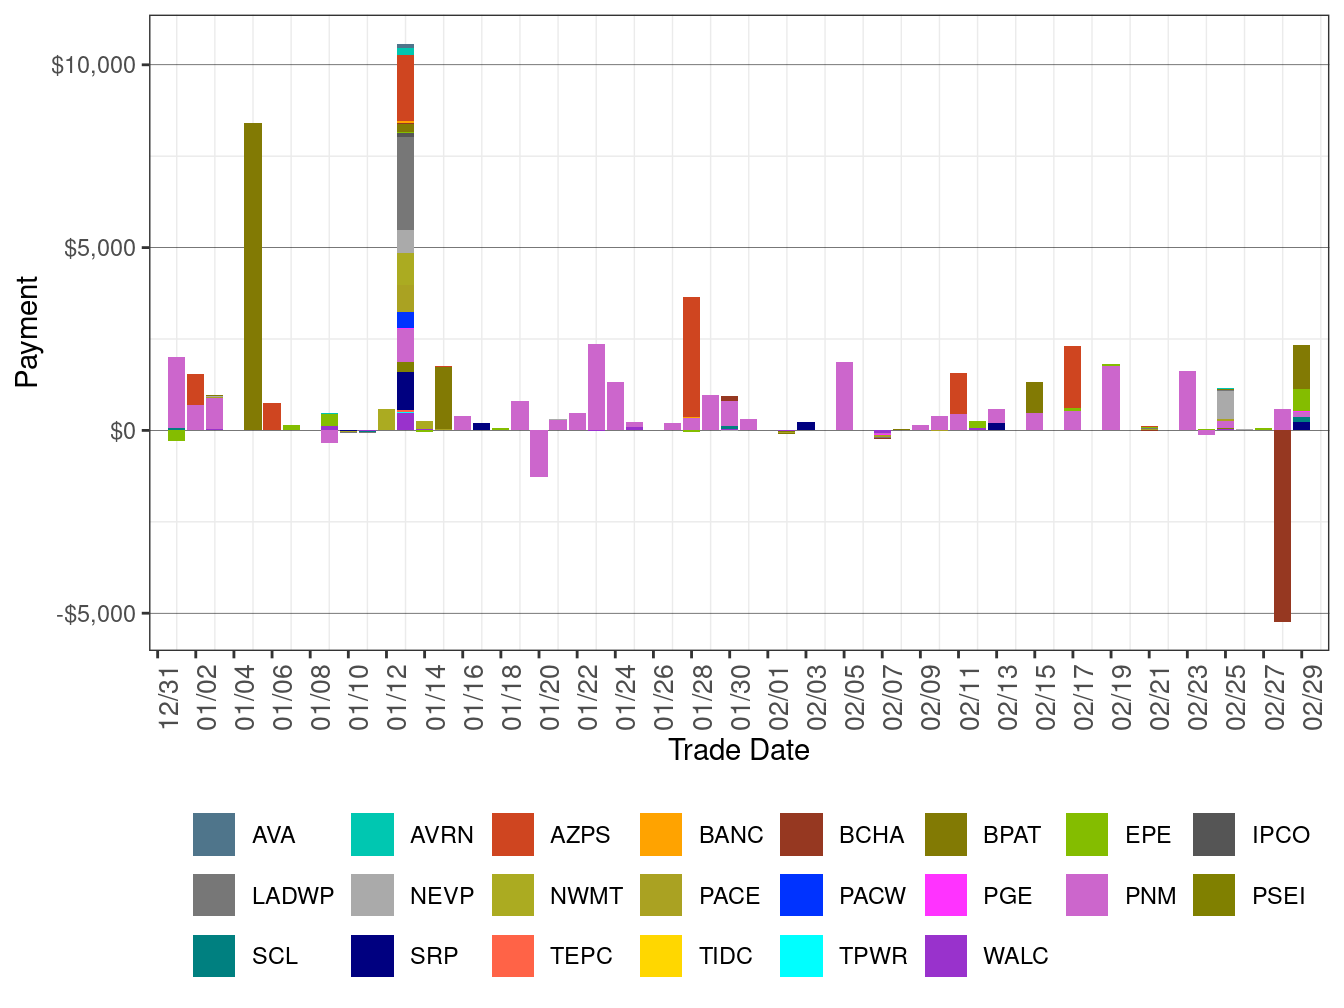
Figure 95: Flexible Ramping Forecast Payment
The ISO’s Western Energy Imbalance Market Business Practice Manual describes the methodology for determining whether a WEIM participating resource is dispatched to support transfers to serve California load. The methodology ensures that the dispatch considers the combined energy and associated marginal greenhouse gas (GHG) compliance cost based on submitted bids. The WEIM dispatches to support transfers into California are documented below in Figure 96 and Table 13.
Figure 96: GHG Attributions by Fuel Type
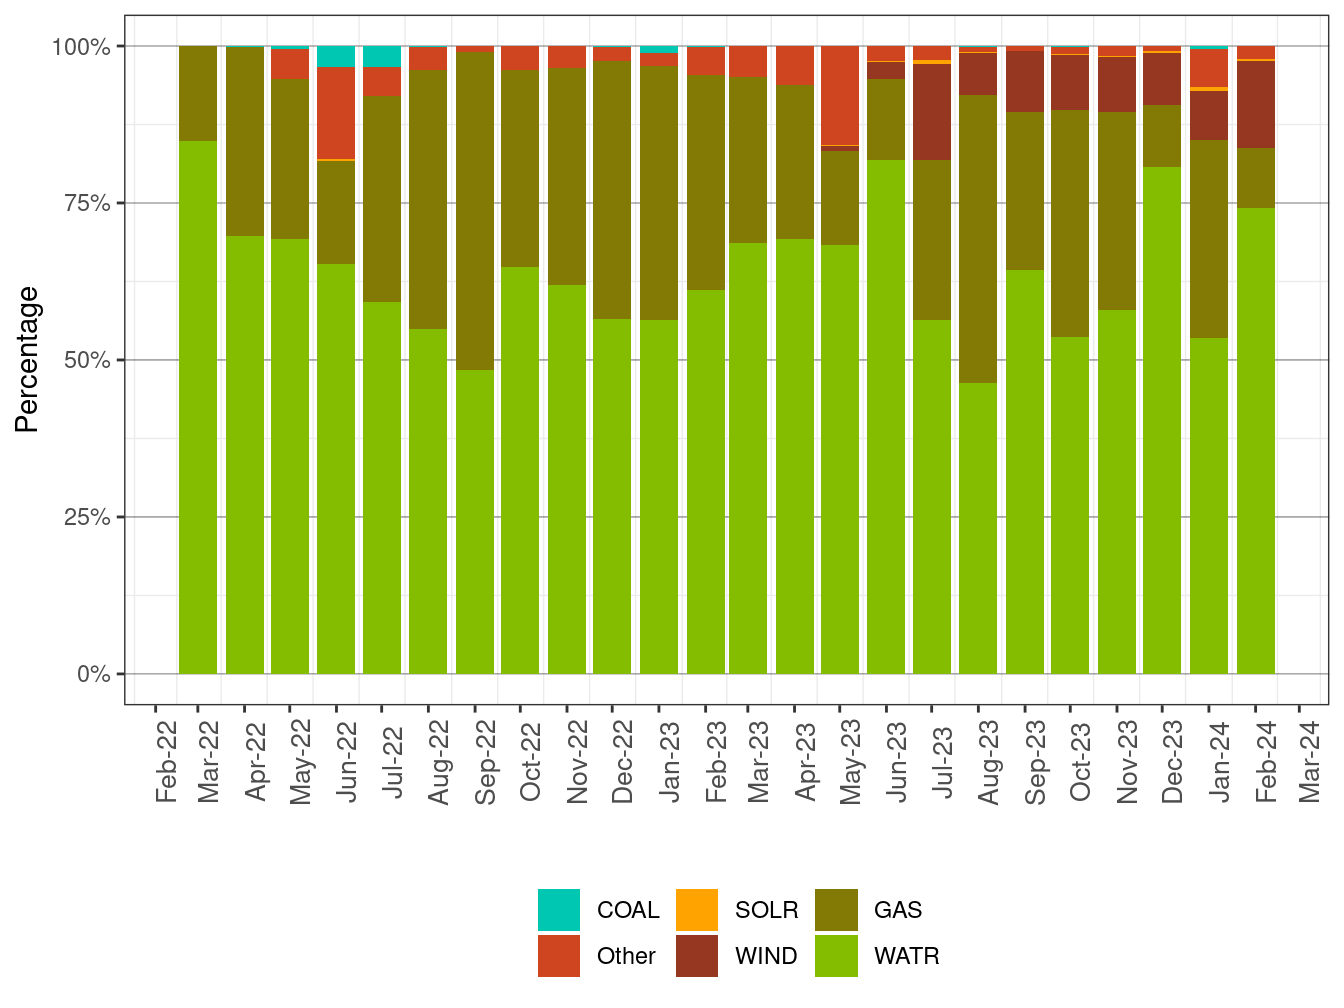
| Month-Year | Coal (%) | Other (%) | Solar (%) | Wind (%) | Gas (%) | Water (%) |
|---|---|---|---|---|---|---|
| Mar-2022 | 0 | 0 | 0 | 0 | 15.1% | 84.9% |
| Apr-2022 | 0.2% | 0 | 0 | 0 | 30.1% | 69.7% |
| May-2022 | 0.5% | 4.8% | 0 | 0 | 25.5% | 69.3% |
| Jun-2022 | 3.3% | 14.7% | 0.4% | 0 | 16.4% | 65.2% |
| Jul-2022 | 3.3% | 4.7% | 0 | 0 | 32.8% | 59.2% |
| Aug-2022 | 0.2% | 3.7% | 0 | 0 | 41.2% | 54.9% |
| Sep-2022 | 0.1% | 0.8% | 0 | 0 | 50.7% | 48.4% |
| Oct-2022 | 0.0% | 3.9% | 0 | 0 | 31.2% | 64.9% |
| Nov-2022 | 0.0% | 3.4% | 0 | 0 | 34.6% | 61.9% |
| Dec-2022 | 0.1% | 2.2% | 0 | 0 | 41.2% | 56.5% |
| Jan-2023 | 1.1% | 2.1% | 0 | 0 | 40.5% | 56.4% |
| Feb-2023 | 0.1% | 4.4% | 0 | 0 | 34.3% | 61.2% |
| Mar-2023 | 0.1% | 4.9% | 0 | 0 | 26.4% | 68.6% |
| Apr-2023 | 0 | 6.2% | 0.0% | 0.0% | 24.5% | 69.3% |
| May-2023 | 0 | 15.8% | 0.1% | 0.8% | 15.0% | 68.3% |
| Jun-2023 | 0 | 2.5% | 0.0% | 2.8% | 12.9% | 81.8% |
| Jul-2023 | 0 | 2.2% | 0.6% | 15.3% | 25.4% | 56.4% |
| Aug-2023 | 0.2% | 0.7% | 0.2% | 6.8% | 45.8% | 46.4% |
| Sep-2023 | 0 | 0.8% | 0.1% | 9.7% | 25.1% | 64.4% |
| Oct-2023 | 0.2% | 1.1% | 0.2% | 8.7% | 36.1% | 53.7% |
| Nov-2023 | 0.0% | 1.6% | 0.1% | 8.7% | 31.5% | 58.0% |
| Dec-2023 | 0 | 0.7% | 0.3% | 8.3% | 9.8% | 80.8% |
| Jan-2024 | 0.4% | 6.1% | 0.6% | 7.8% | 31.6% | 53.5% |
| Feb-2024 | 0.1% | 2.0% | 0.4% | 13.8% | 9.5% | 74.3% |