3 Market Performance Metrics
Day-Ahead Prices
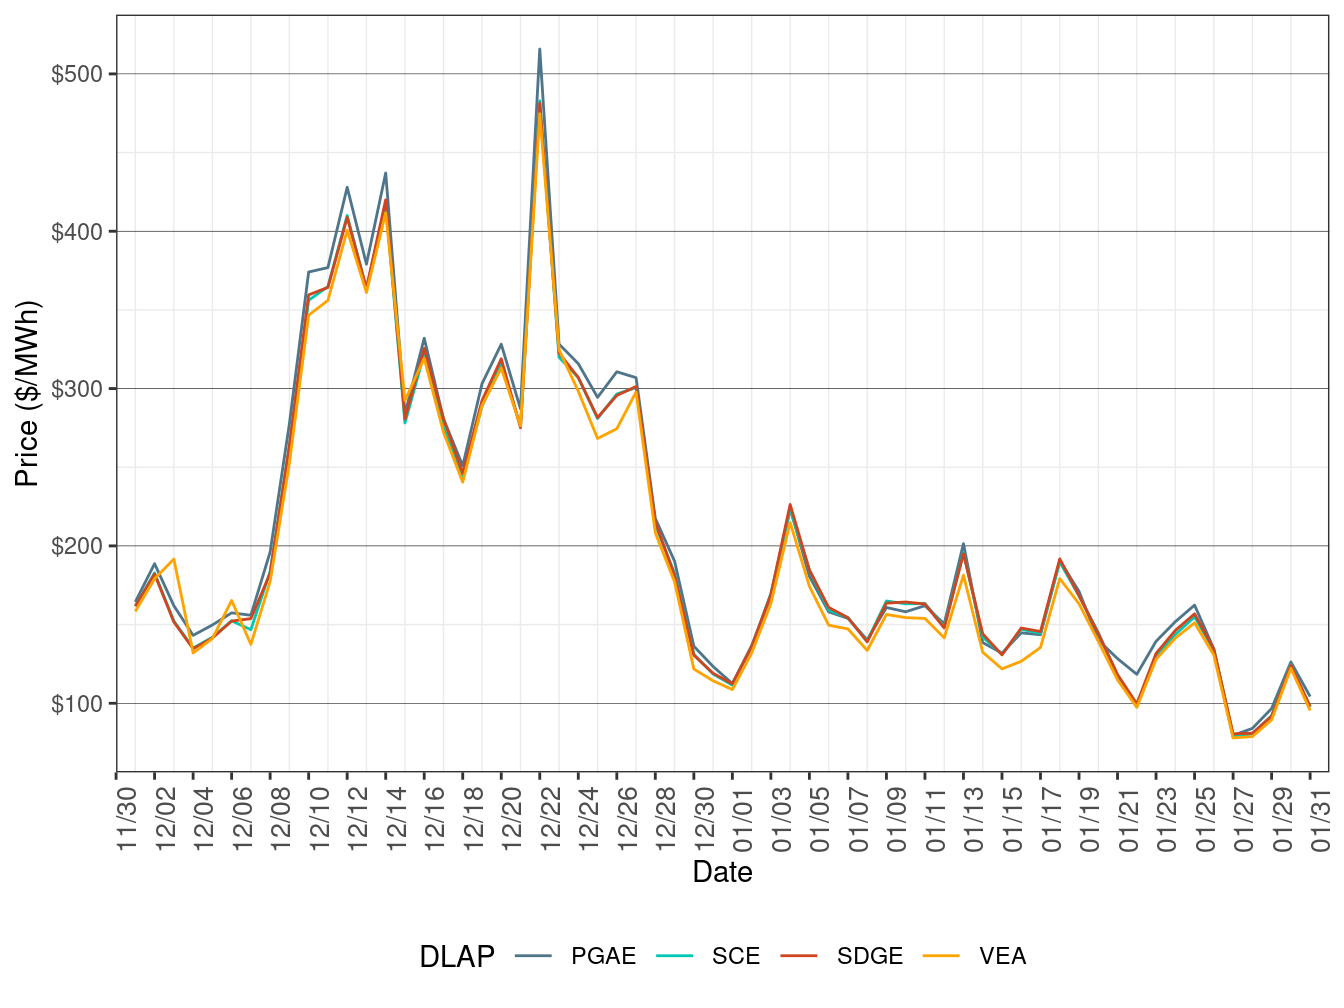
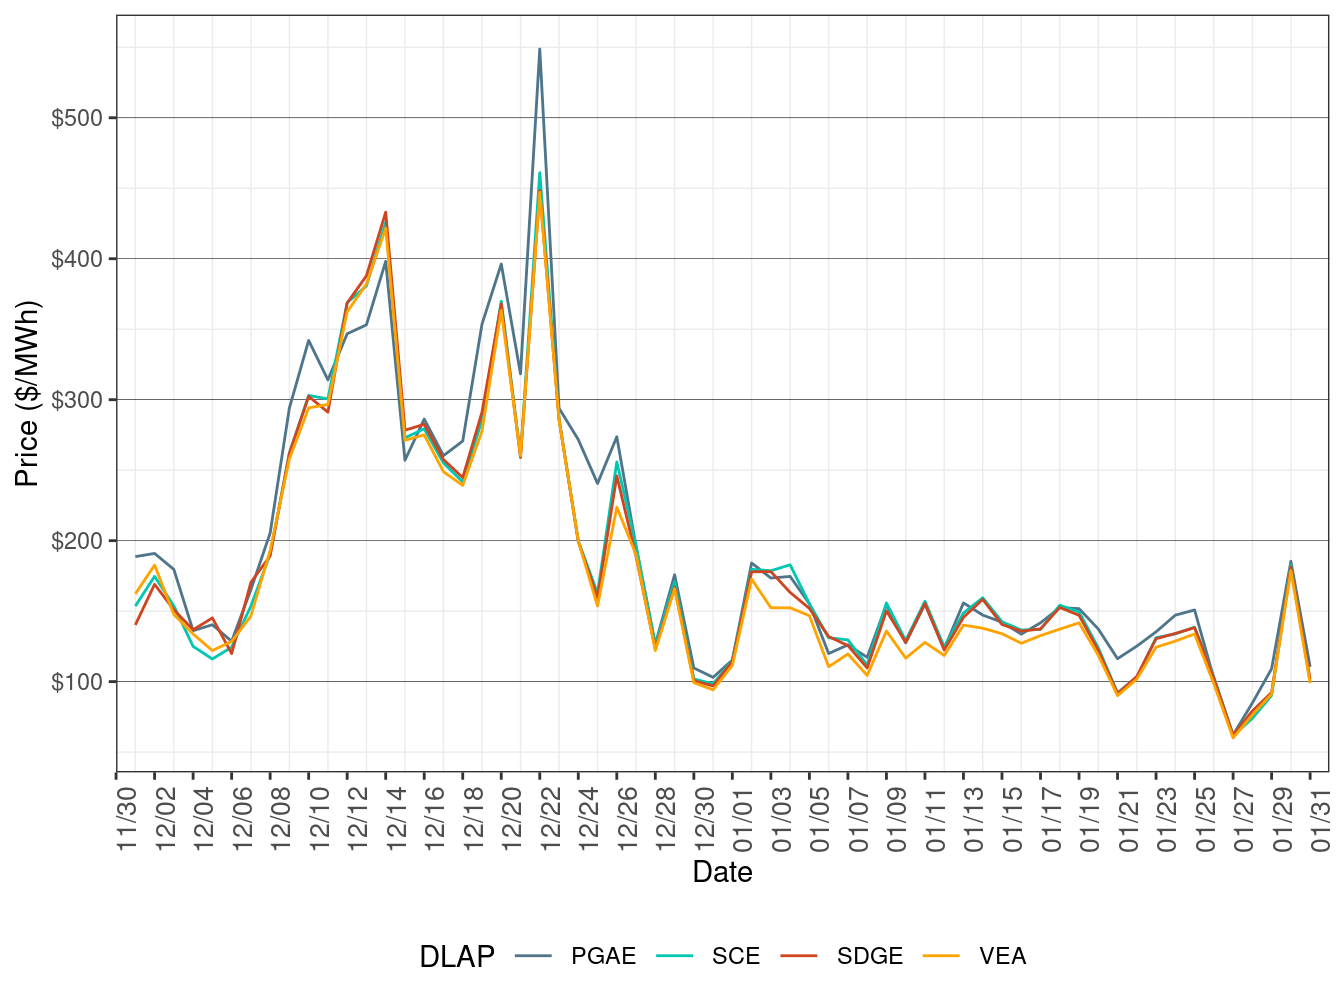
Figure 2 shows the daily simple average load-aggregation points (LAP) prices for each of the four default LAPs (PG&E, SCE, SDG&E, and VEA) for all hours. TABLE 2 below lists the binding constraints along with the associated DLAP locations and the dates when the binding constraints resulted in relatively high or low DLAP prices. All four DLAP LMPs fell in January from the highs in December and declined through January driven by declining natural gas prices.
Figure 2: Day-Ahead Simple Average LAP Prices (All Hours)
| DLAP | Dates | Transmission Constraint |
|---|---|---|
| PGAE | January 21-22 | PANOCHE-GATES-230kV line |
Real-Time Price
Figure 3 shows daily simple average LAP prices for all the default LAPs (PG&E, SCE, SDG&E, and VEA) for all hours respectively in FMM. TABLE 3 lists the binding constraints along with the associated DLAP locations and the dates when the binding constraints resulted in relatively high or low DLAP prices. All four DLAP prices fell back in January from the highs of December due to the drop in natural gas prices.
Figure 3: FMM Simple Average LAP Prices (All Hours)
| DLAP | Dates | Transmission Constraint |
|---|---|---|
| PGAE | January 21-22 | PANOCHE-GATES-230kV line |
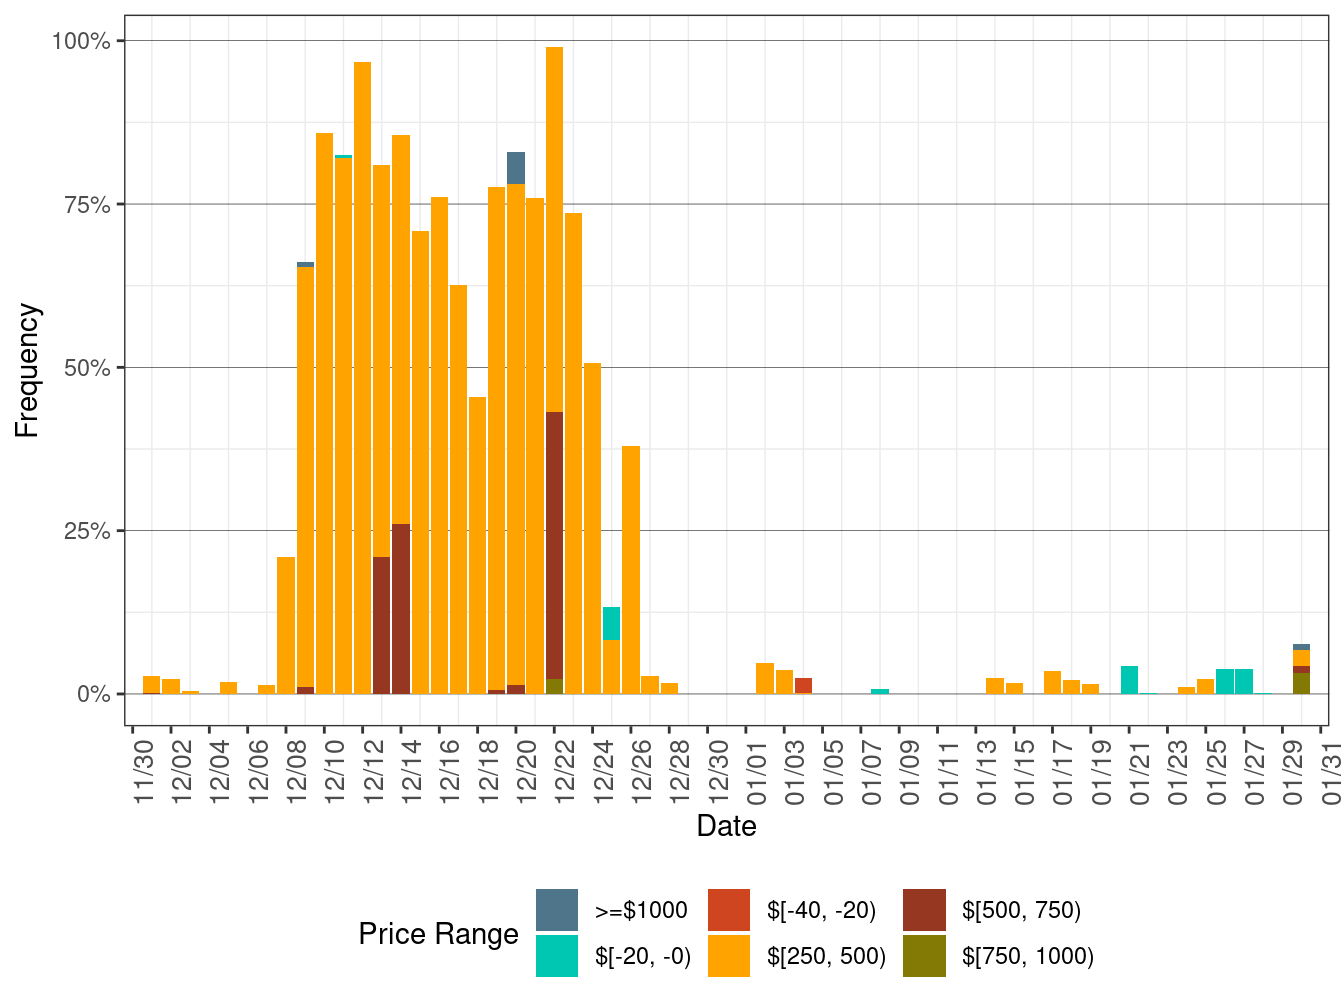
Figure 4 below shows the daily frequency of positive price spikes and negative prices by price range for the default LAPs in the FMM. The cumulative frequency of prices above $250/MWh decreased to 1.34 percent in January from 43.23 percent in December due to falling natural gas prices. The cumulative frequency of negative prices fell to 0.09 percent in January from 0.13 percent in December.
Figure 4: Daily Frequency of FMM LAP Positive Price Spikes and Negative Prices
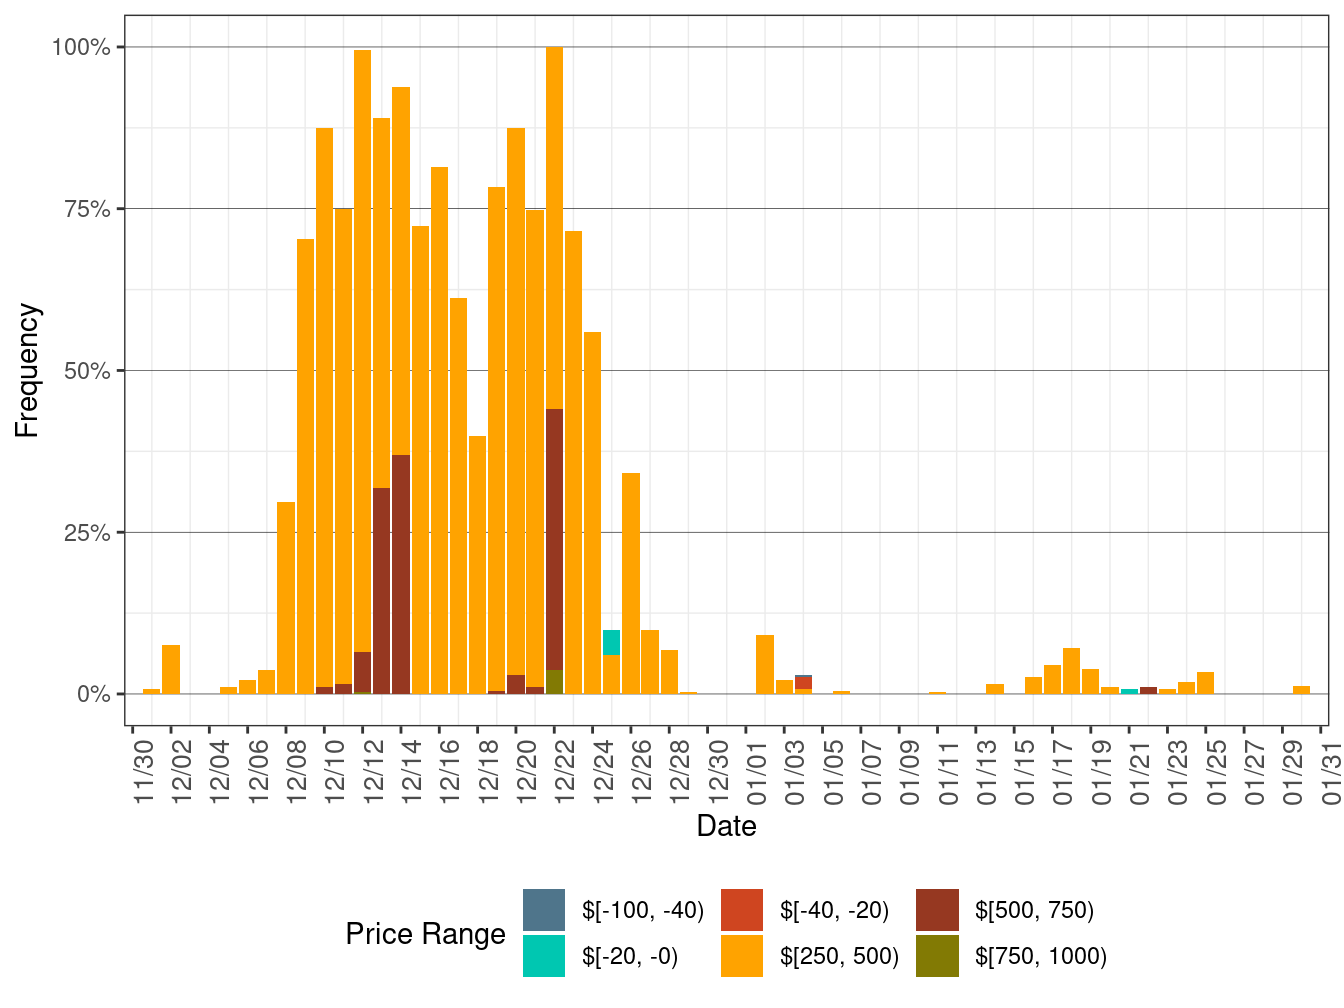
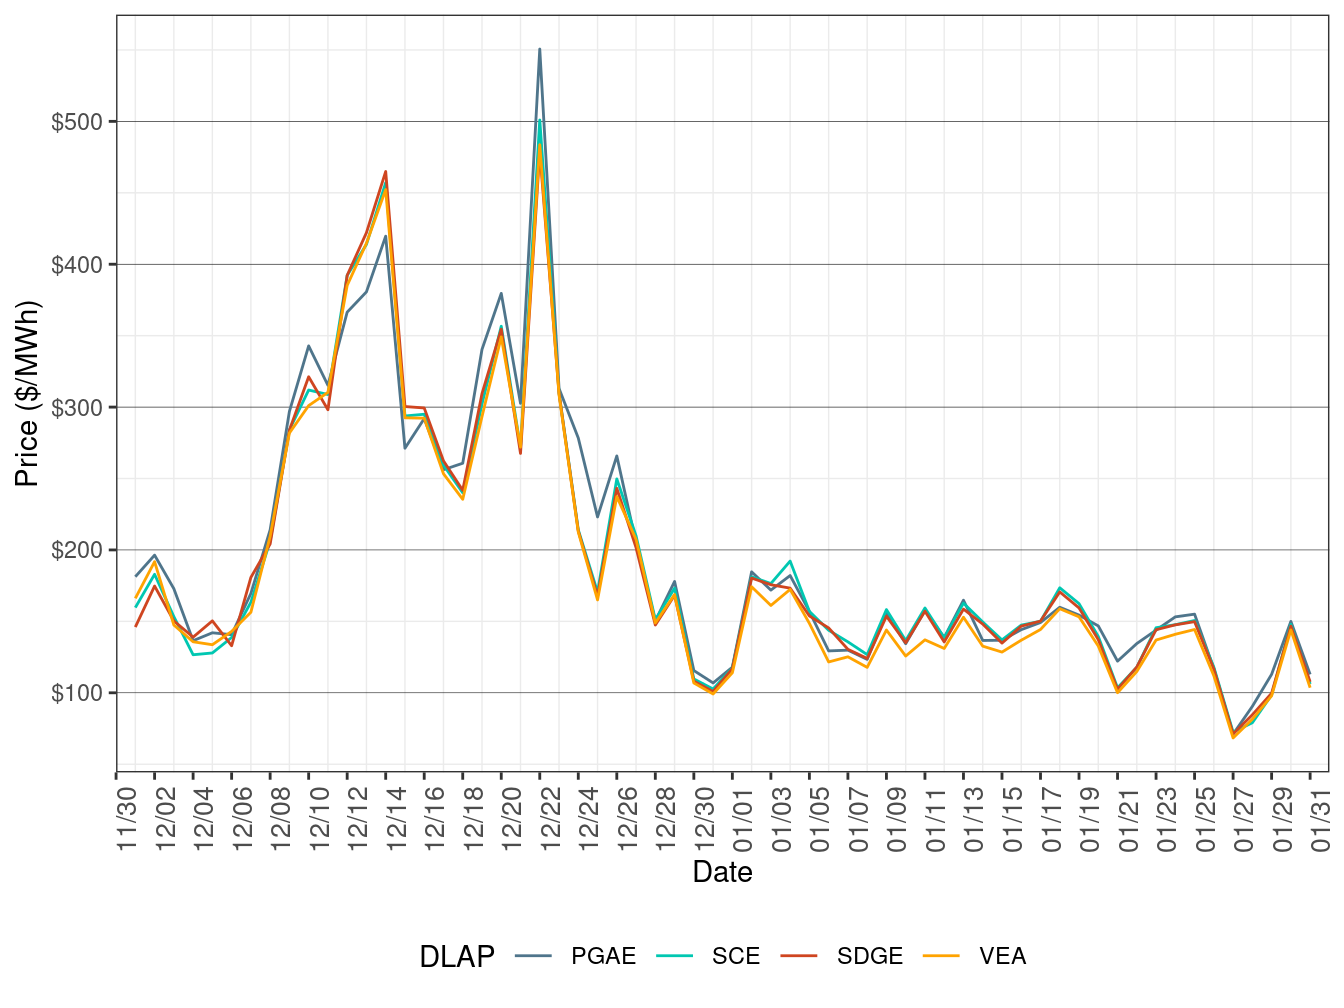
Figure 5 shows daily simple average LAP prices for all the default LAPs (PG&E, SCE, SDG&E, and VEA) for all hours respectively in RTD. TABLE 4 lists the binding constraints along with the associated DLAP locations and the dates when the binding constraints resulted in relatively high or low DLAP prices. In January, all four DLAP prices dropped from their December highs due to lower natural gas prices.
Figure 5: RTD Simple Average LAP Prices (All Hours)
| DLAP | Dates | Transmission Constraint |
|---|---|---|
| PGAE | January 21-22 | PANOCHE-GATES-230kV line |
Figure 6 below shows the daily frequency of positive price spikes and negative prices by price range for the default LAPs in RTD. The cumulative frequency of prices above $250/MWh fell to 0.99 percent in January from 41.69 percent in December due to falling natural gas prices. The cumulative frequency of negative prices rose to 0.49 percent in January from 0.17 percent in December.
Figure 6: Daily Frequency of RTD LAP Positive Price Spikes and Negative Prices