3 Market Performance Metrics
Day-Ahead Prices
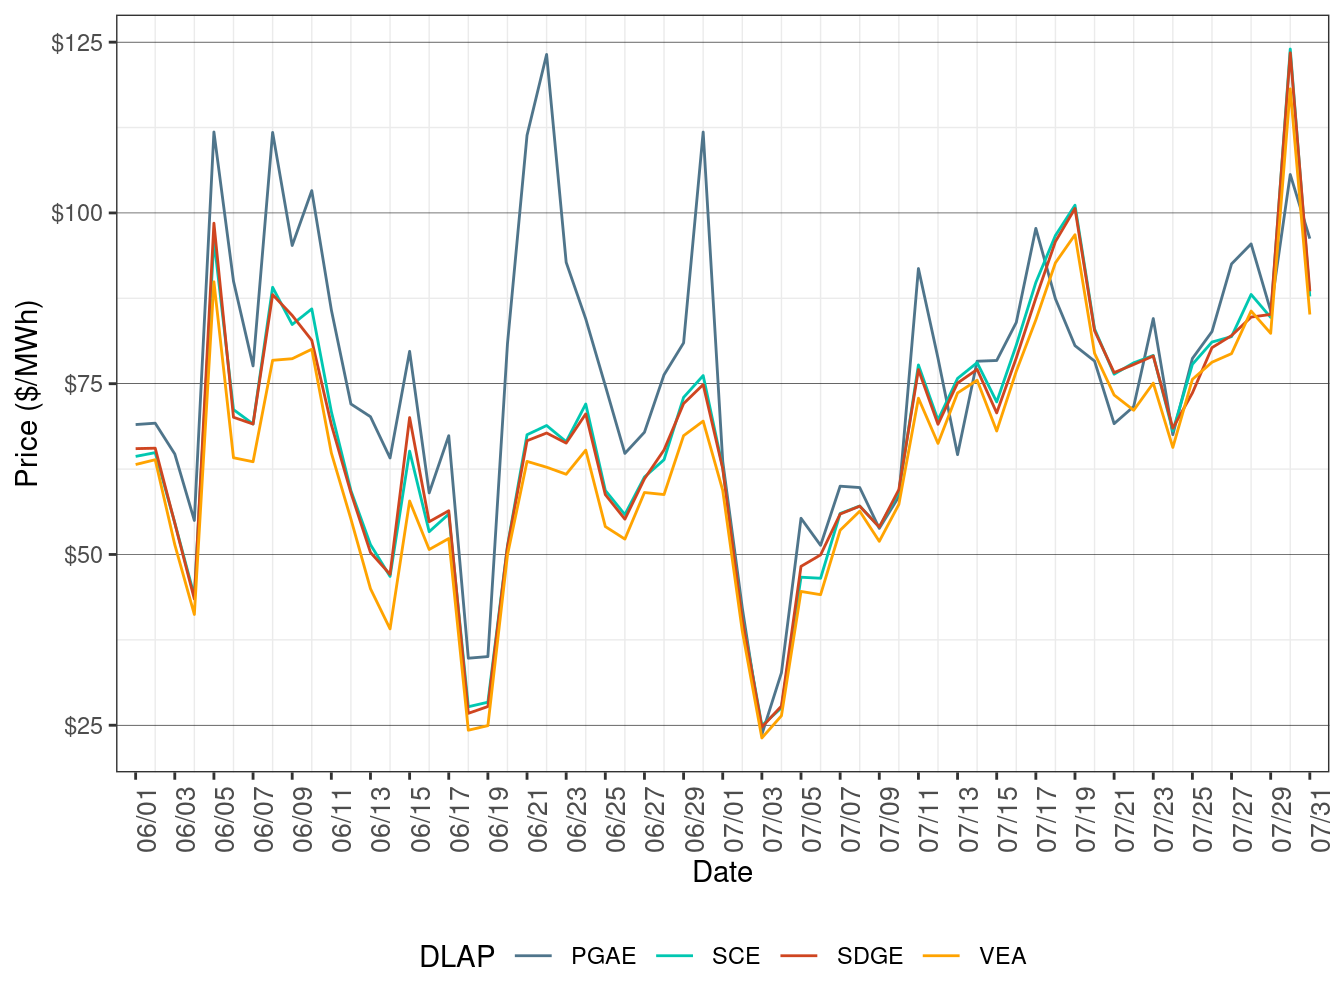
Figure 2 show the daily simple average load-aggregation points (LAP) prices for each of the four default LAPs (PG&E, SCE, SDG&E, and VEA) for all hours. Table 2 below lists the binding constraints along with the associated DLAP locations and the dates when the binding constraints resulted in relatively high or low DLAP prices.
Figure 2: Day-Ahead Simple Average LAP Prices (All Hours)
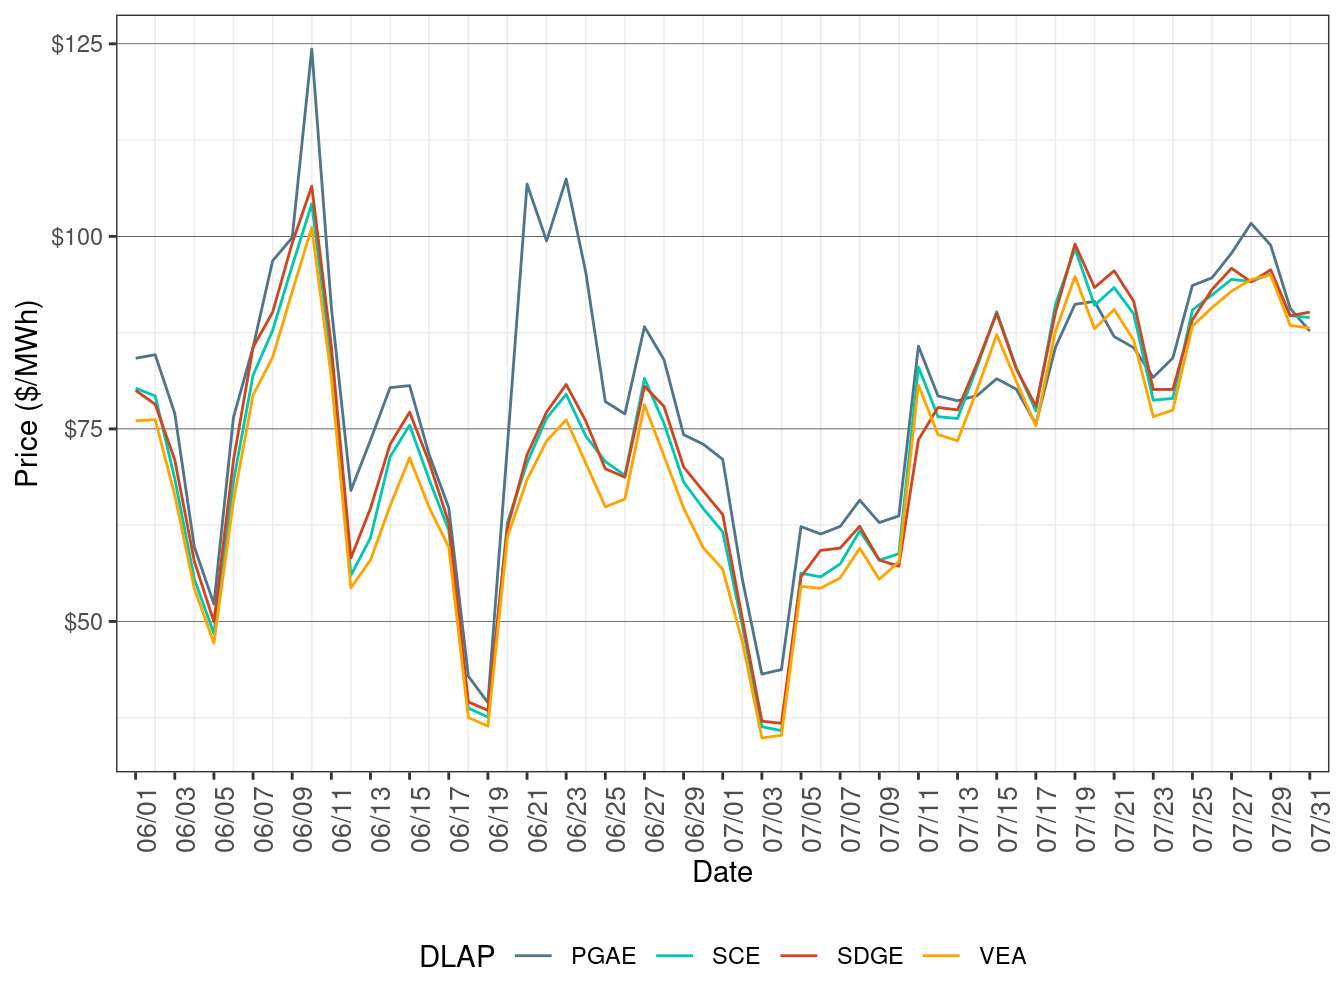
| DLAP | Dates | Transmission Constraint |
|---|---|---|
| PGAE | July 28-29 | GATES1-GATES-500 kV XFMR |
Real-Time Price
Figure 3 show daily simple average LAP prices for all the default LAPs (PG&E, SCE, SDG&E, and VEA) for all hours respectively in FMM. Table 3 lists the binding constraints along with the associated DLAP locations and the dates when the binding constraints resulted in relatively high or low DLAP prices.
Figure 3: FMM Simple Average LAP Prices (All Hours)
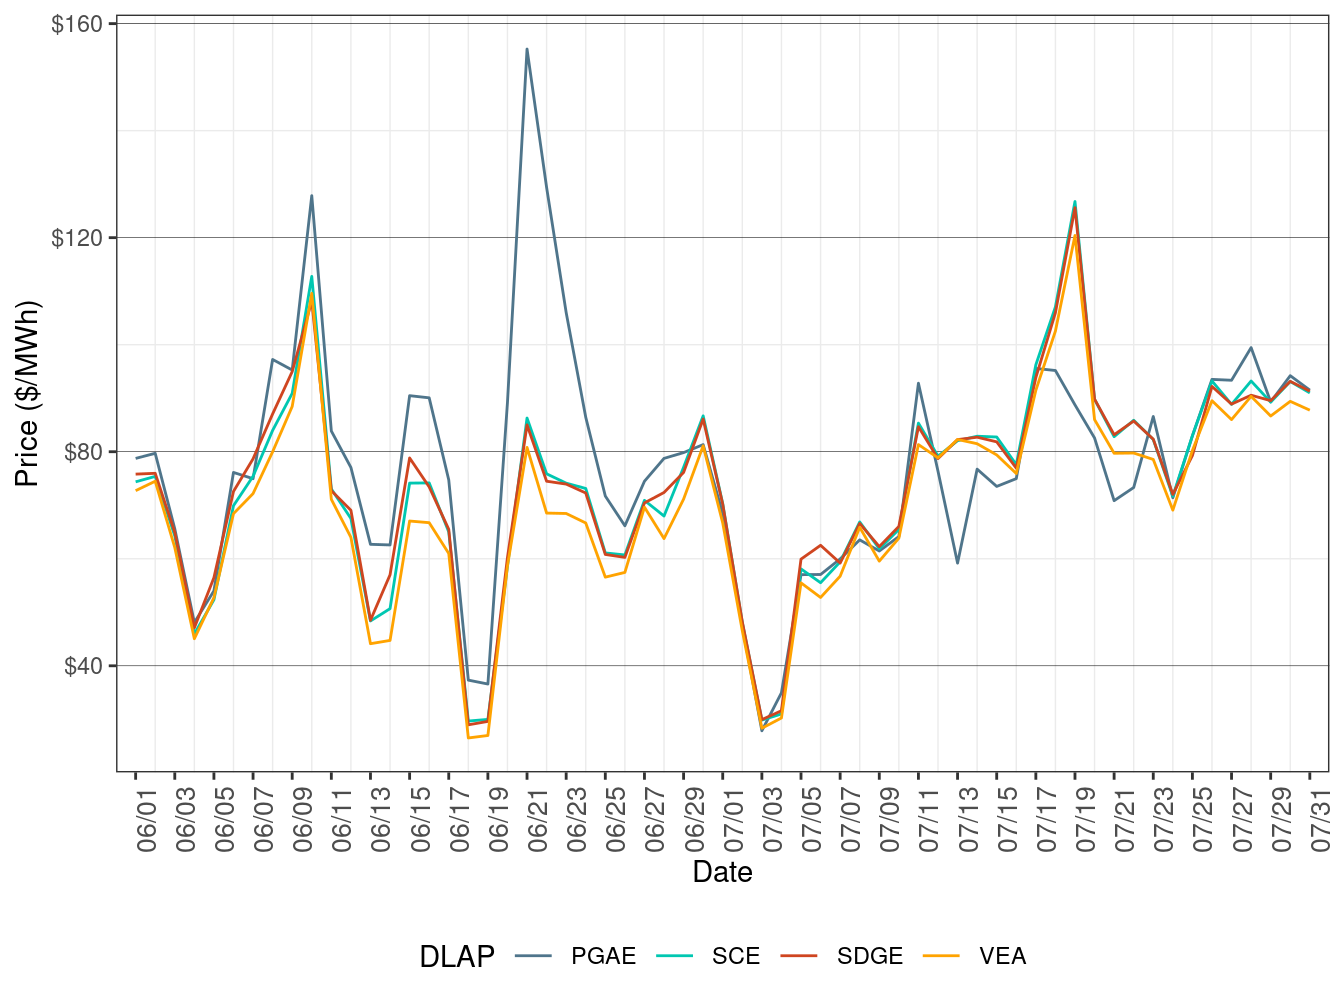
| DLAP | Dates | Transmission Constraint |
|---|---|---|
| SCE, SDGE, VEA | July 18 | 6410_CP1_NG |
| SCE, SDGE, VEA | July 19 | LDWP_IPP_NORTH_EA |
Figure 4 below shows the daily frequency of positive price spikes and negative prices by price range for the default LAPs in the FMM. The cumulative frequency of prices above $250/MWh decreased to 0.50 percent in July from 0.89 percent in June. The cumulative frequency of negative prices dropped to 0.13 percent in July from 5.72 percent in June.
Figure 4: Daily Frequency of FMM LAP Positive Price Spikes and Negative Prices
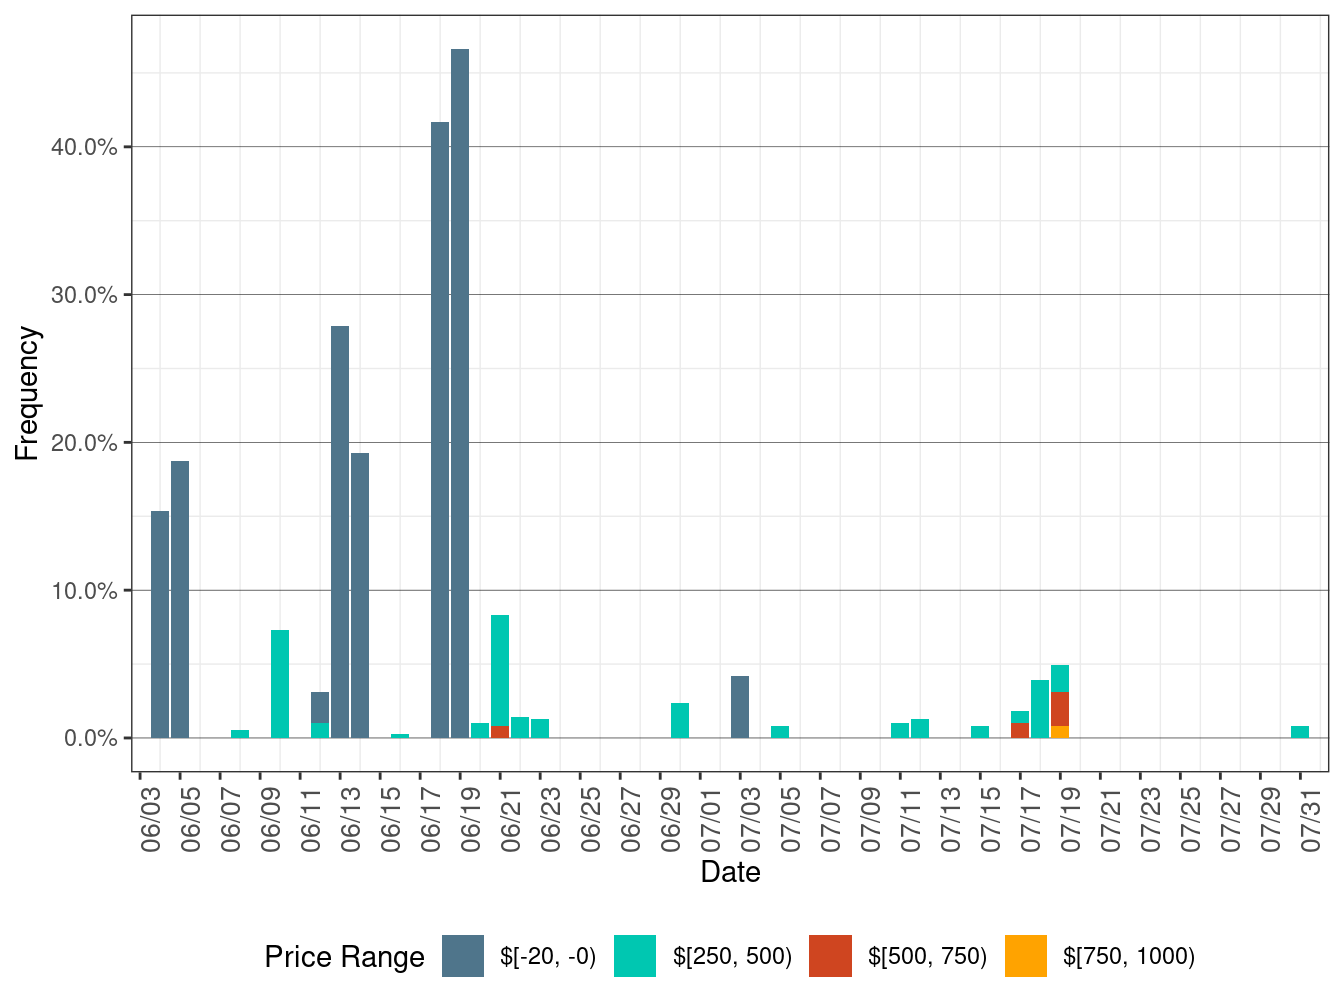
Figure 5 show daily simple average LAP prices for all the default LAPs (PG&E, SCE, SDG&E, and VEA) for all hours respectively in RTD. TABLE 4 lists the binding constraints along with the associated DLAP locations and the dates when the binding constraints resulted in relatively high or low DLAP prices.
Figure 5: RTD Simple Average LAP Prices (All Hours)
| DLAP | Dates | Transmission Constraint |
|---|---|---|
| PGAE | July 11 | 7440_MetcalfImport_Tes-Metcalf nomogram, 6110_COI_N_S nomogram, GATES1-GATES 500 kV XFMR |
| SCE, SDGE, VEA | July 30 | MIDWAY-VINCENT 500 kV line |
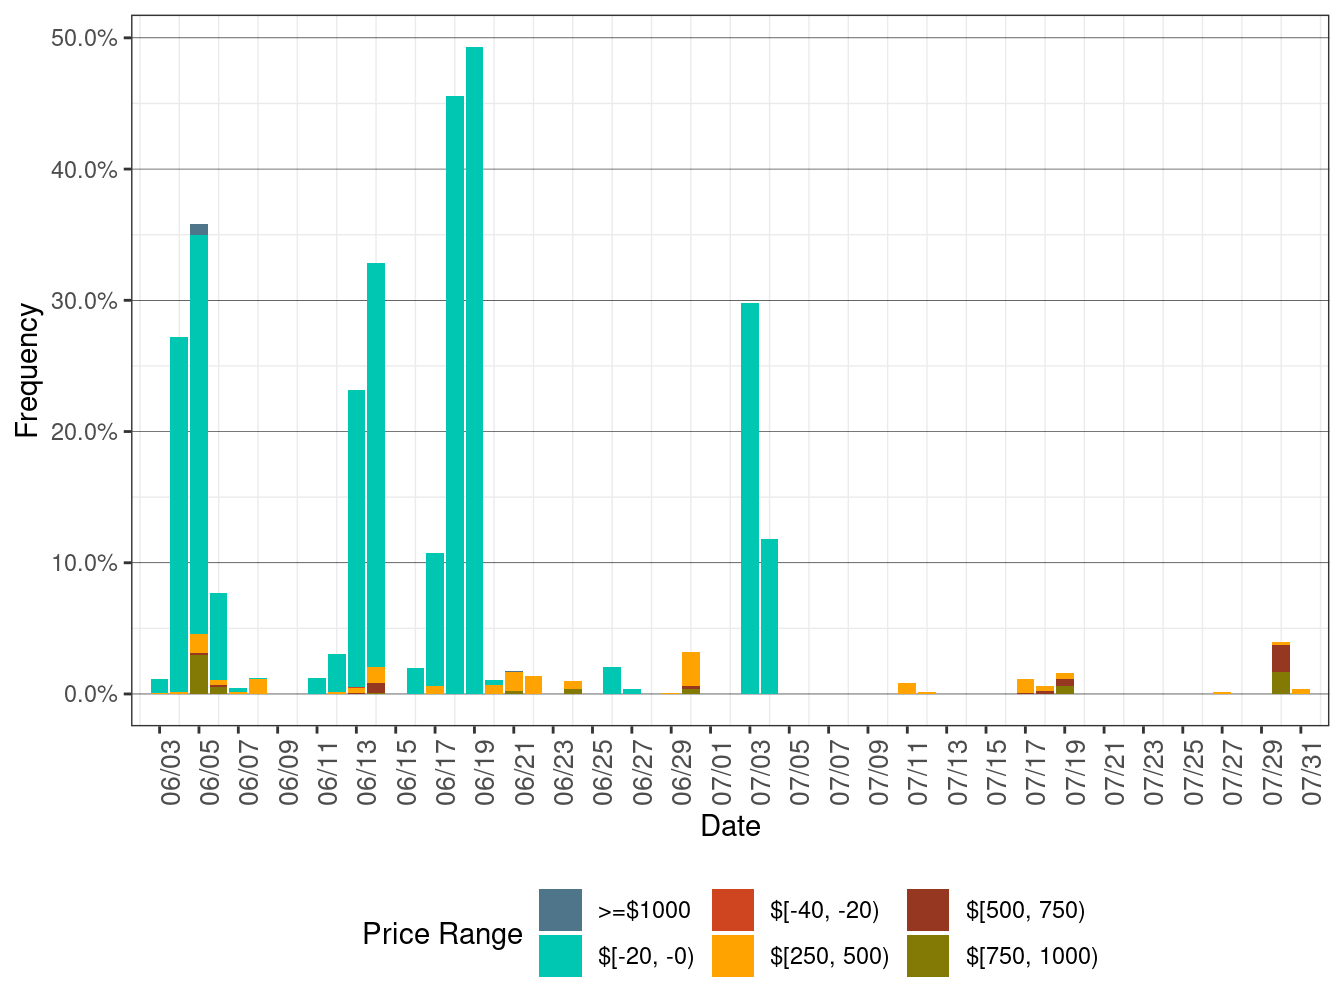
Figure 4 below shows the daily frequency of positive price spikes and negative prices by price range for the default LAPs in RTD. The cumulative frequency of prices above $250/MWh fell to 0.31 percent in July from 0.70 percent in June. The cumulative frequency of negative prices decreased to 1.34 percent in July from 7.76 percent in June.
Figure 6: Daily Frequency of RTD LAP Positive Price Spikes and Negative Prices