3 Market Performance Metrics
Day-Ahead Prices
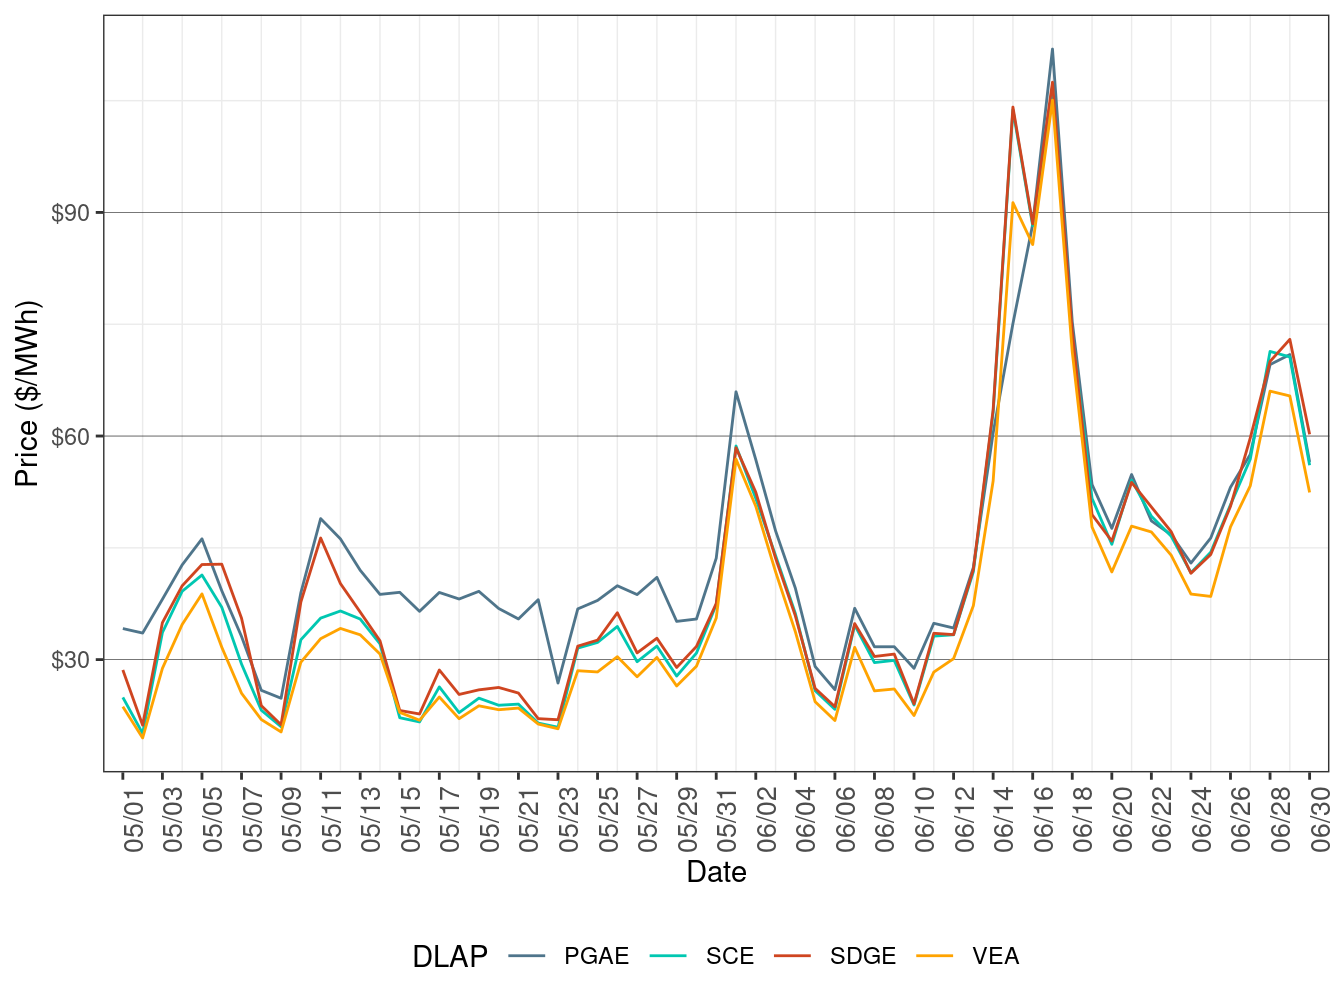
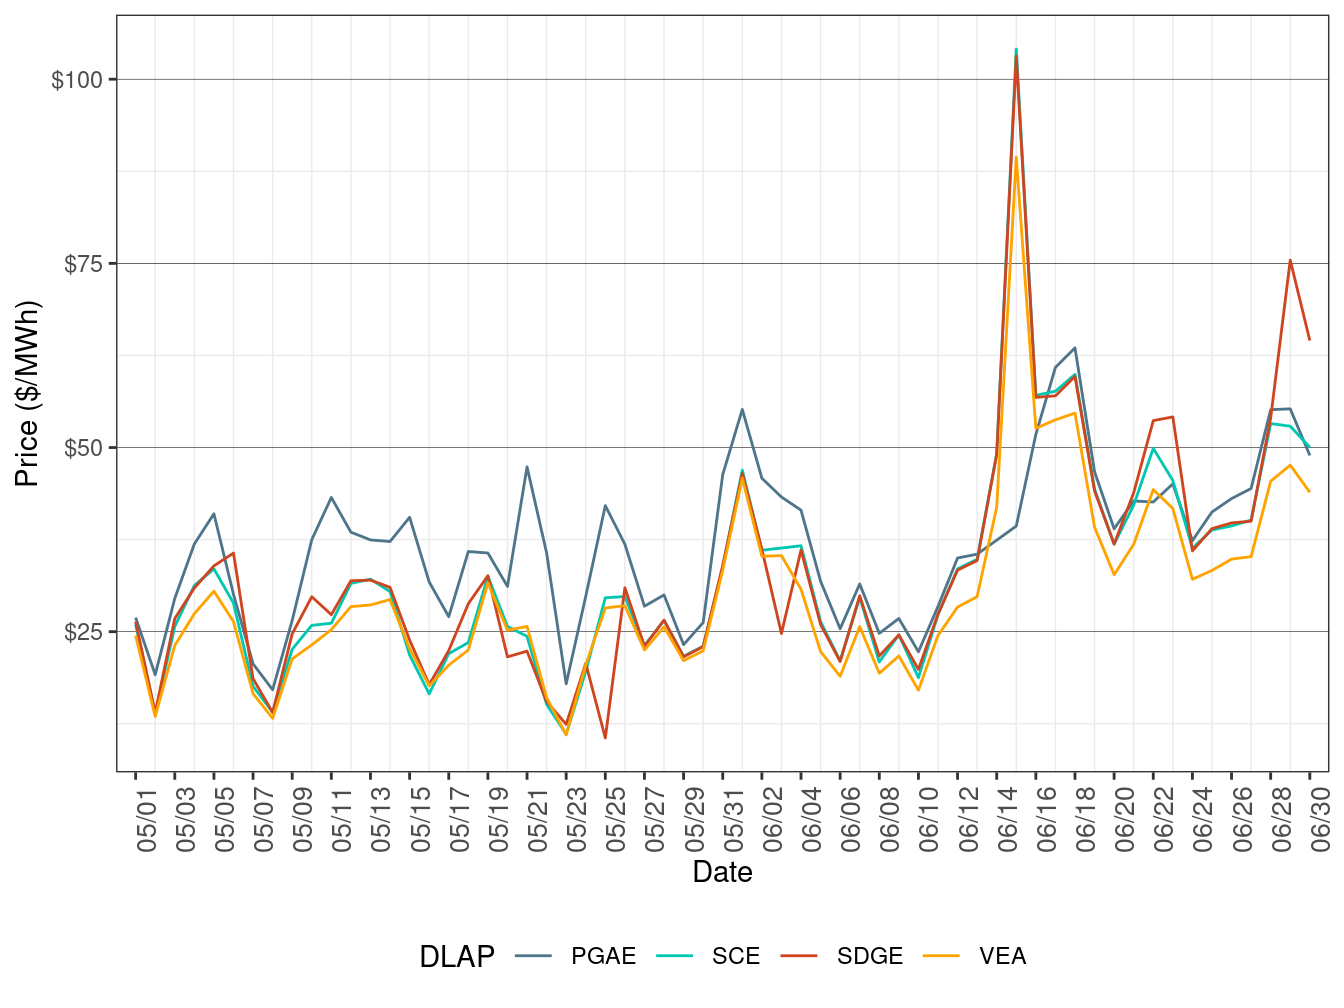
Figure 2 show the daily simple average load-aggregation points (LAP) prices for each of the four default LAPs (PG&E, SCE, SDG&E, and VEA) for all hours. TABLE 2 below lists the binding constraints along with the associated DLAP locations and the dates when the binding constraints resulted in relatively high or low DLAP prices. On June 15-18, all four DLAP LMPs were elevated due to high load demand driven by the heat wave.
Figure 2: Day-Ahead Simple Average LAP Prices (All Hours)
| DLAP | Dates | Transmission Constraint |
|---|---|---|
| PGAE | June 1 | Q0577SS-LOSBANOS-230 kV line |
| SCE, SDGE, VEA | June 15 | MIDWAY-VINCENT 500 kV line |
Real-Time Price
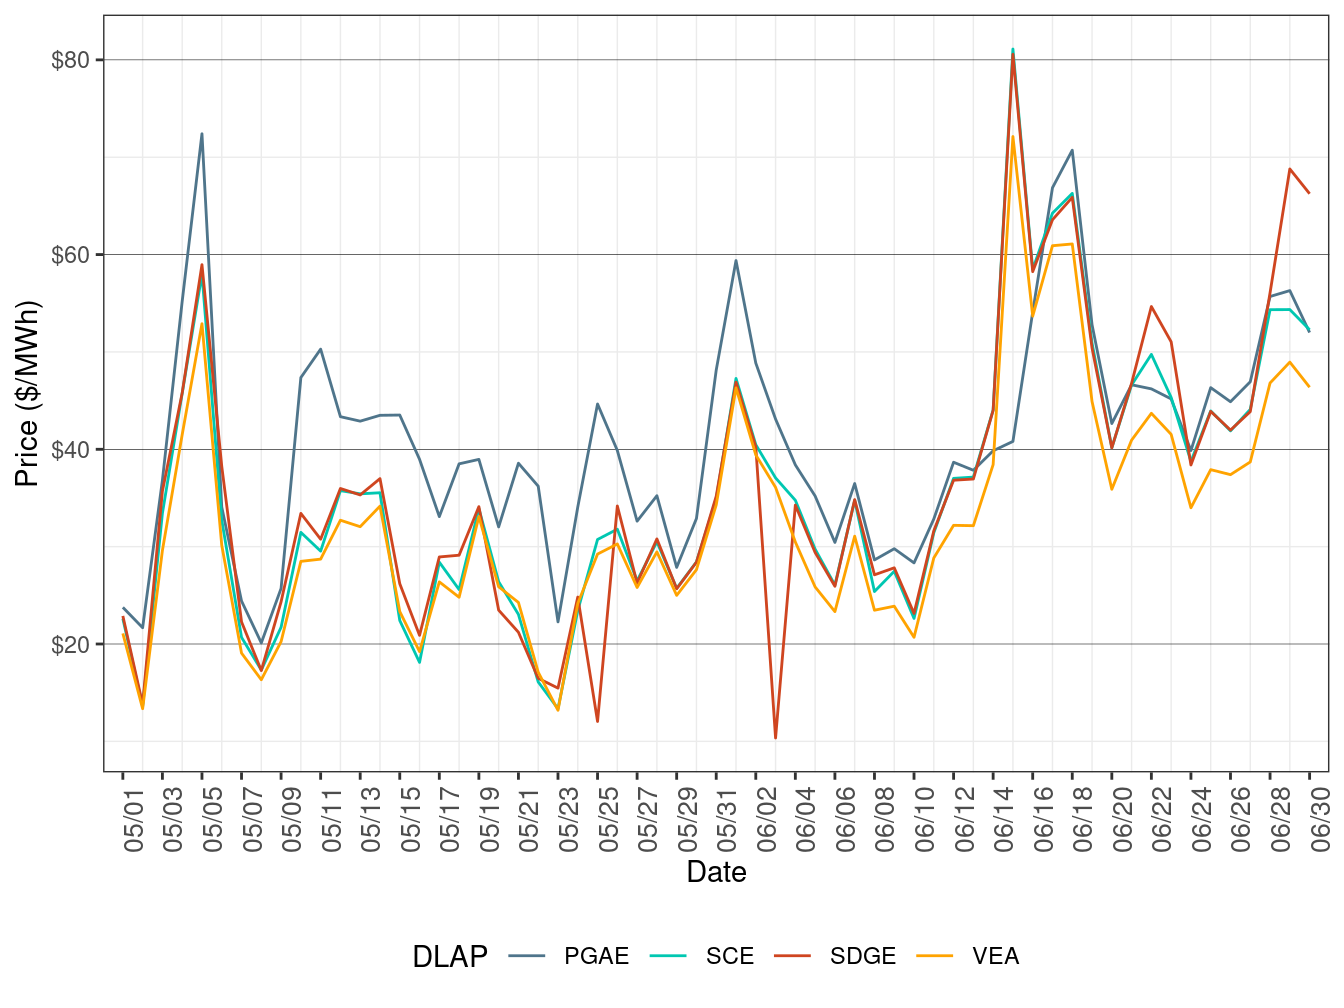
Figure 3 show daily simple average LAP prices for all the default LAPs (PG&E, SCE, SDG&E, and VEA) for all hours respectively in FMM. TABLE 3 lists the binding constraints along with the associated DLAP locations and the dates when the binding constraints resulted in relatively high or low DLAP prices.
Figure 3: FMM Simple Average LAP Prices (All Hours)
| DLAP | Dates | Transmission Constraint |
|---|---|---|
| PGAE | June 1 | MUSTANGS-GATES MT 230 kV line, Q0577SS-LOSBANOS 230 kV line |
| SDGE | June 3 | MELRSETP-SANMRCOS 69 Kv line, ESCNDIDO-SANMRCOS 69 kV line |
| SCE, SDGE, VEA | June 15 | MIDWAY-VINCENT 500 kV line |
| SDGE | June 29-30 | OMS-10214484-ML_BK80_NG |
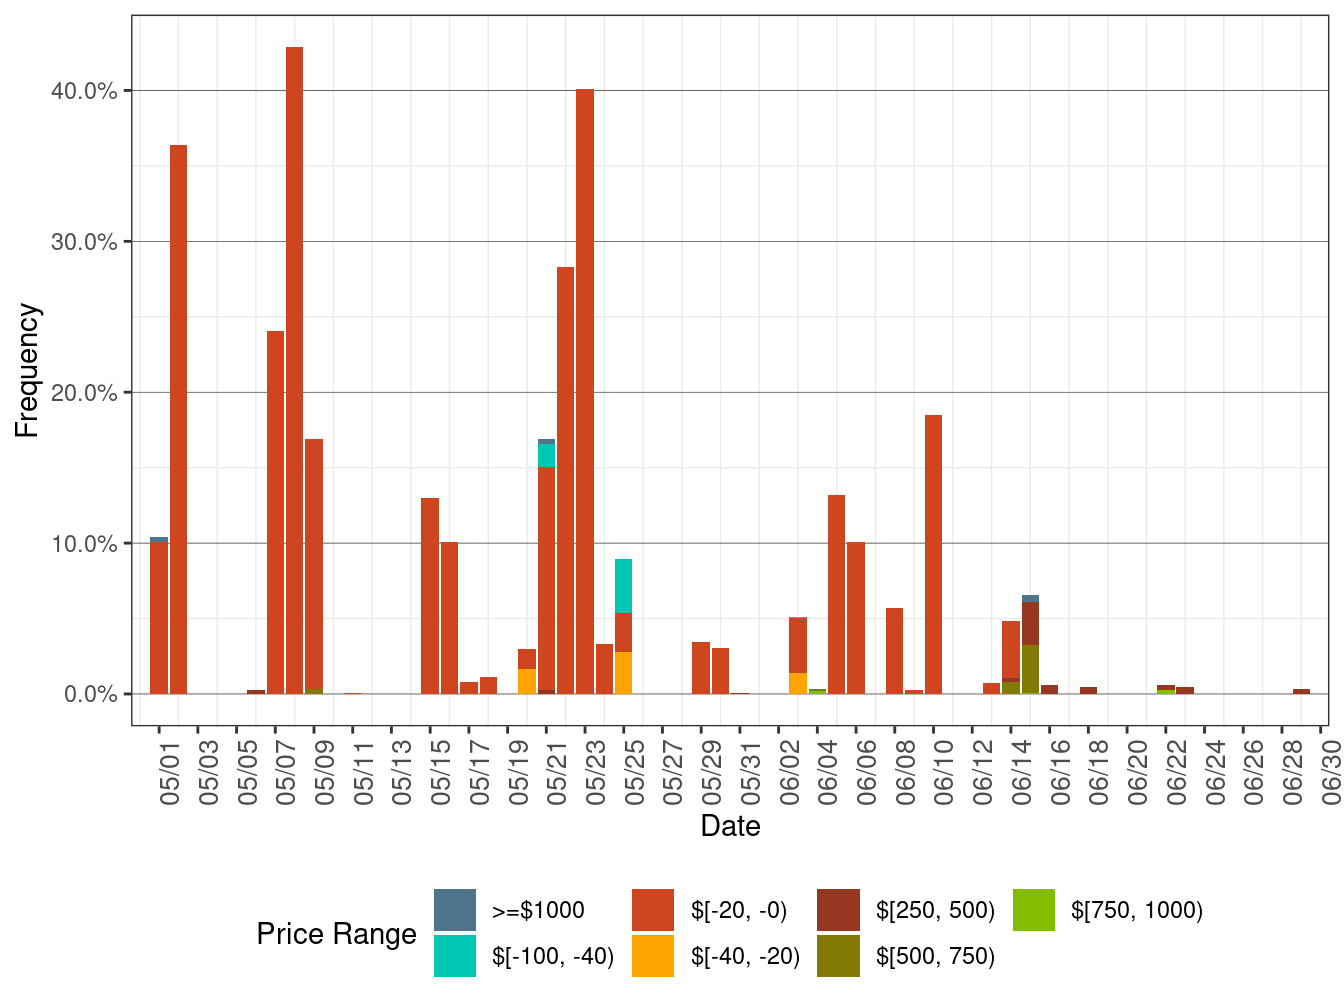
Figure 4 below shows the daily frequency of positive price spikes and negative prices by price range for the default LAPs in the FMM. The cumulative frequency of prices above $250/MWh slipped to 0.18 percent in June from 0.36 percent in May. The cumulative frequency of negative prices fell to 0.89 percent in June from 6.79 percent in May.
Figure 4: Daily Frequency of FMM LAP Positive Price Spikes and Negative Prices
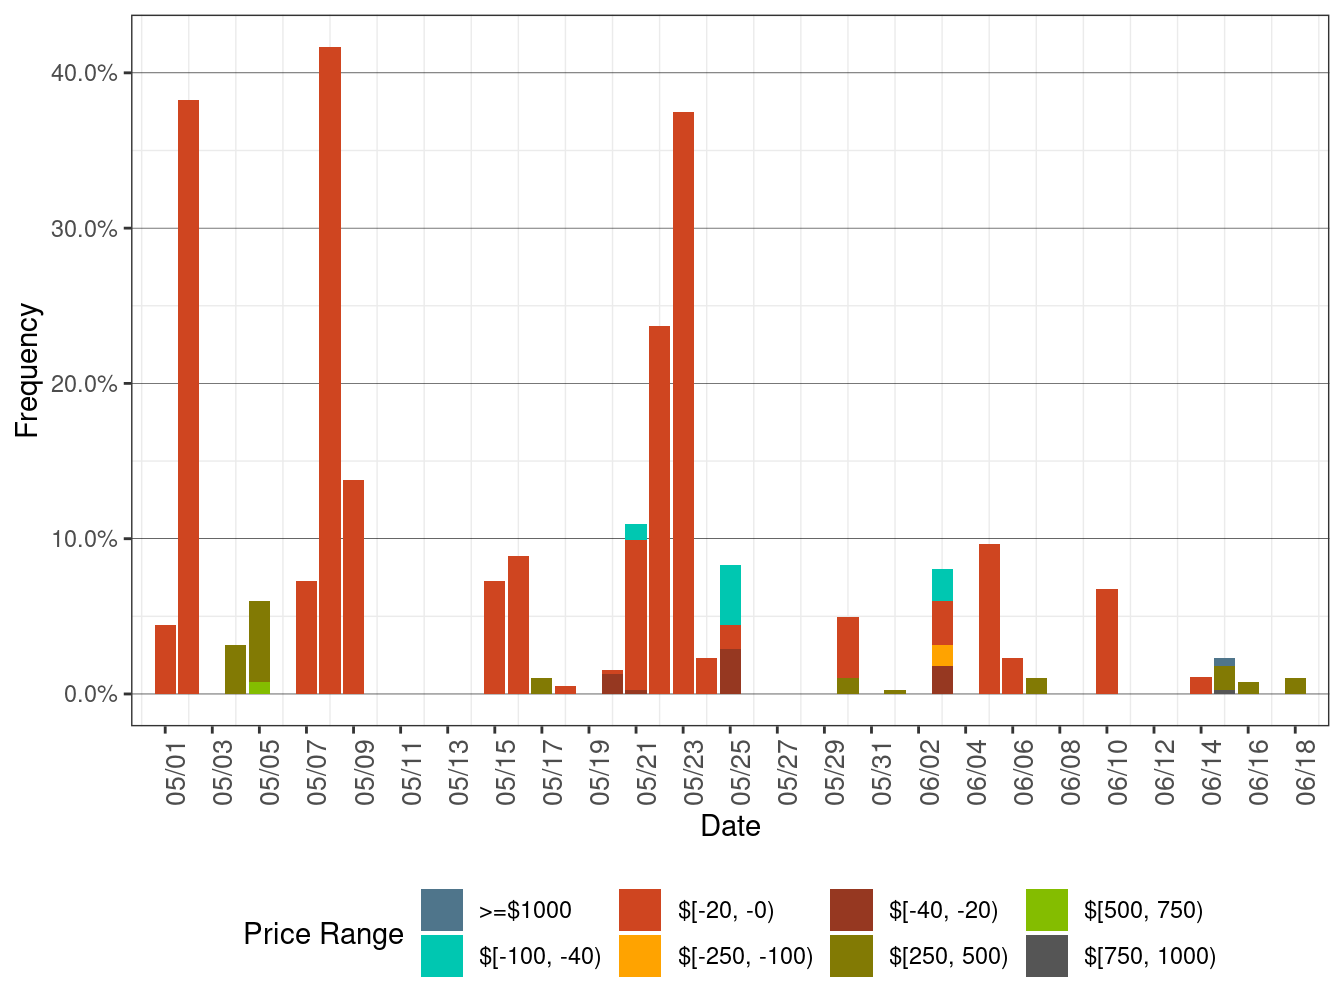
Figure 5 show daily simple average LAP prices for all the default LAPs (PG&E, SCE, SDG&E, and VEA) for all hours respectively in RTD. TABLE 4 lists the binding constraints along with the associated DLAP locations and the dates when the binding constraints resulted in relatively high or low DLAP prices.
Figure 5: RTD Simple Average LAP Prices (All Hours)
| DLAP | Dates | Transmission Constraint |
|---|---|---|
| SCE, SDGE, VEA | June 15 | MIDWAY-VINCENT 500 kV line |
| SDGE | June 29-30 | OMS-10214484-ML_BK80_NG |
Figure 4 below shows the daily frequency of positive price spikes and negative prices by price range for the default LAPs in RTD. The cumulative frequency of prices above $250/MWh increased to 0.35 percent in June from 0.05 percent in May. The cumulative frequency of negative prices skidded to 1.78 percent in June from 8.44 percent in May.
Figure 6: Daily Frequency of RTD LAP Positive Price Spikes and Negative Prices