3 Market Performance Metrics
Day-Ahead Prices
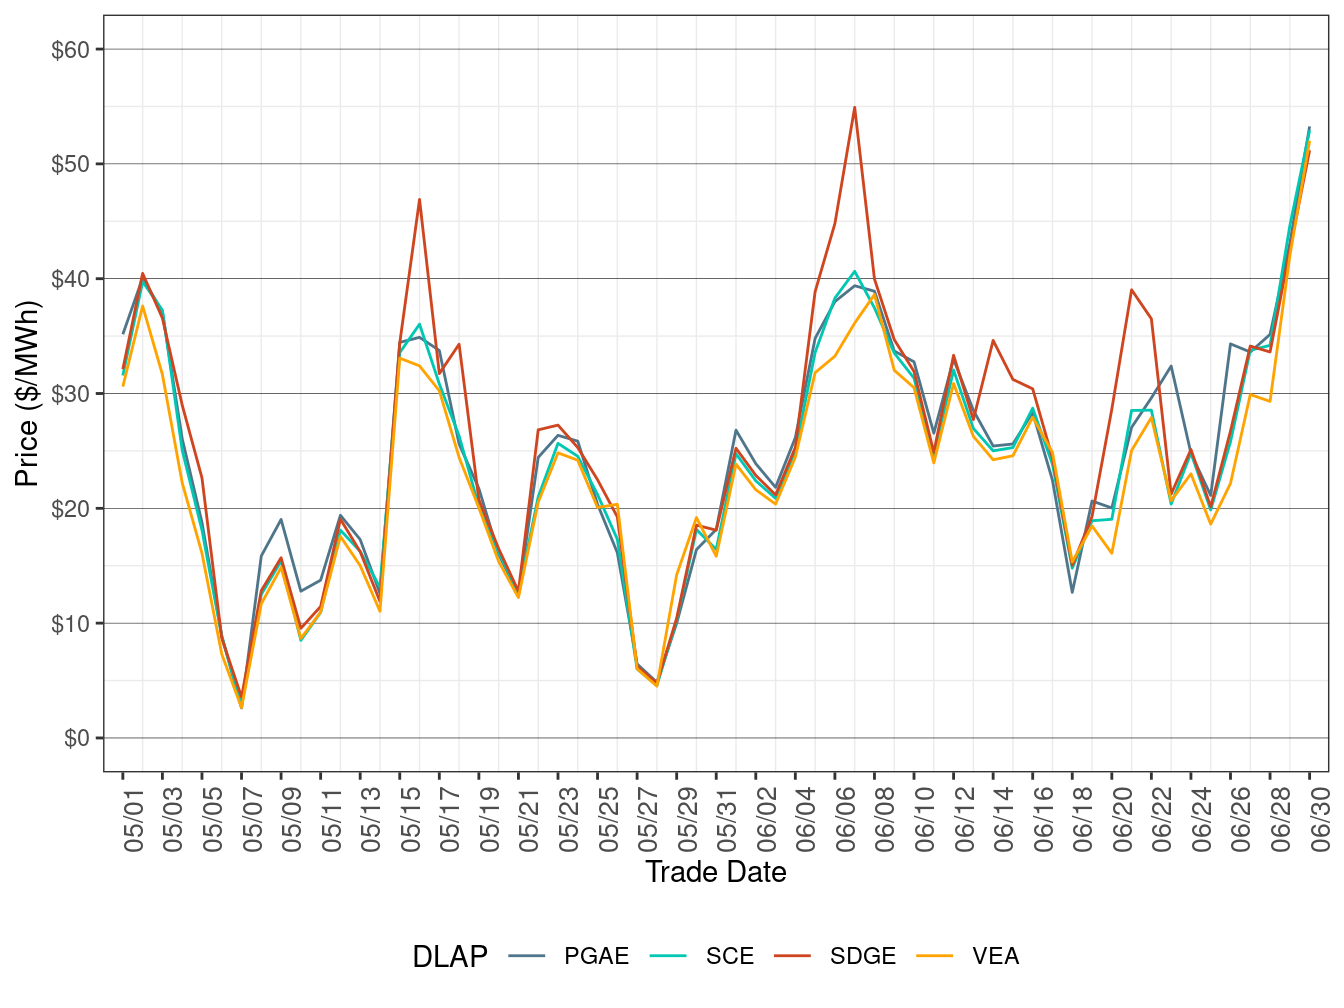
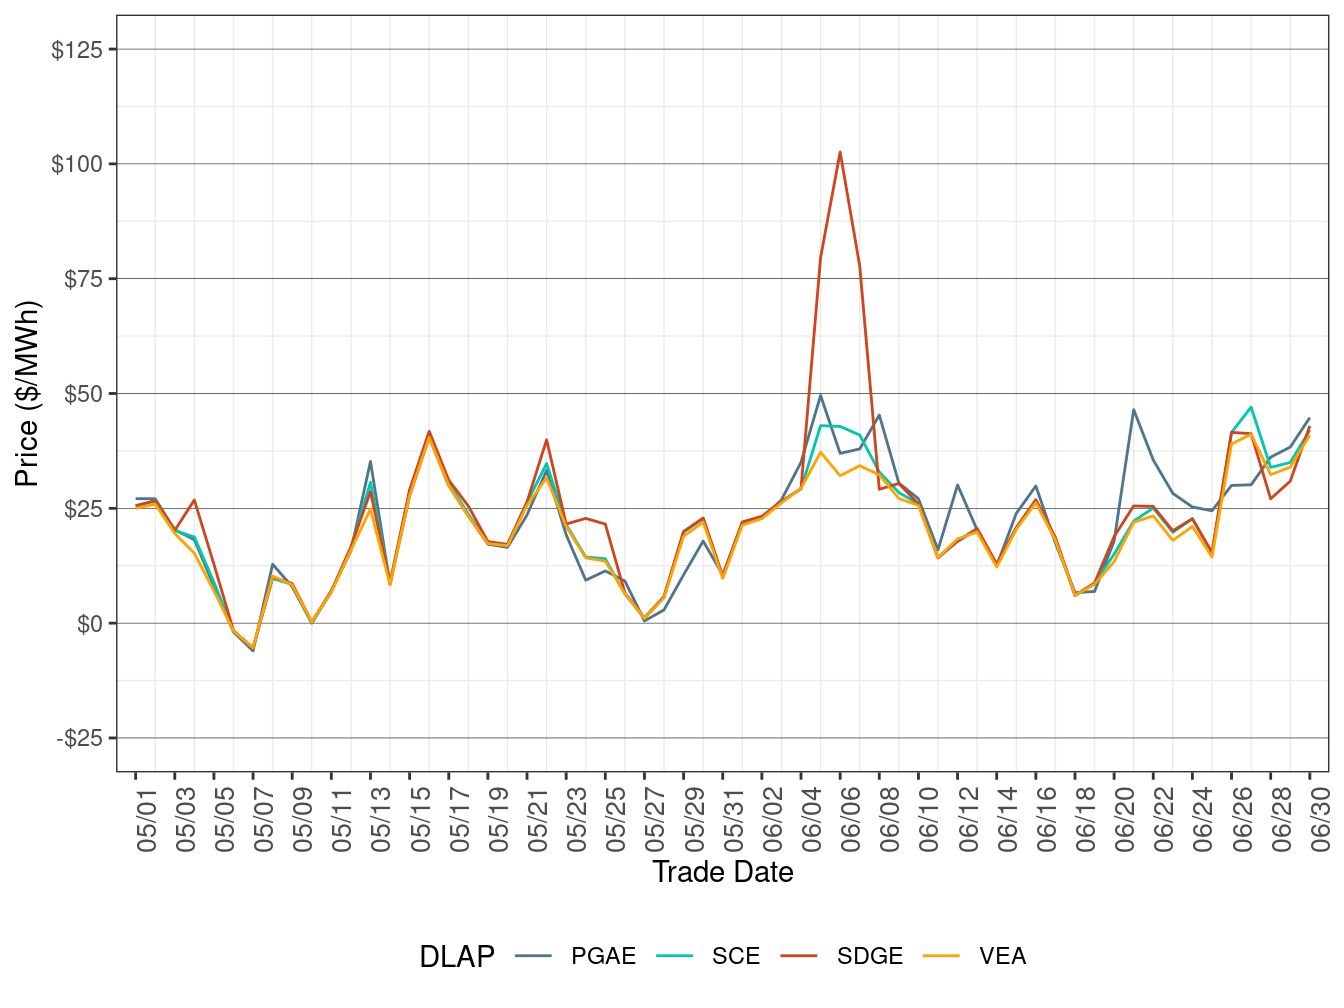
Figure 2 shows the daily simple average prices for all hours in IFM for each of the four default load-aggregation points (DLAP): PG&E, SCE, SDG&E, and VEA.
Day-Ahead DLAP prices on average increased compared to the previous month, correlated with rising temperatures and natural gas prices, including a heat event at the end of June.
TABLE 3 below lists the binding constraints that resulted in relatively high or low DLAP prices on certain dates.
Figure 2: IFM (Day-Ahead) Simple Average DLAP Prices (All Hours)
| DLAP LMPs Affected | Dates | Transmission Constraint |
|---|---|---|
| SDGE | June 5-7 | SUNCREST-SUNCREST-230 XFMR; OMS-13368679_50001_OOS_NG nomogram |
| SDGE | June 14-15 | MOSSLD-LASAGUIL 230kV line; SWEETWTR-MIGUELTP 69KV line |
| SDGE | June 20-22 | MIGUEL_BKs_MXFLW_NG nomogram; MOSSLD-LASAGUIL 230kV line; LOSBANOS-GATES1-500kV line; MIDWAY-VINCENT-500kV line |
Real-Time Price
Figure 3 shows daily simple average prices for all four DLAPs (PG&E, SCE, SDG&E, and VEA) for all hours respectively in FMM.
FMM DLAP prices on average increased compared to the previous month, correlated with rising temperatures and natural gas prices, including a heat event at the end of June.
TABLE 4 below lists the binding constraints that resulted in relatively high or low DLAP prices on certain dates.
Figure 3: FMM Simple Average DLAP Prices (All Hours)
| DLAP LMPs Affected | Dates | Transmission Constraint |
|---|---|---|
| SDGE | June 5-7 | OMS-13368679_50001_OOS_NG nomogram |
| PGAE | June 12 | GATES1-MIDWAY-500kV line; LOSBANOS-GATES1-500kV line |
| PGAE | June 21-25 | LOSBANOS-GATES1-500kV line; WIRLWIND-WIRLWIND-230 XFMR; GATES1-MIDWAY-500kV line; PANOCHE-GATES-230kV line |
Figure 4 below shows the daily frequency of positive price spikes and negative prices by price range for the DLAPs in the FMM.
The cumulative frequency of prices above $250/MWh decreased to 0 percent in June from 0.34 percent in the previous month, while the cumulative frequency of negative prices dropped to 6.75 percent in June from 15.52 percent in the previous month.
Figure 4: Daily Frequency of FMM DLAP Positive Price Spikes and Negative Prices
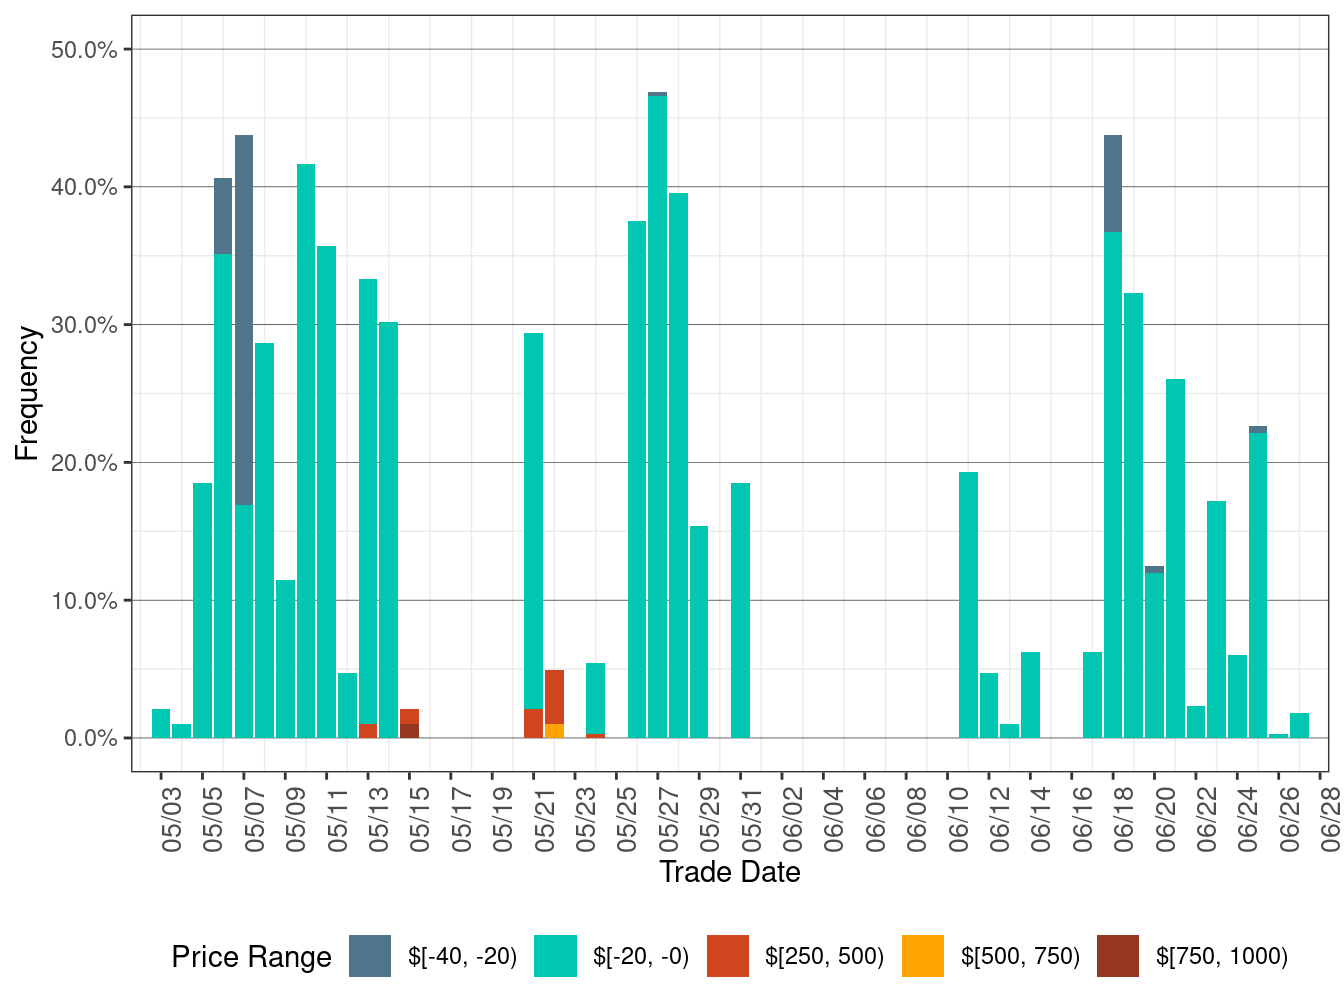
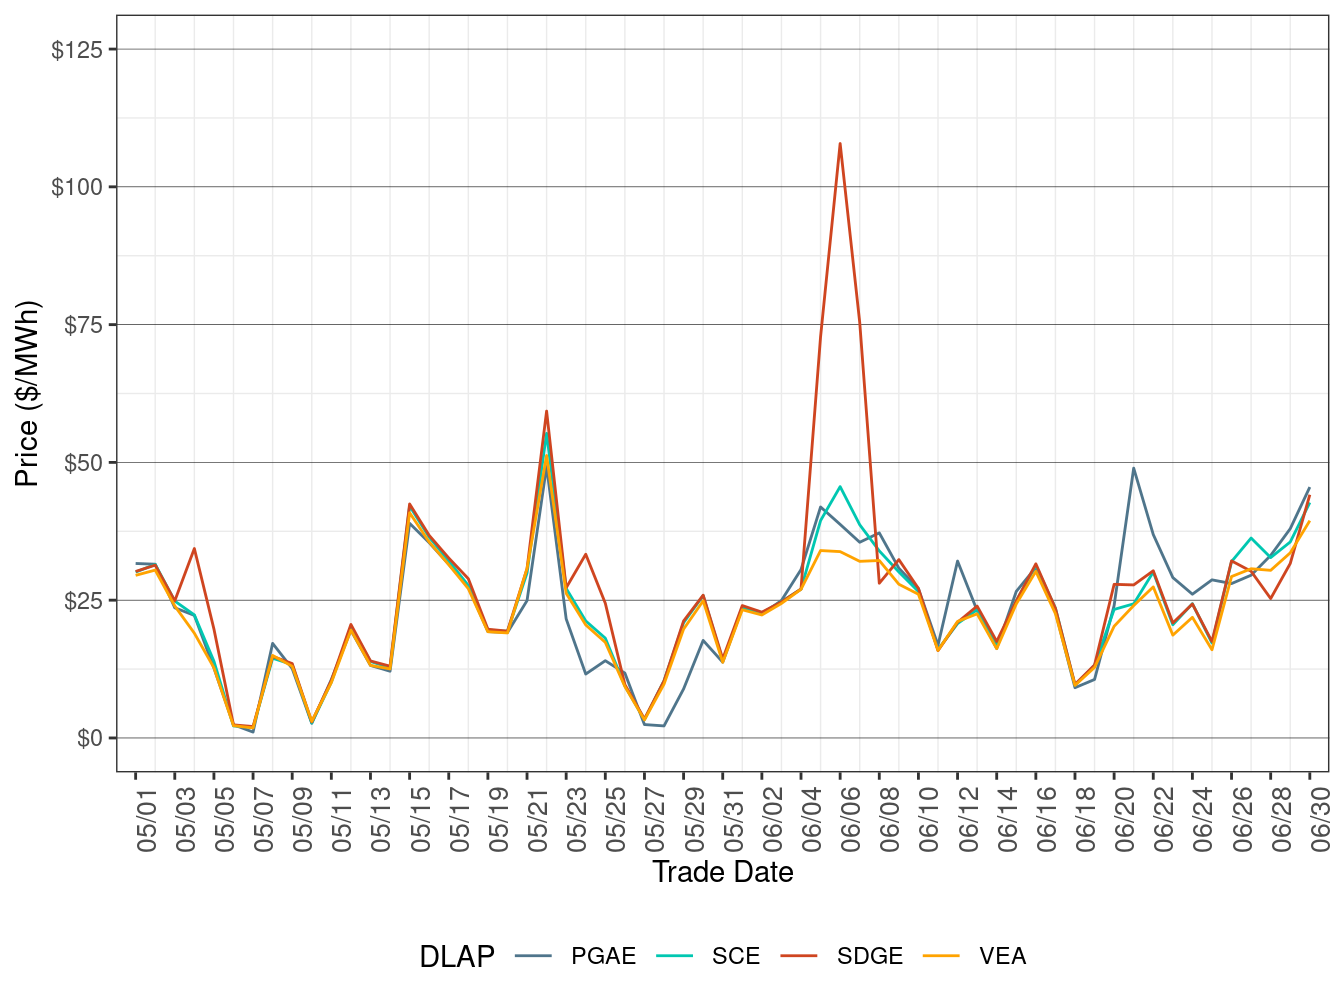
Figure 5 shows daily simple average prices for all the DLAPs (PG&E, SCE, SDG&E, and VEA) for all hours respectively in RTD.
RTD DLAP prices on average increased compared to the previous month, correlated with rising temperatures and natural gas prices, including a heat event at the end of June.
TABLE 5 below lists the binding constraints that resulted in relatively high or low DLAP prices on certain dates.
Figure 5: RTD Simple Average DLAP Prices (All Hours)
| DLAP | Dates | Transmission Constraint |
|---|---|---|
| SDGE | June 5-7 | OMS-13368679_50001_OOS_NG nomogram |
| PGAE | June 8 | BRNSWKT1-DTCH2TAP 115 KV line; AECT_TP1 – TESLA 115 KV line |
| PGAE | June 12 | GATES1-MIDWAY-500kV line; LOSBANOS-GATES1-500kV line |
| PGAE | June 21-25 | LOSBANOS-GATES1-500kV line; MOSSLD-LASAGUIL-230kV line; GATES1-MIDWAY-500kV line; PANOCHE-GATES-230kV line |
| All | June 26-29 | GATES1-MIDWAY-500kV line; MIDWAY-WIRLWIND-500kV line; COTTNWD-ROUND MT-230kV line; OMS_13632484_13810A_NG nomogram; 7820_13810A_RAS_MS-SA_NG nomogram; LOSBANOS-GATES1-500kV line |
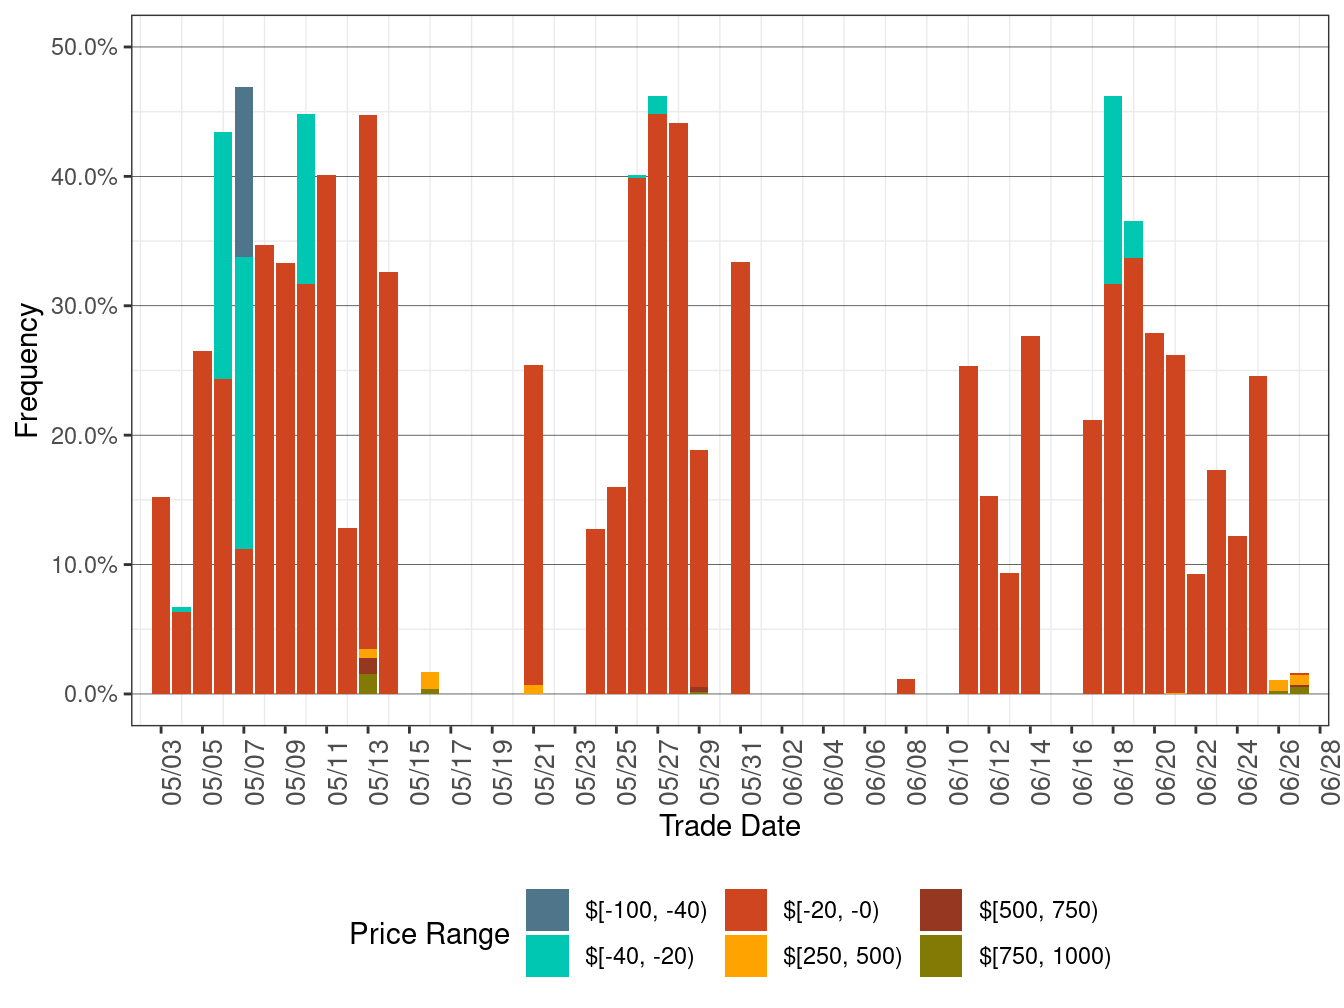
Figure 6 below shows the daily frequency of positive price spikes and negative prices by price range for the DLAPs in RTD.
The cumulative frequency of prices above $250/MWh decreased to 0.09 percent in June from 0.21 percent in the previous month, while the cumulative frequency of negative prices fell to 10.01 percent in June from 19.80 percent in the previous month.
Figure 6: Daily Frequency of RTD DLAP Positive Price Spikes and Negative Prices