3 Market Performance Metrics
Day-Ahead Prices
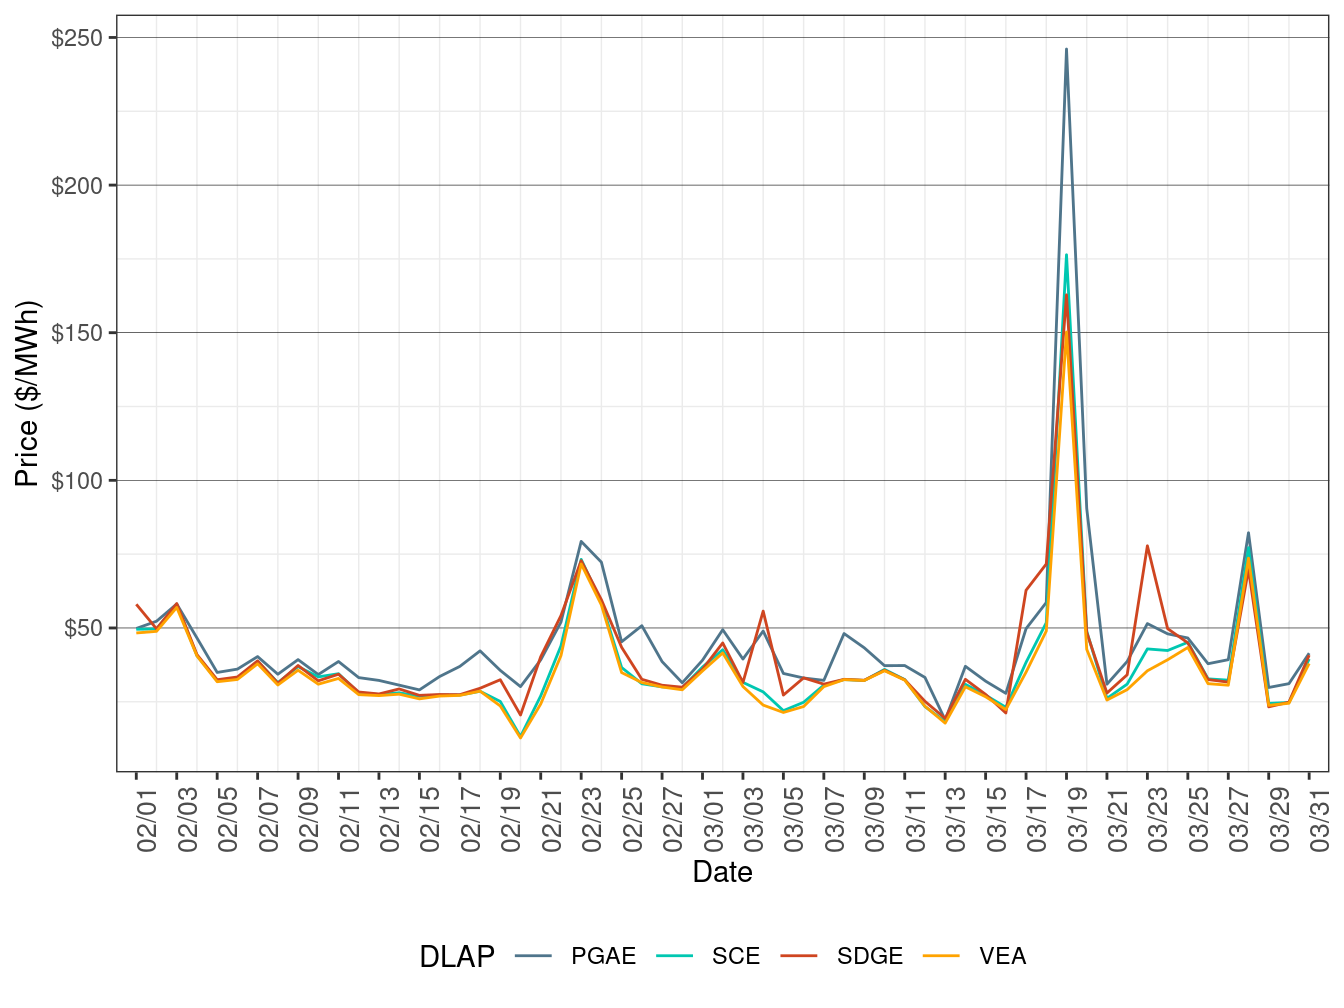
Figure 2 show the daily simple average load-aggregation points (LAP) prices for each of the four default LAPs (PG&E, SCE, SDG&E, and VEA) for all hours. Table 2 below lists the binding constraints along with the associated DLAP locations and the dates when the binding constraints resulted in relatively high or low DLAP prices.
Figure 2: Day-Ahead Simple Average LAP Prices (All Hours)
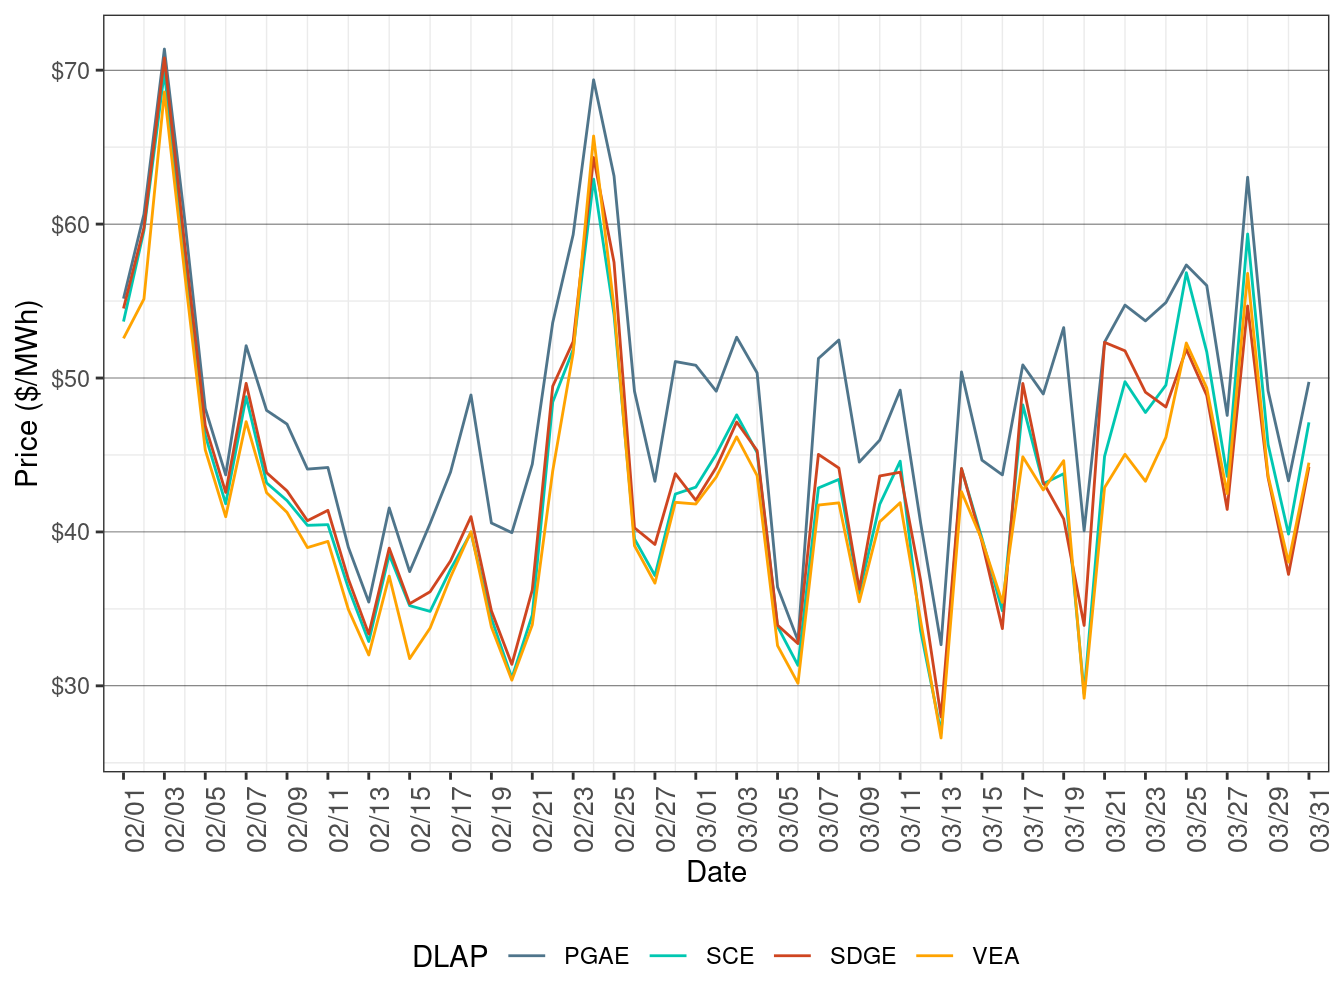
| DLAP | Dates | Transmission Constraint |
|---|---|---|
| PGAE | March 1-3, 12, 15-16, 18-24 | PANOCHE-GATES-230 kV line |
| PGAE | March 4, 7-9 | 7440_MetcalfImport_Mossld-Metclf nomogram |
| PGAE | March 11 | METCALF-MOSSLAND-500 kV line |
| PGAE | March 13-14 | OMS_11291263_Metcalf_Import_BG nomogram |
Real-Time Price
Figure 3 show daily simple average LAP prices for all the default LAPs (PG&E, SCE, SDG&E, and VEA) for all hours respectively in FMM. Table 3 lists the binding constraints along with the associated DLAP locations and the dates when the binding constraints resulted in relatively high or low DLAP prices.
Figure 3: FMM Simple Average LAP Prices (All Hours)
| DLAP | Dates | Transmission Constraint |
|---|---|---|
| PGAE | March 8-9 | 7440_MetcalfImport_Tes-Metcalf nomogram |
| PGAE | March 11 | METCALF-MOSSLAND-500 kV line |
| PGAE | March 12 | LOSBANOS-GATES1-500 kV line |
| PGAE | March 17-19 | PANOCHE-GATES-230 kV line |
| SDGE | March 17-18, 23-24 | OMS_11281965_SUNCREST-BK81_NG nomogram |
Figure 4 below shows the daily frequency of positive price spikes and negative prices by price range for the default LAPs in the FMM. The cumulative frequency of prices above $250/MWh inched up to 0.07 percent in March from 0.02 percent in February. The cumulative frequency of negative prices increased to 7.12 percent in March from 4.75 percent in February.
Figure 4: Daily Frequency of FMM LAP Positive Price Spikes and Negative Prices
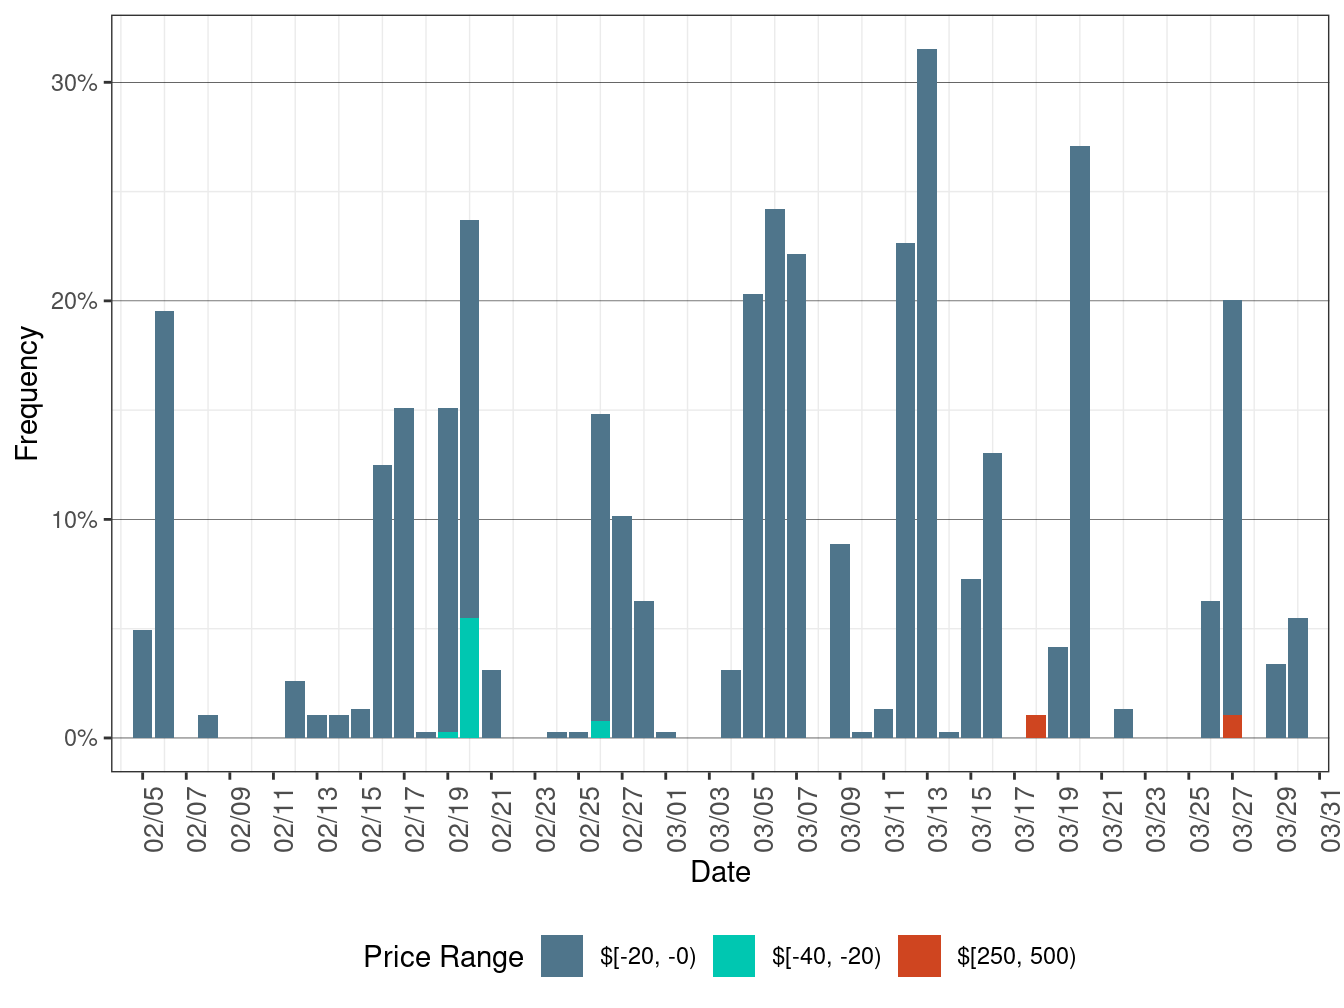
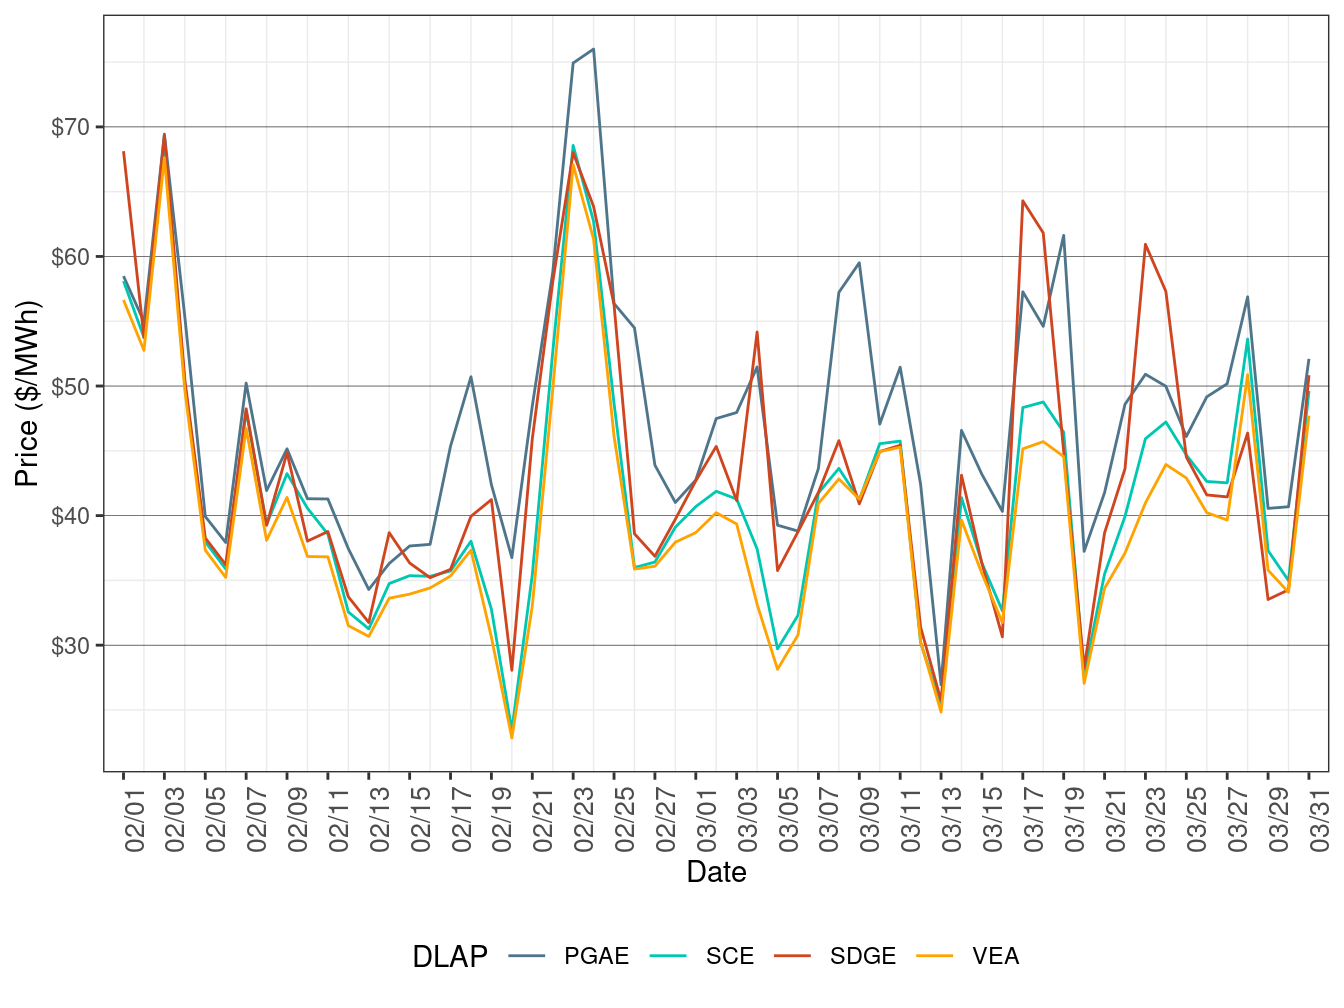
Figure 5 show daily simple average LAP prices for all the default LAPs (PG&E, SCE, SDG&E, and VEA) for all hours respectively in RTD. TABLE 4 lists the binding constraints along with the associated DLAP locations and the dates when the binding constraints resulted in relatively high or low DLAP prices.
Figure 5: RTD Simple Average LAP Prices (All Hours)
| DLAP | Dates | Transmission Constraint |
|---|---|---|
| PGAE | March 19 | 6110_ COI_N-S |
| SDGE | March 23 | OMS_11281965_SUNCREST-BK81_NG nomogram |
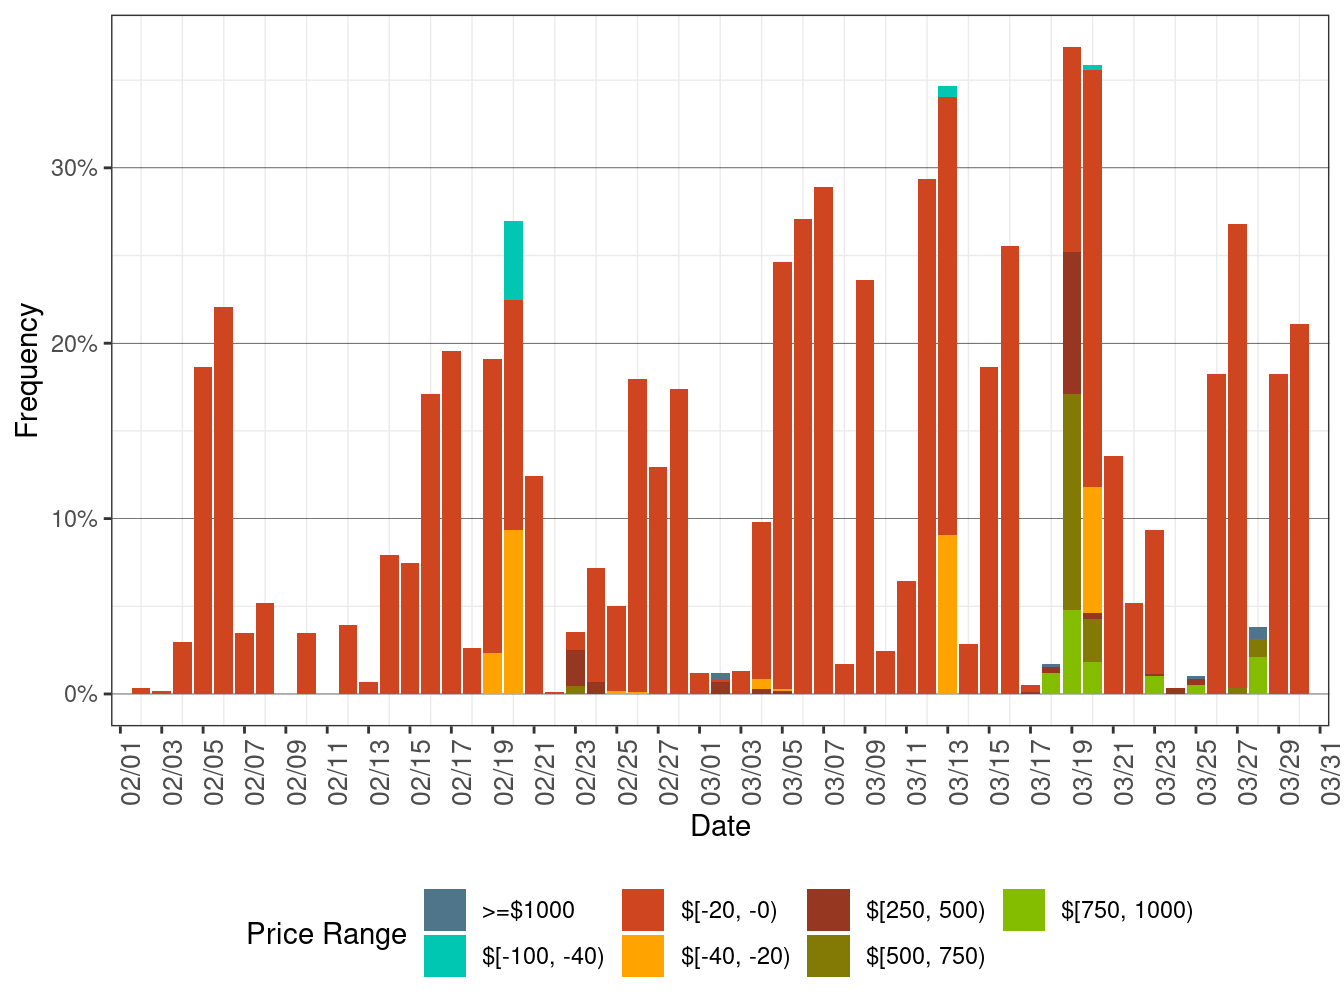
Figure 4 below shows the daily frequency of positive price spikes and negative prices by price range for the default LAPs in RTD. The cumulative frequency of prices above $250/MWh increased to 1.29 percent in March from 0.11 percent in February. The cumulative frequency of negative prices rose to 12.61 percent in March from 8.41 percent in February.
Figure 6: Daily Frequency of RTD LAP Positive Price Spikes and Negative Prices