B Ancillary Services
Requirements
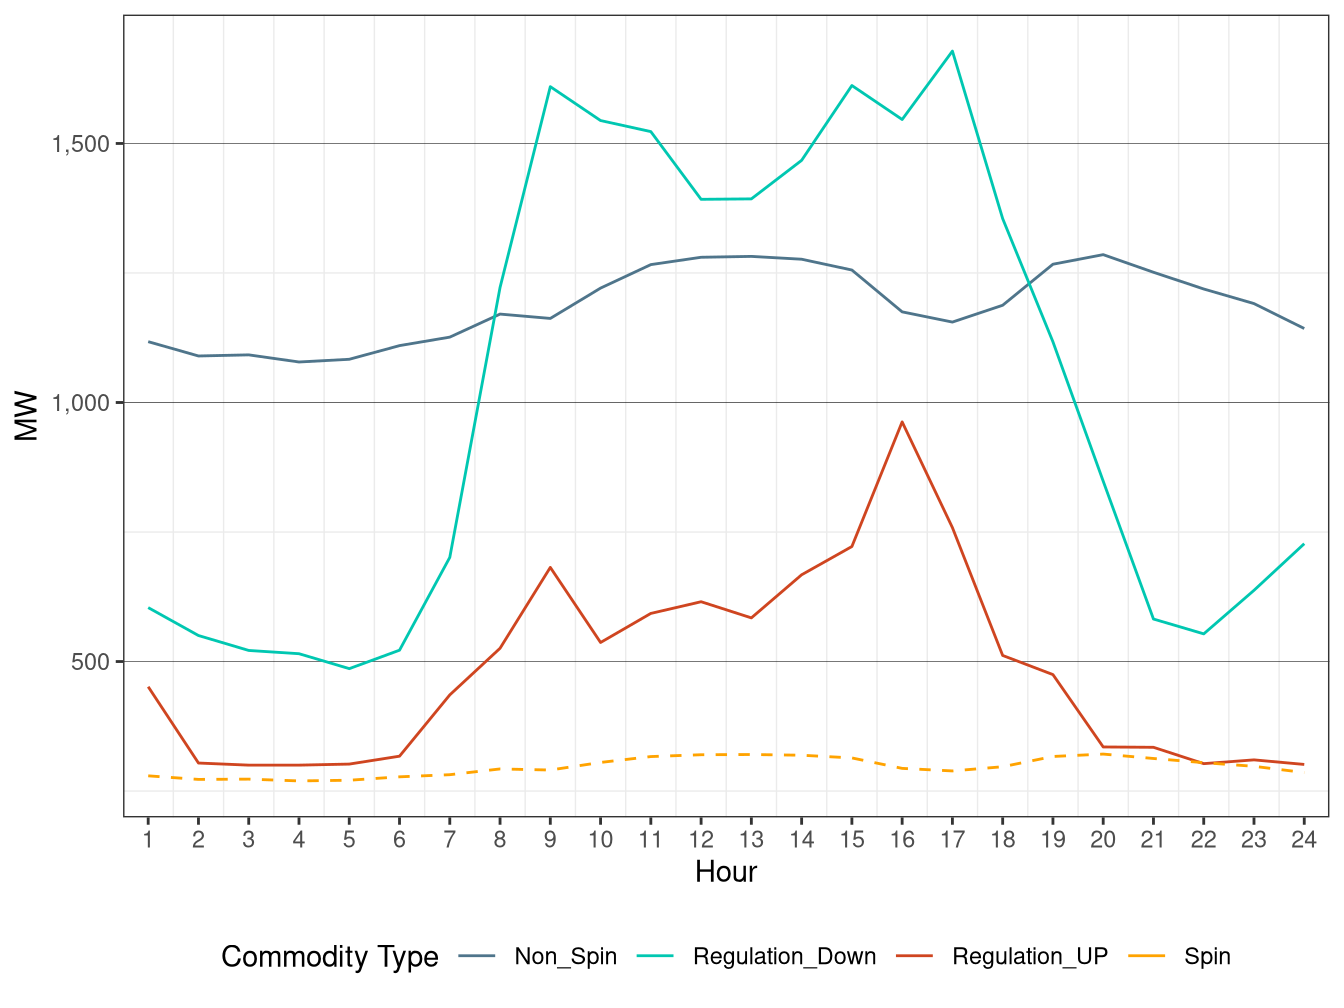
Figure B.1 illustrates the IFM daily average ancillary service requirement for regulation up, regulation down, spinning and non-spinning. Figure B.2 shows the IFM hourly average ancillary service requirement for regulation up and regulation down.
Figure B.1: IFM (Day-Ahead) Average Ancillary Services Requirement
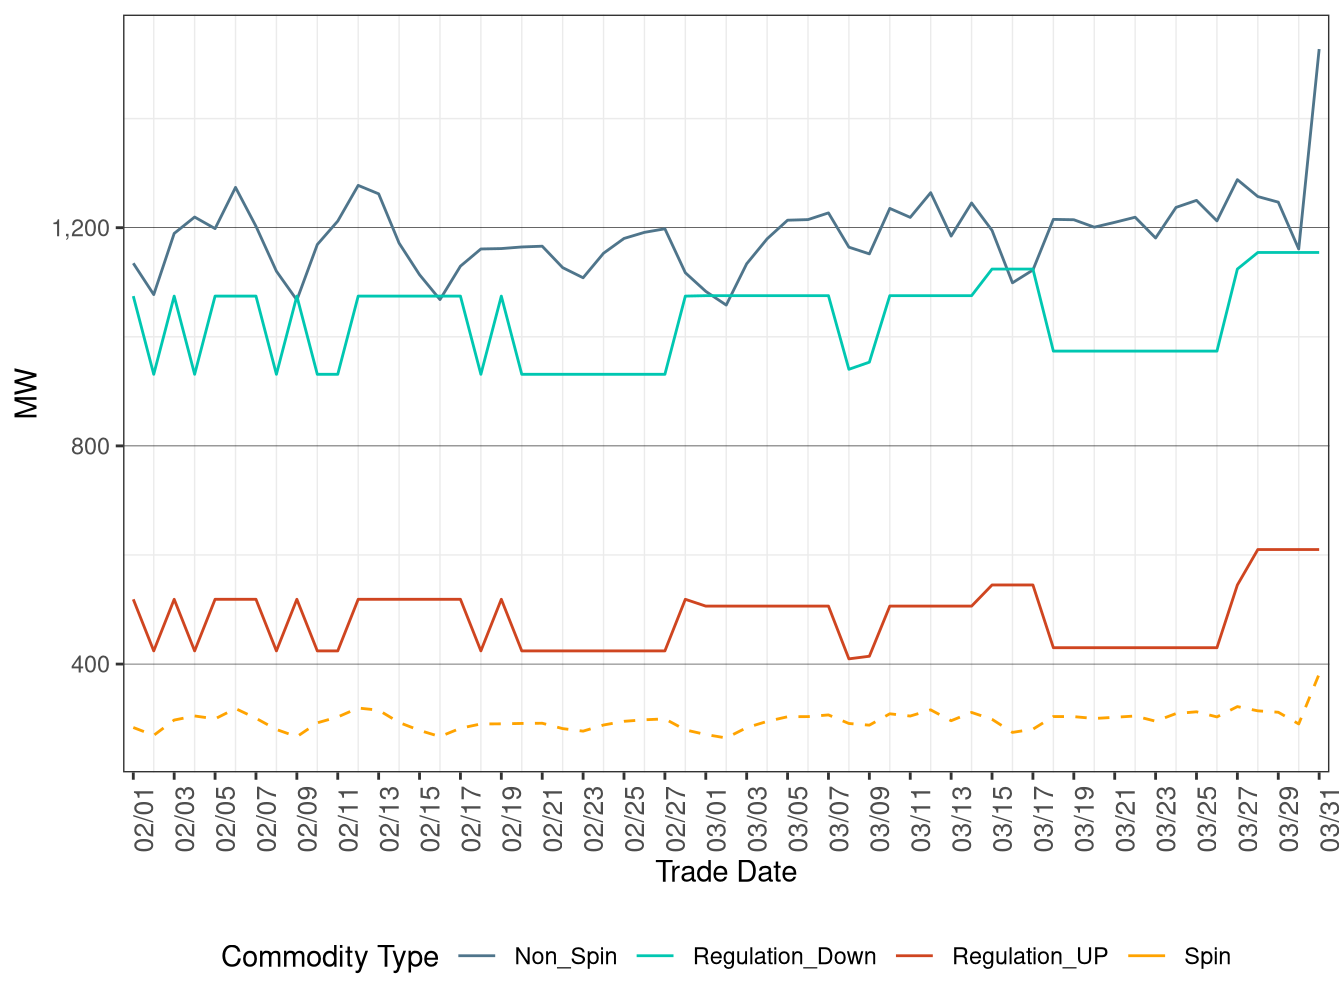
Figure B.2: IFM (Day-Ahead) Hourly Average Regulation Requirement
Procurements
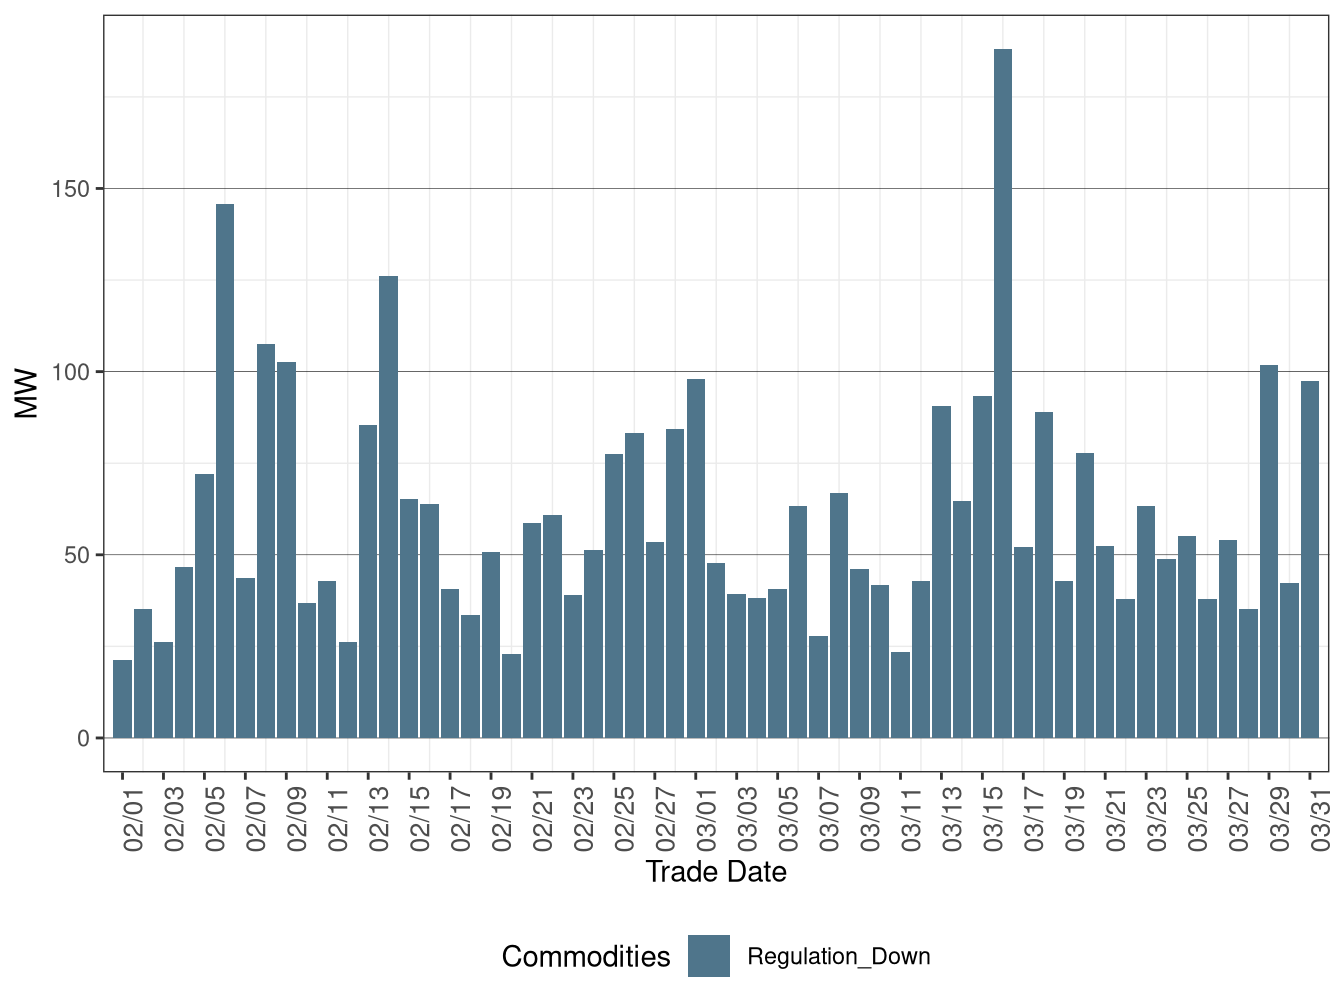
Figure B.3 illustrates the IFM daily average procurement of regulation up, spinning and non-spinning ancillary services, while Figure B.4 illustrates regulation down service procurement.
Figure B.3: IFM (Day-Ahead) Average Upward Ancillary Services Procurement
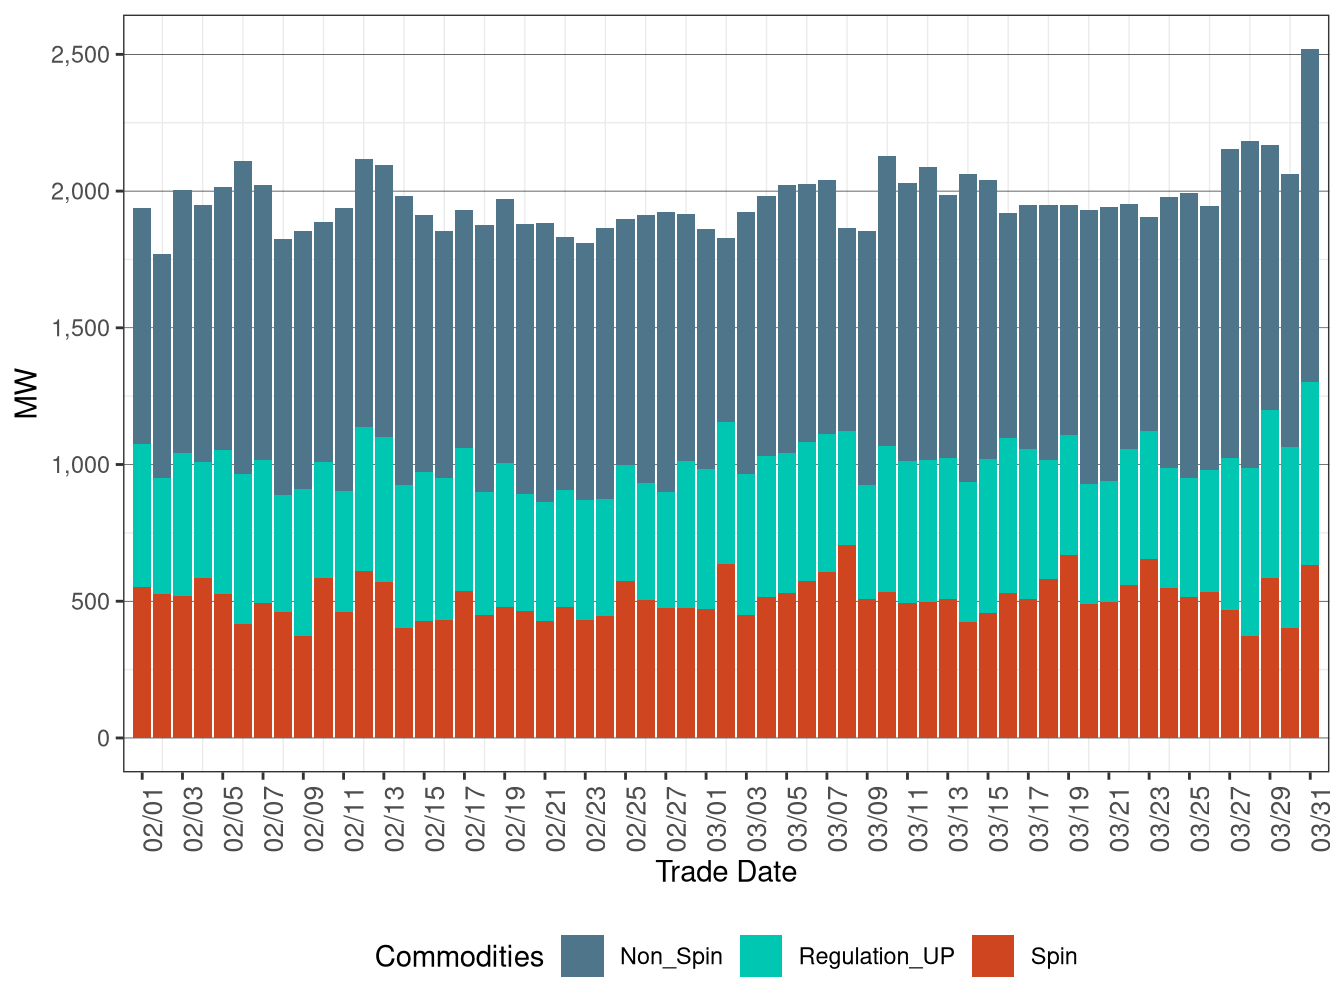
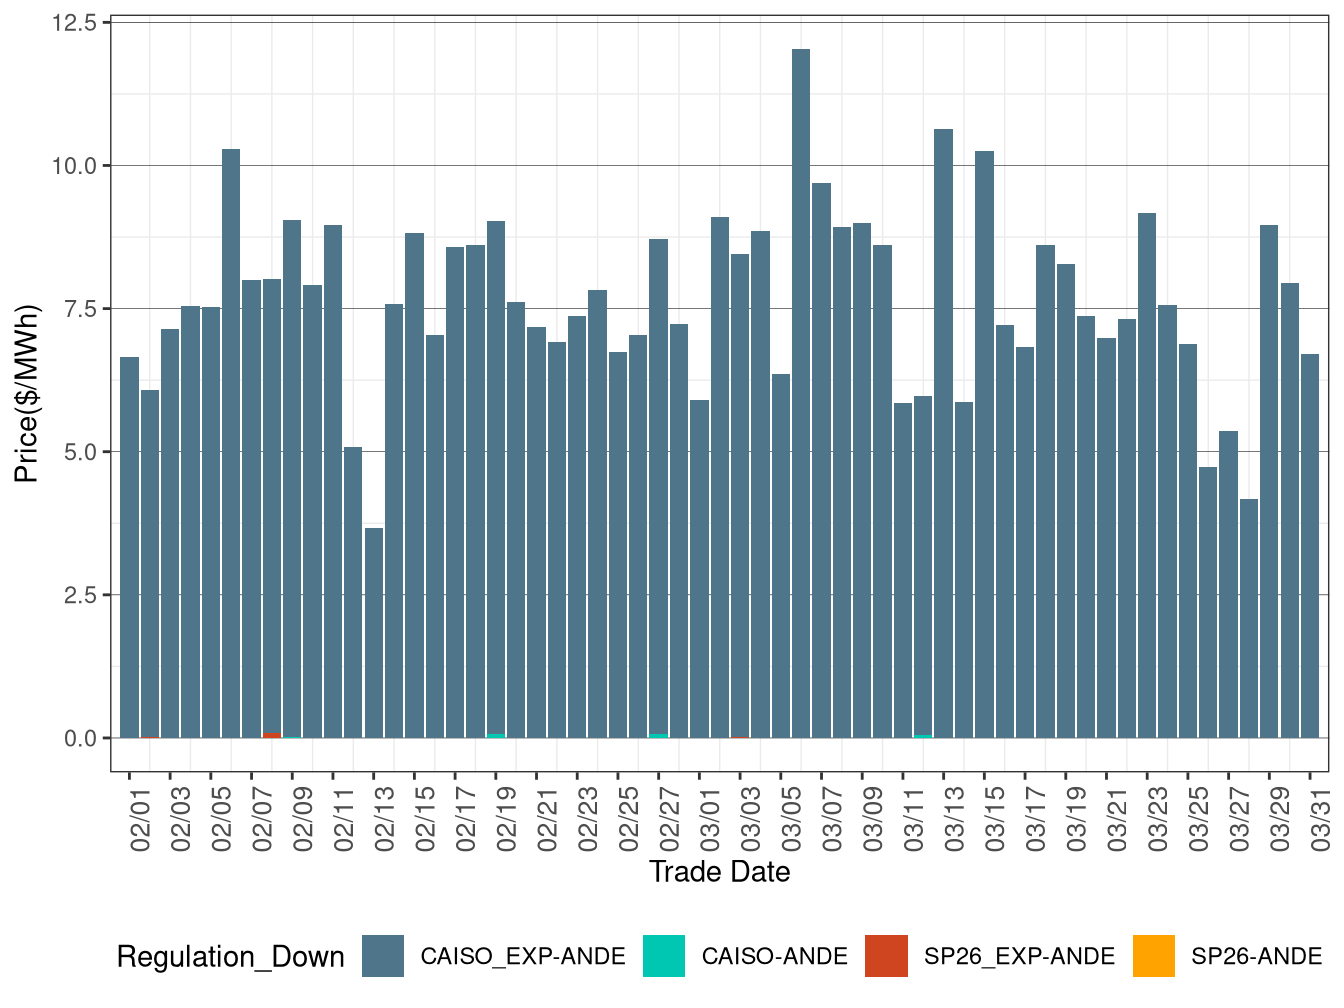
Figure B.4: IFM (Day-Ahead) Average Regulation Down Procurement
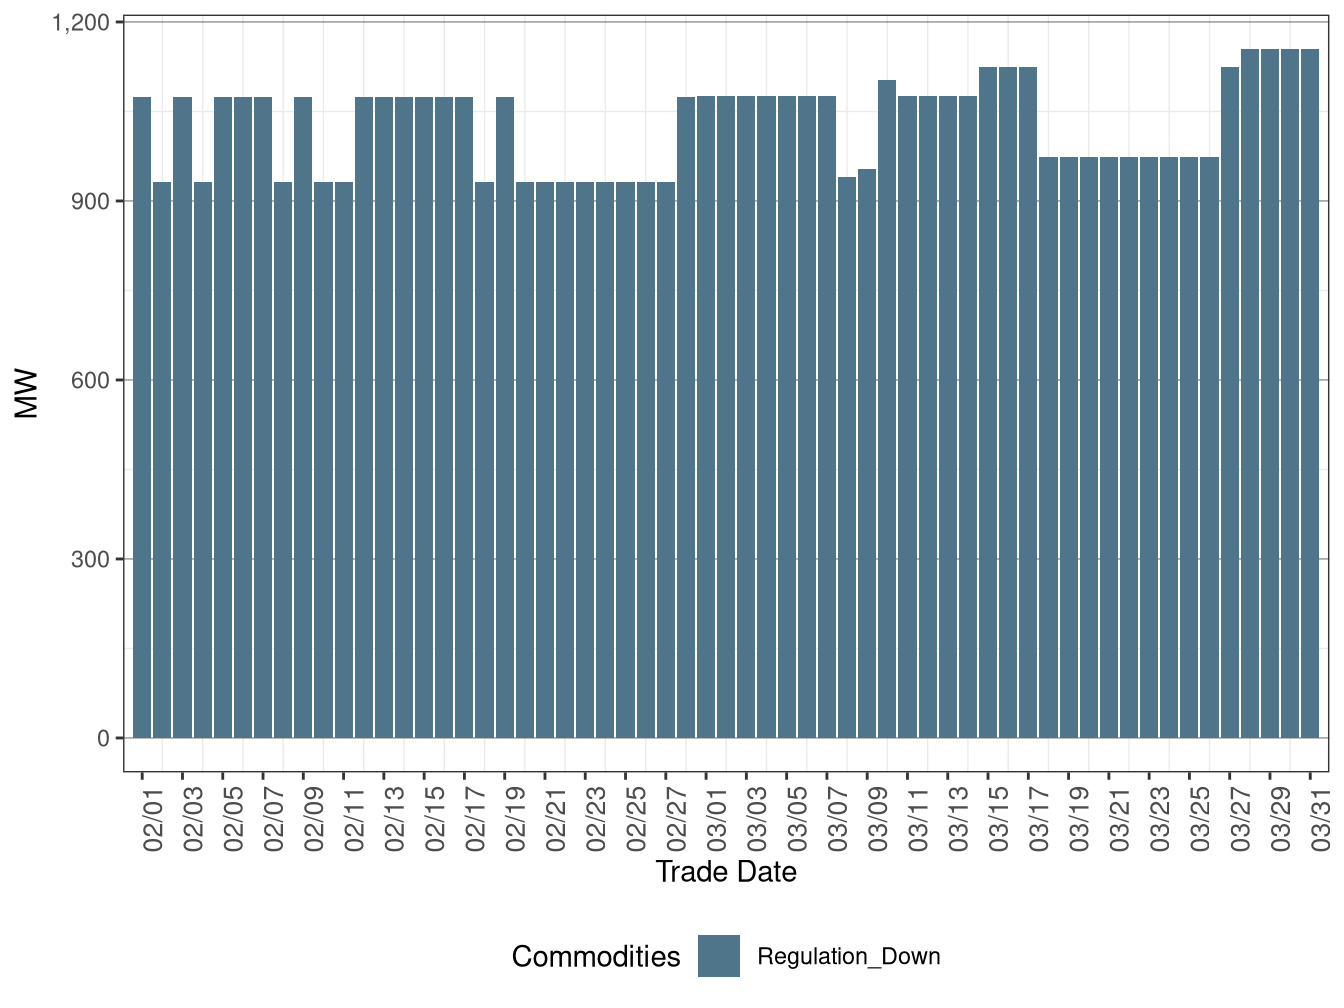
Figure B.5 illustrates the real-time daily average procurement of upward ancillary services. It includes regulation up and regulation down procured in real-time unit commitment (RTUC), and spinning and non-spinning procured in RTUC. (Does not contain HASP like original metric catalog.)
Figure B.5: Real-Time (FMM) Average Upward Ancillary Services Procurement
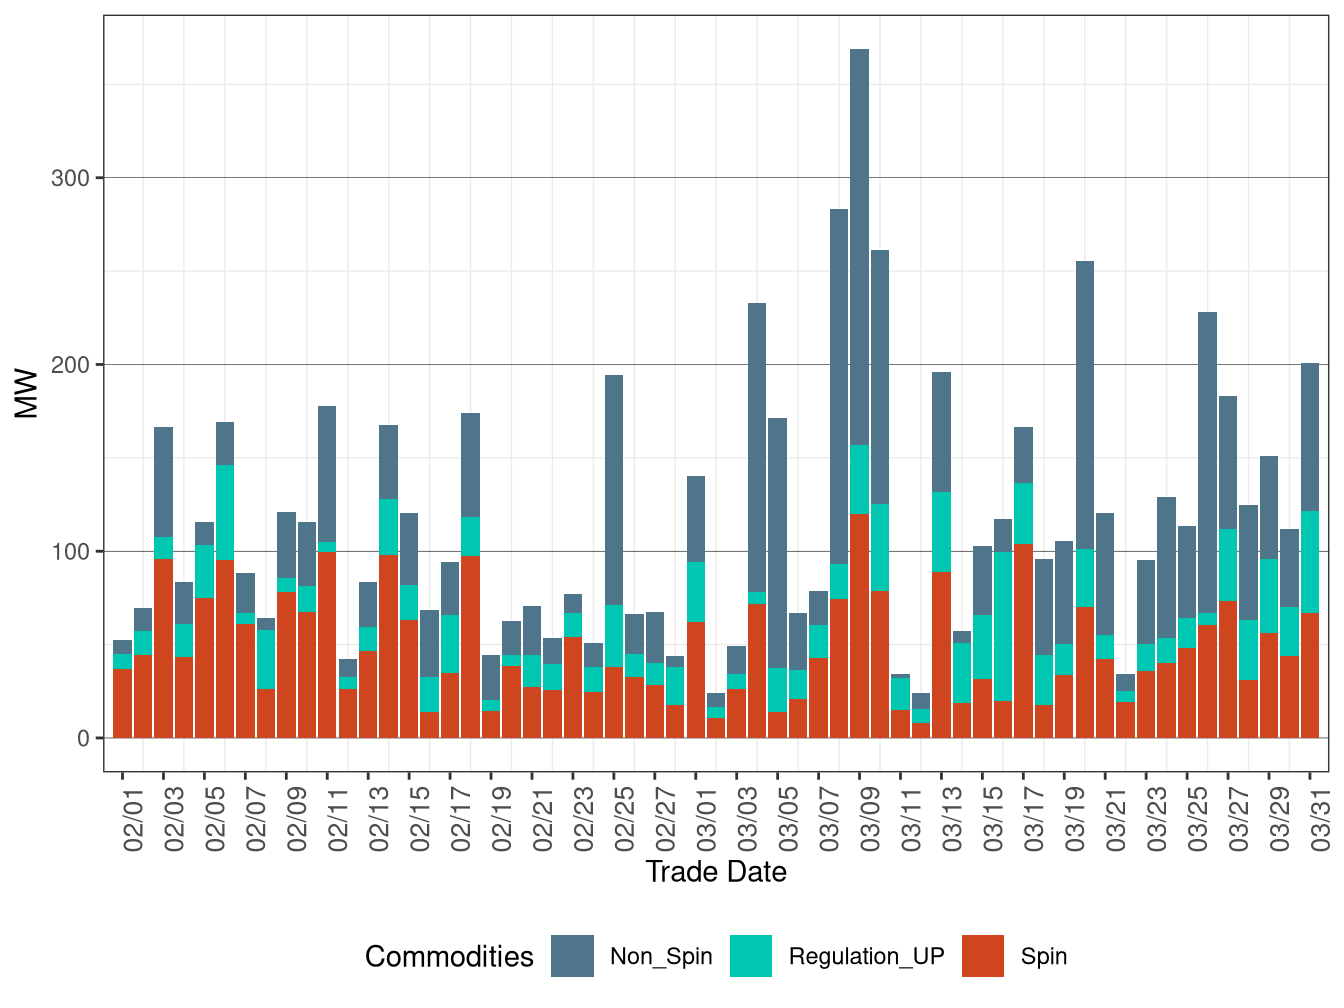
Figure B.6 illustrates the RTUC daily average procurement of regulation down.
Figure B.6: Real-Time (FMM) Average Downward Ancillary Services Procurement
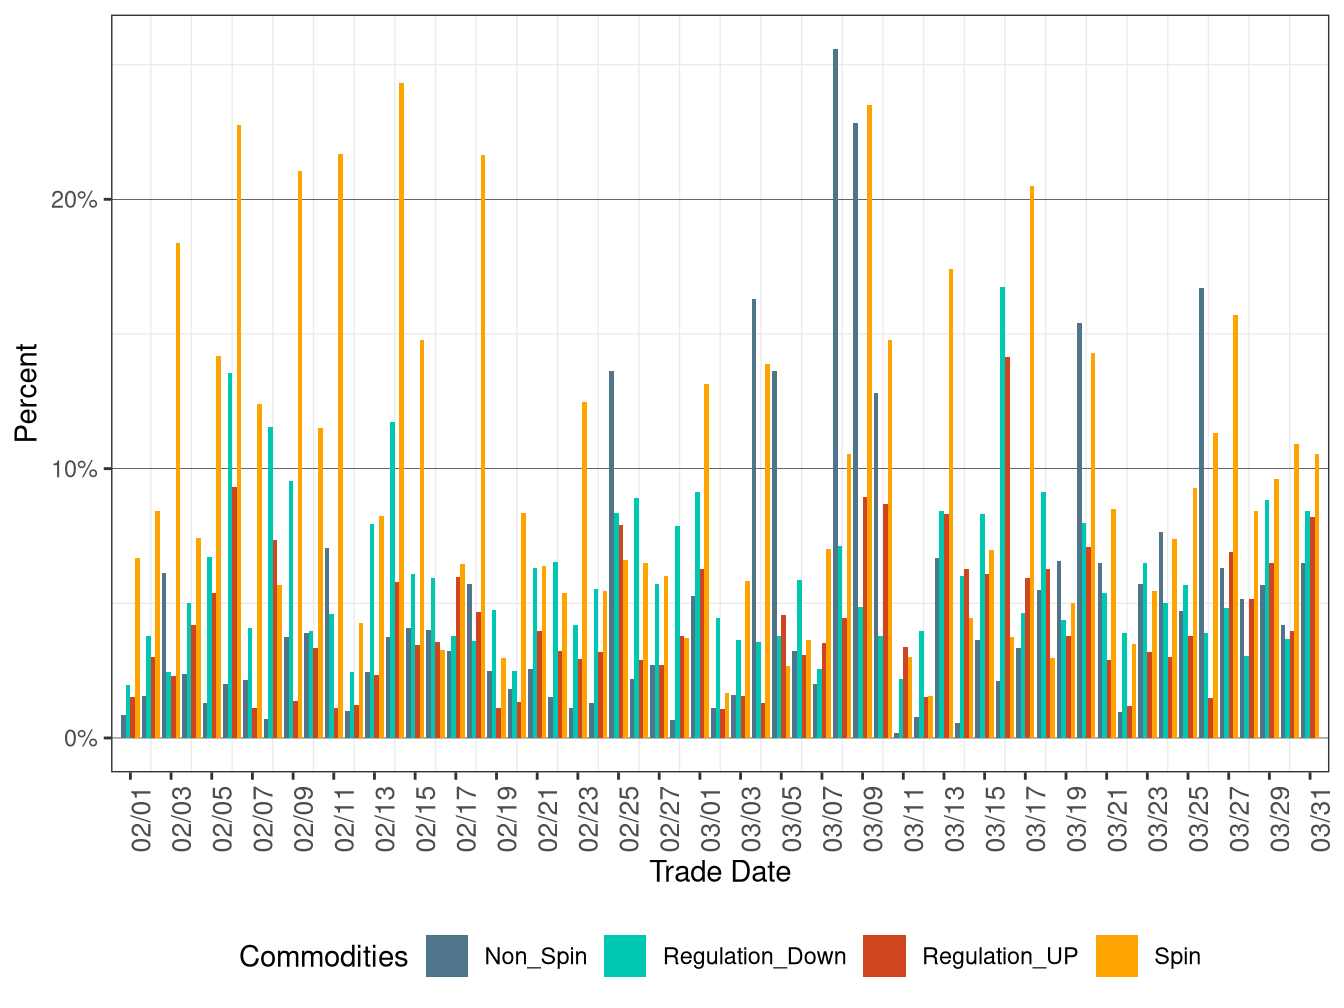
The ISO procures 100 percent of its ancillary services requirements in the IFM (day-ahead) based on the IFM load forecast. Incremental procurement in the real-time market occurs under two scenarios: when ancillary services requirements have changed in real-time market motivated by a change in the real-time load forecast; if a unit which was awarded an ancillary service in IFM (day-ahead) is unable to provide that service in real-time. In the latter case, the market will automatically procure additional services as replacement.
Figure B.7 displays the percentage of real-time procurement with respect to the IFM (day-ahead) procurement for all four types of ancillary services. The real-time procurement of regulation down and regulation up is actually the procurement in RTUC, while the real-time procurement of spinning and non-spinning is the sum of procurement in both RTUC and HASP. The percentage for each type of ancillary service is calculated as: (hourly average of real-time (RTUC and HASP) procurement in 15 minute intervals) / (hourly IFM (day-ahead) procurement).
Figure B.7: Proportion of Real-Time Procurement as Percentage of Day-Ahead Requirement
Day-Ahead (IFM) and Real-Time (FMM) Average Prices
Figure B.8 and Figure B.9 illustrate the IFM daily and hourly average price for regulation up, regulation down, spinning and non-spinning ancillary services. The average price for each type of ancillary services is calculated as: sum (non-self scheduled AS MW * ancillary services marginal price $/MW (ASMP)) / sum (non-self scheduled AS MW).
Figure B.8: IFM (Day-Ahead) Ancillary Service Average Price
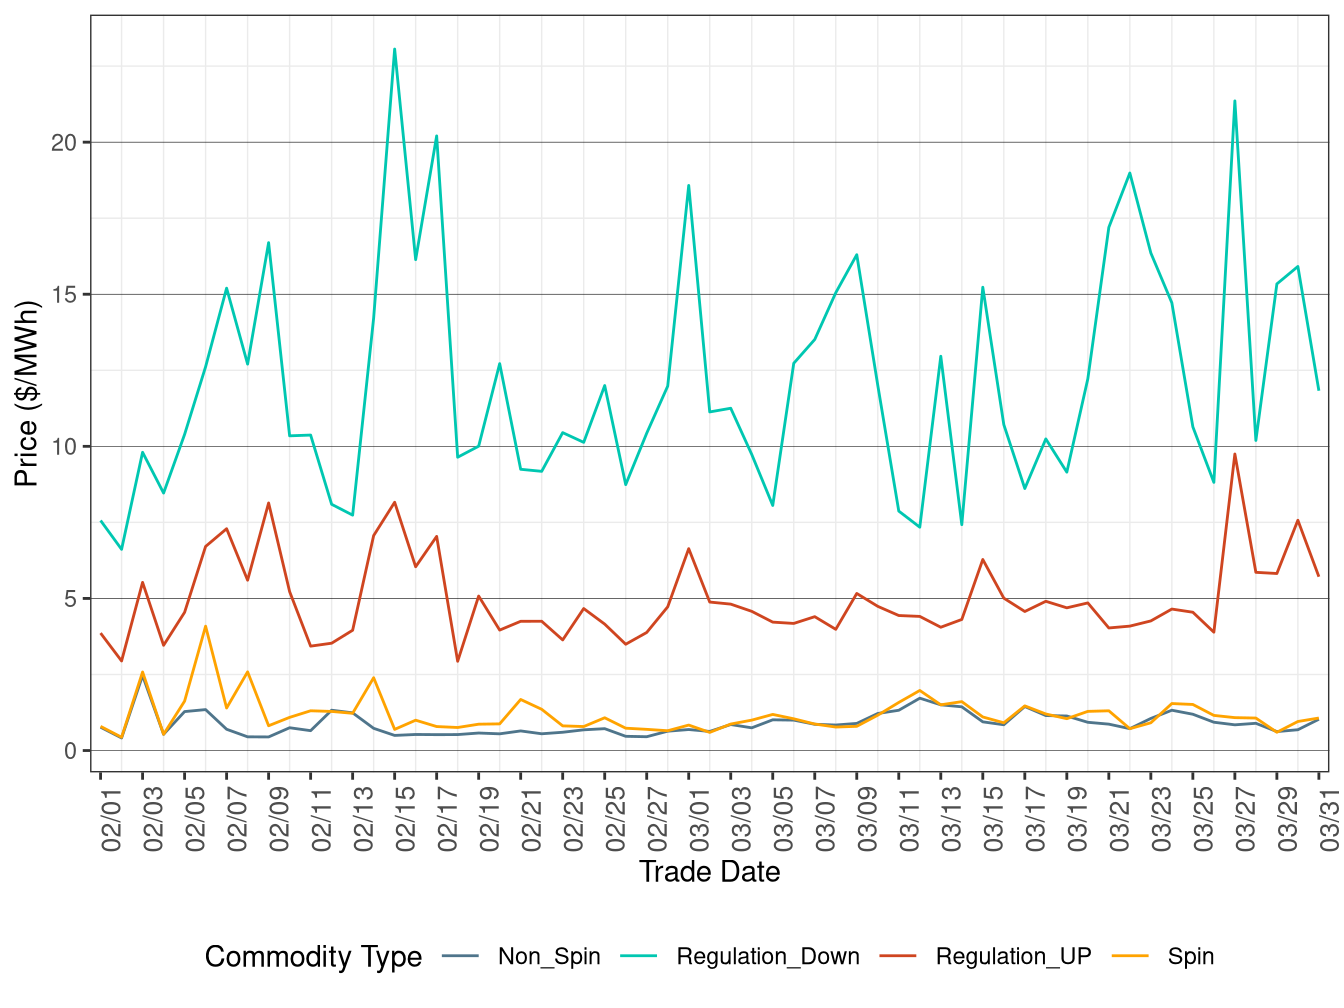
Figure B.9: IFM (Day-Ahead) Hourly Average Ancillary Service Price
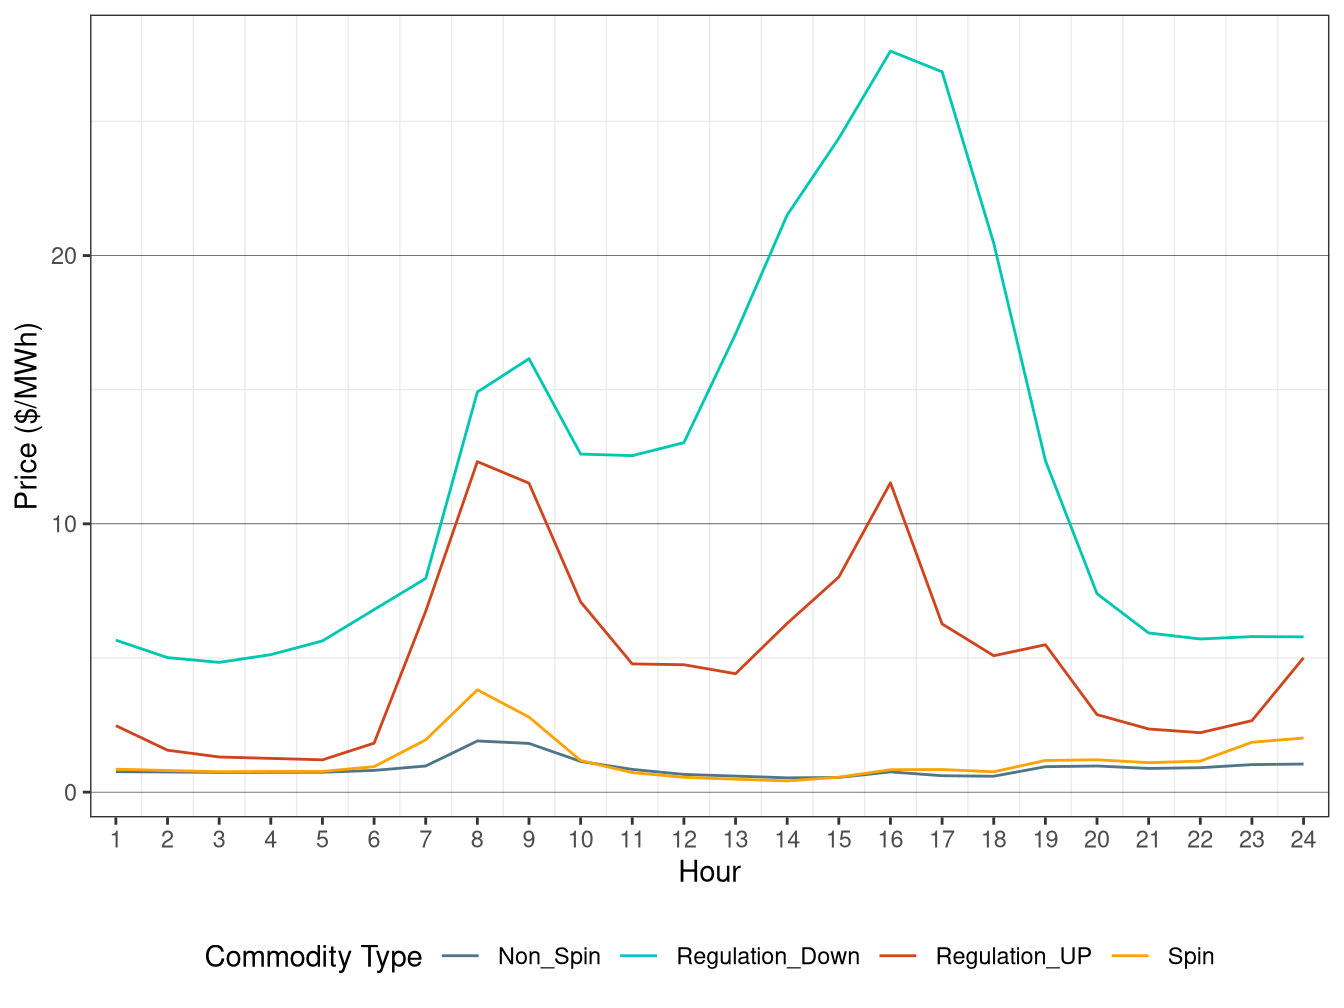
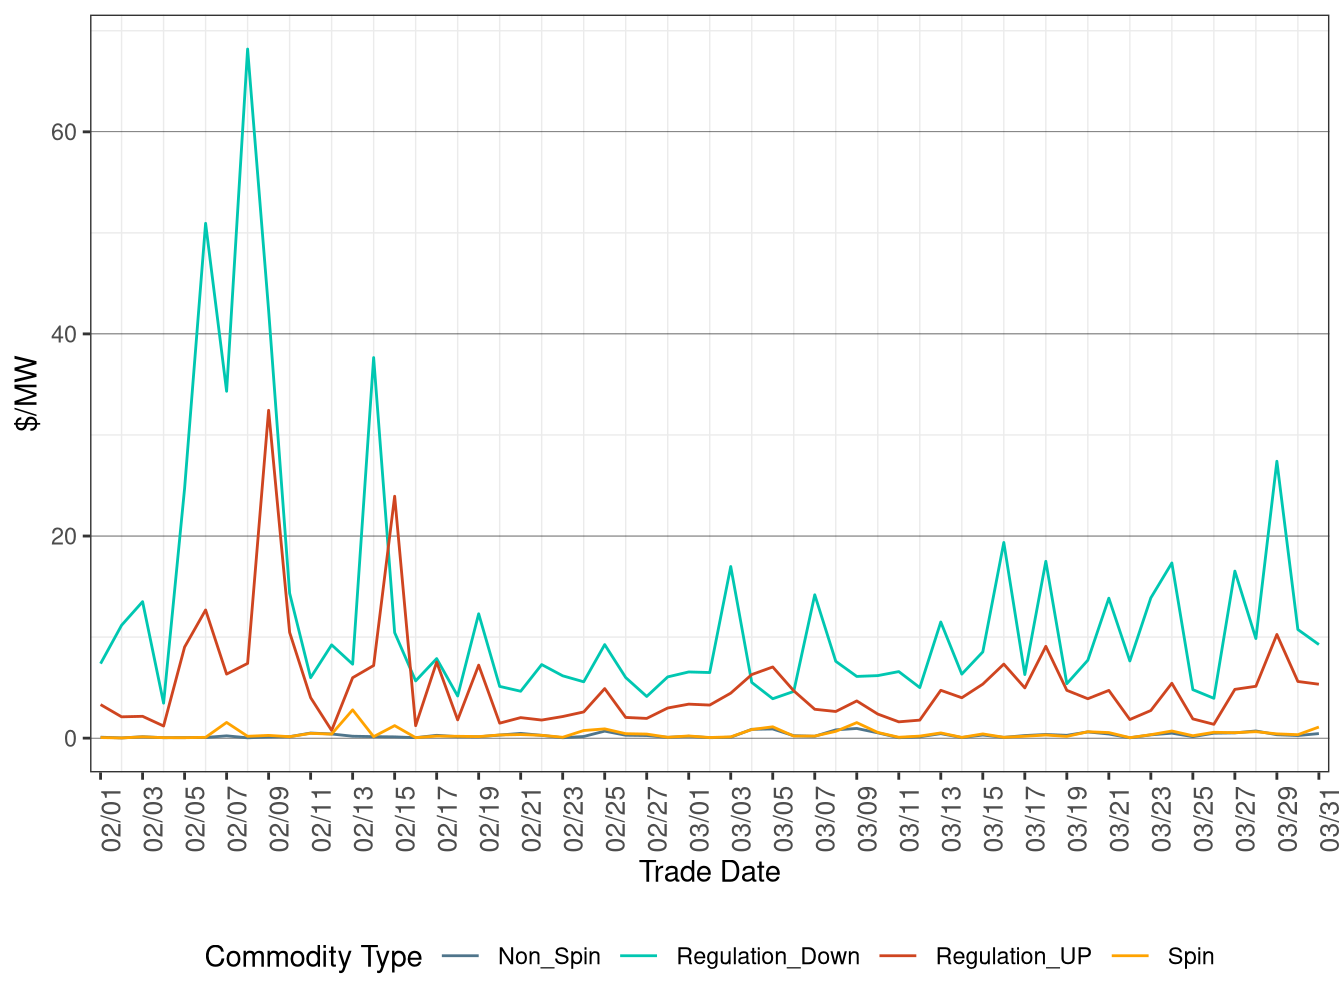
Figure B.10 illustrates the real-time (FMM) daily average price for ancillary services, including the average price for regulation up and regulation down procured in RTUC, and the average price for spinning and non-spinning procured in both RTUC and HASP. The average price for each type of ancillary services is calculated as: hourly average of [sum (non-self scheduled AS MW * ancillary services marginal price $/MW (ASMP)) / sum (non-self scheduled AS MW)] for each of the 15 minute intervals.
Figure B.10: FMM (Real-Time) Ancillary Service Average Price
Average Regional Ancillary Service Shadow Prices
Figure B.11 through Figure B.14 display the IFM daily average regional ancillary service shadow prices (RASSPs) for regulation up, spinning, non-spinning and regulation down.
Figure B.11: IFM (Day-Ahead) Average Regulation Up RASSP
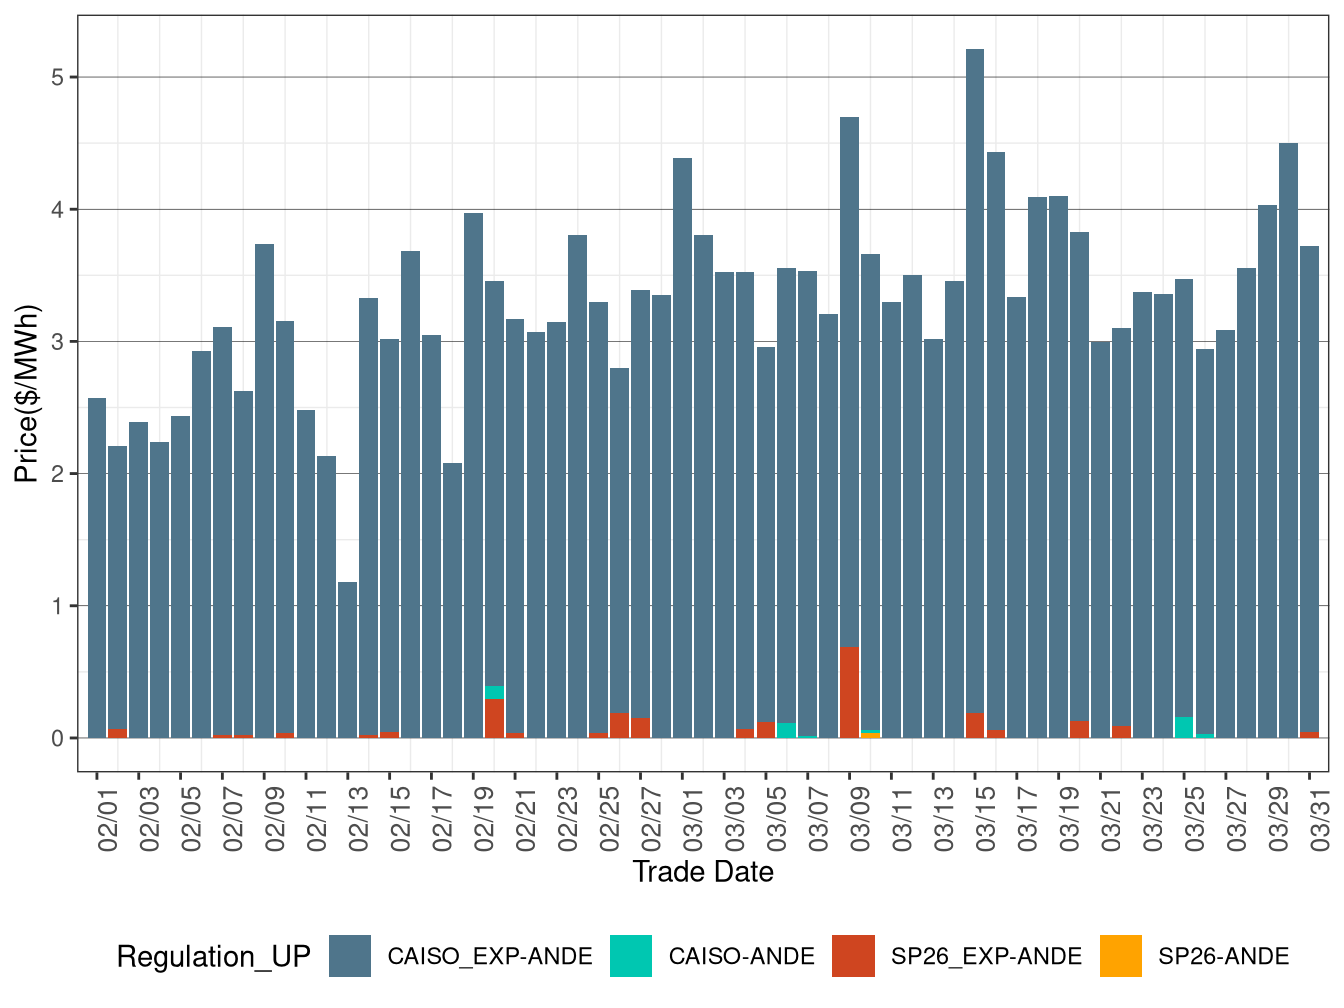
Figure B.12: IFM (Day-Ahead) Average Spinning Reserve RASSP
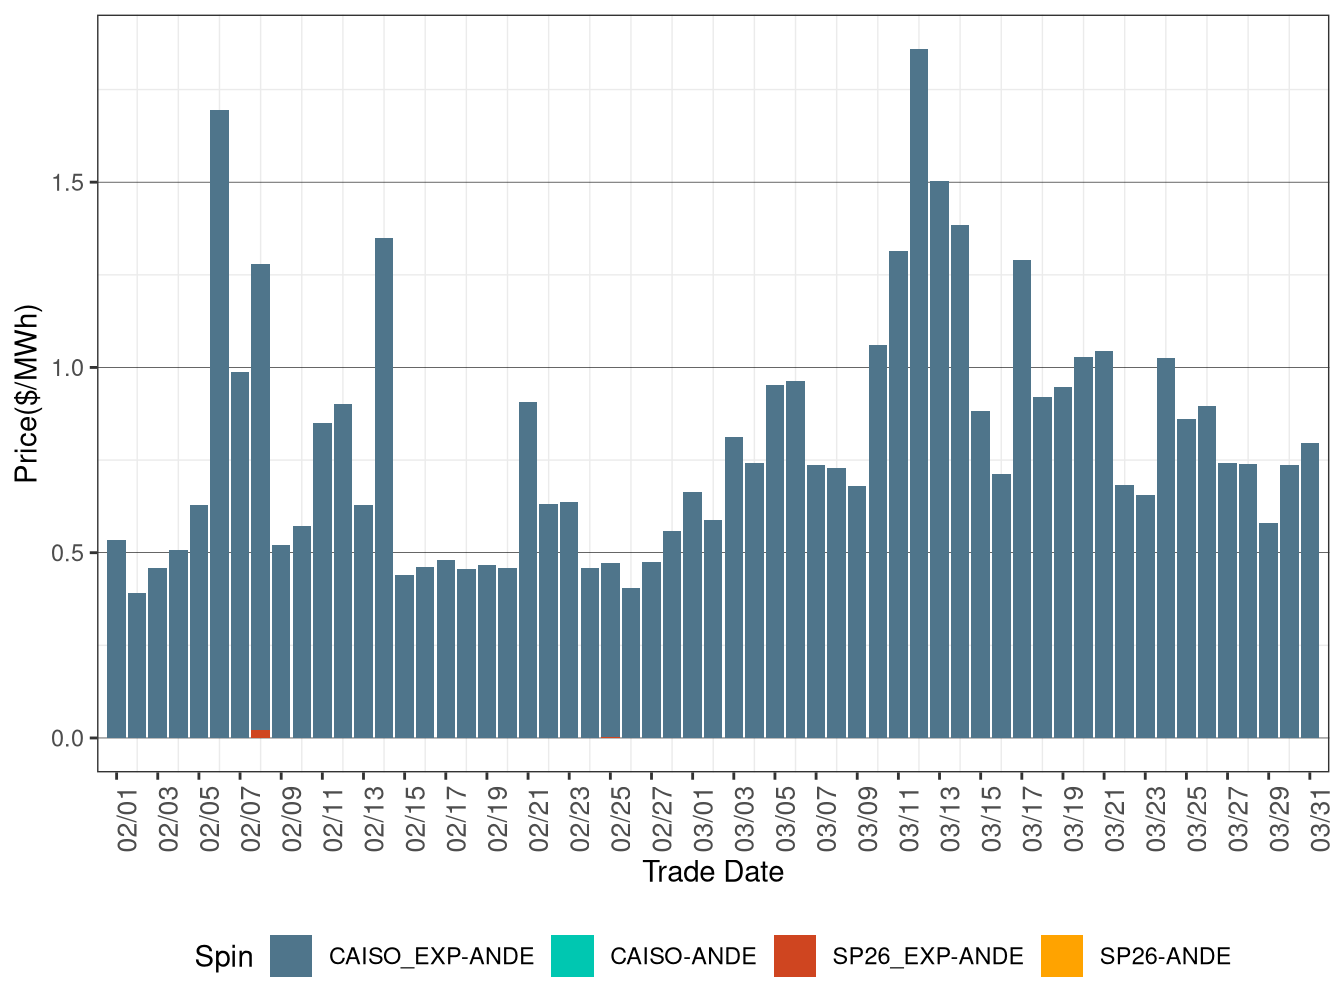
Figure B.13: IFM (Day-Ahead) Average Non-Spinning Reserve RASS)
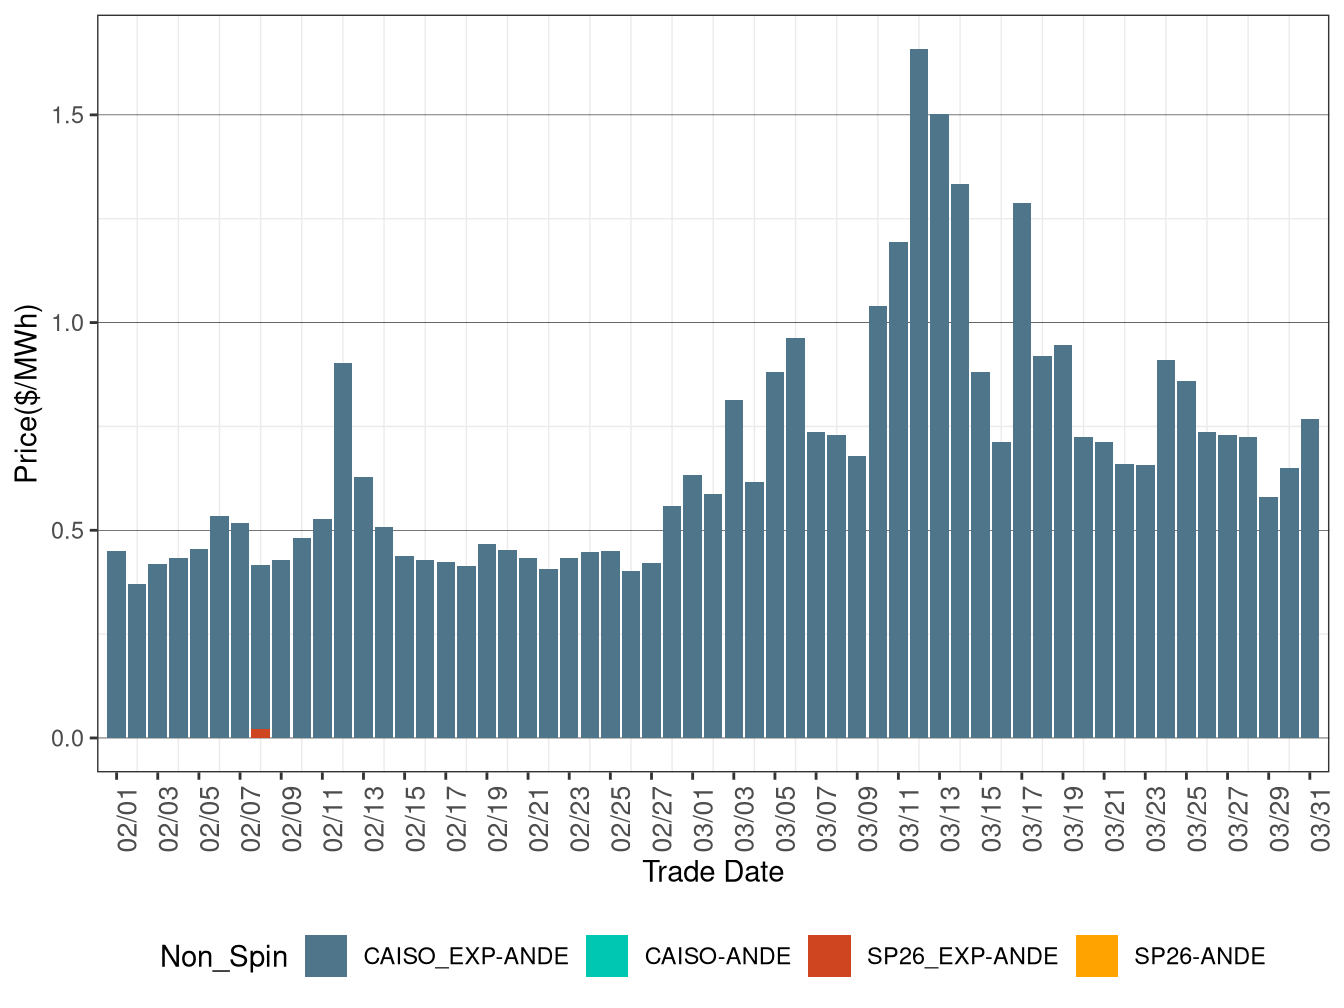
Figure B.14: IFM (Day-Ahead) Average Regulation Down RASSP