3 Market Performance Metrics
Day-Ahead Prices
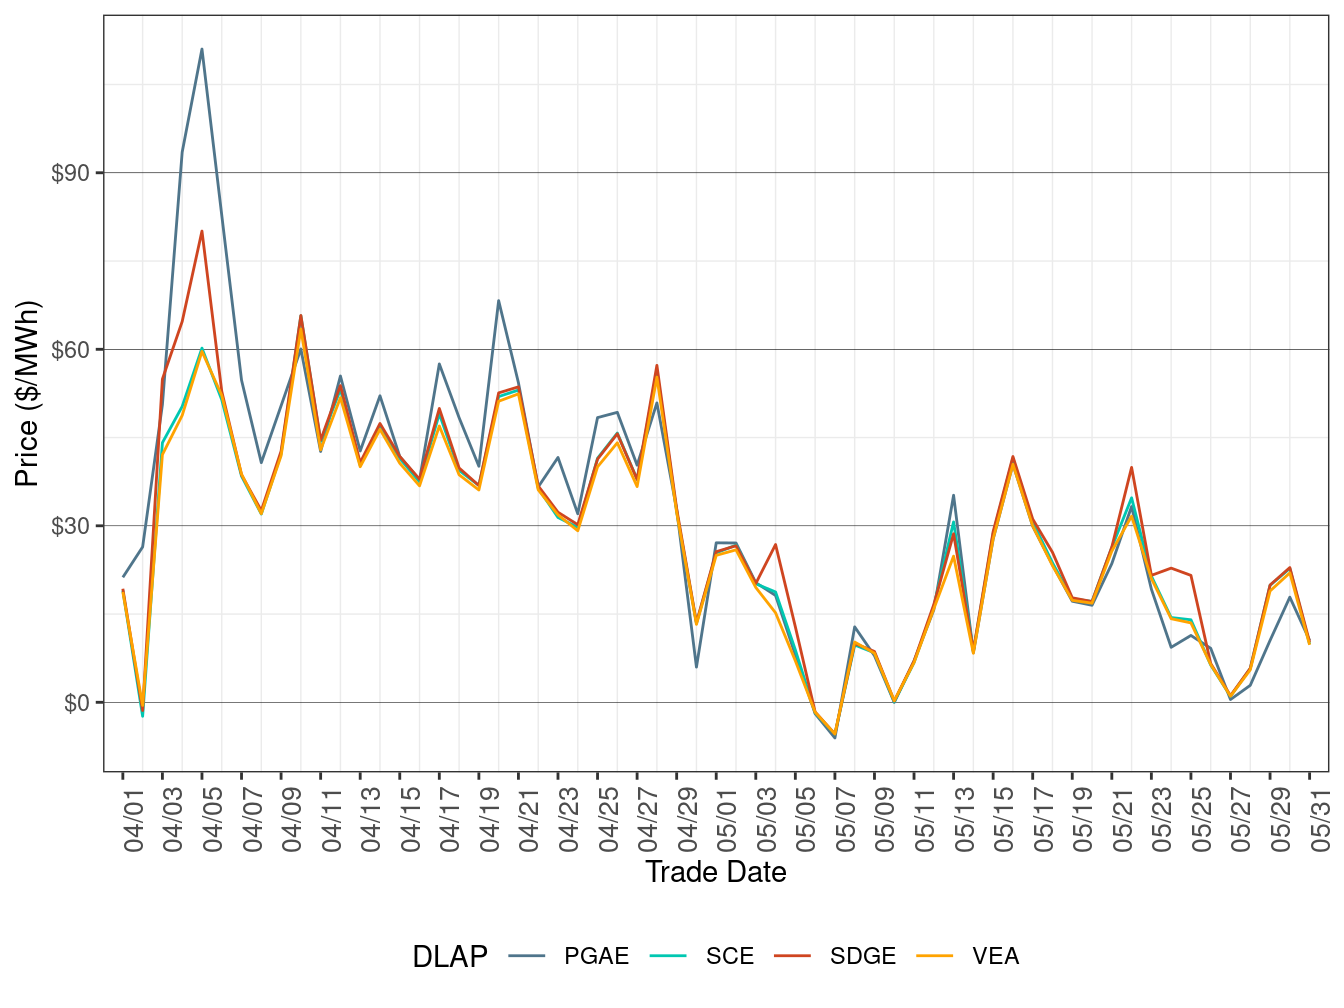
Figure 2 shows the daily simple average prices for all hours in IFM for each of the four default load-aggregation points (DLAP): PG&E, SCE, SDG&E, and VEA.
Day-Ahead DLAP prices on average fell compared to the previous month, correlated with declining natural gas prices.
TABLE 3 below lists the binding constraints that resulted in relatively high or low DLAP prices on certain dates.
Figure 2: IFM (Day-Ahead) Simple Average DLAP Prices (All Hours)
| DLAP LMPs Affected | Dates | Transmission Constraint |
|---|---|---|
| PGAE | May 8-11 | LASAGUIL–PANOCHE 230KV line; NEENACH-TAP-85 66kV line; MOSSLD-LASAGUIL 230kV line |
| SDGE | May 16; May 18 | TL 50001 nomogram line; NEENACH-TAP-85 66kV line |
Real-Time Price
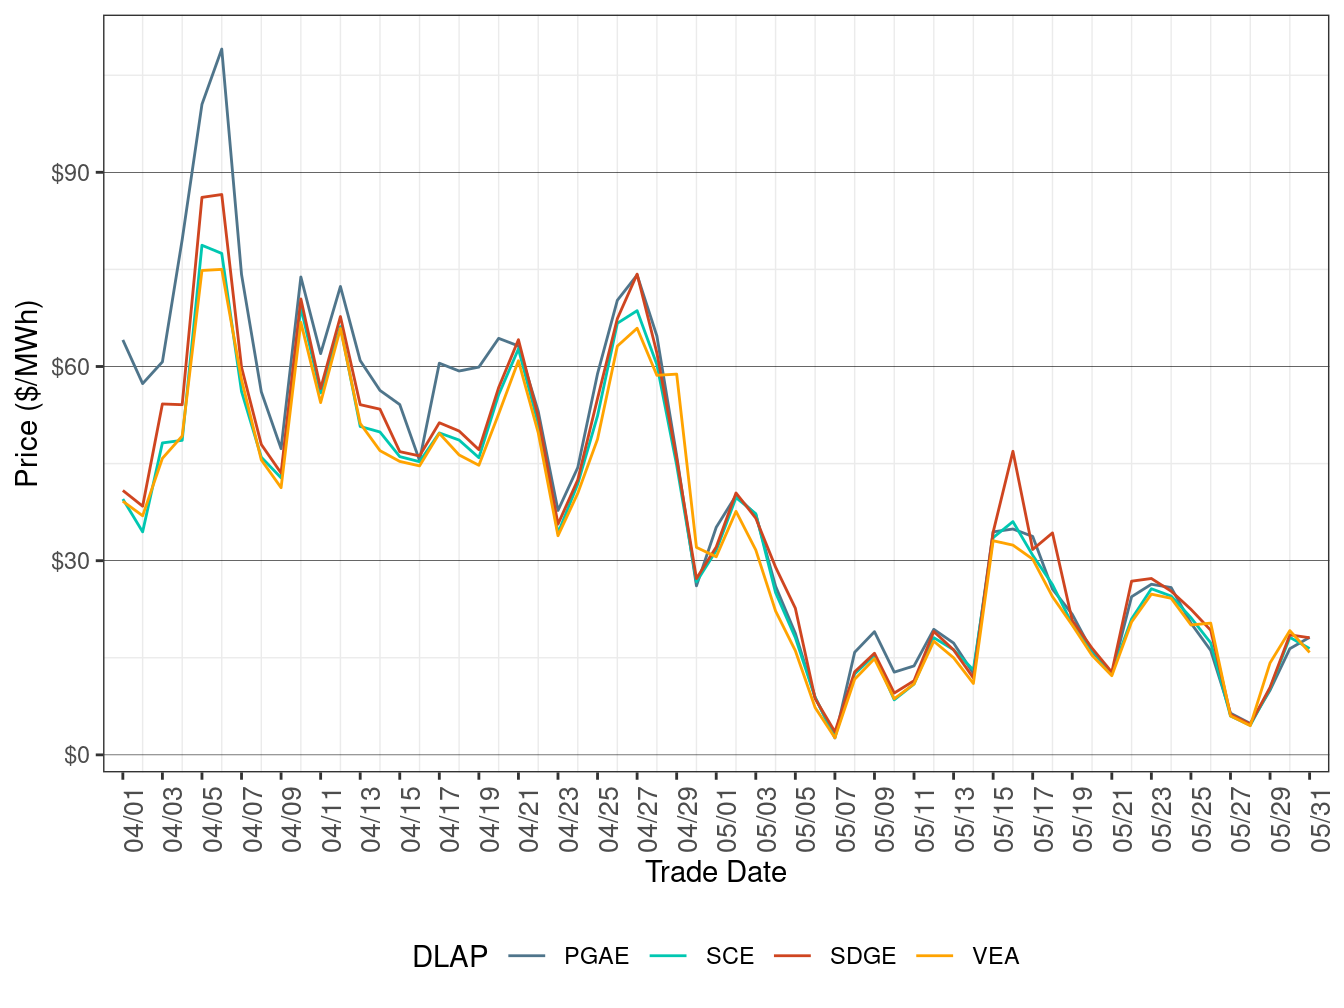
Figure 3 shows daily simple average prices for all four DLAPs (PG&E, SCE, SDG&E, and VEA) for all hours respectively in FMM.
FMM DLAP prices on average fell compared to the previous month, correlated with declining natural gas prices.
TABLE 4 below lists the binding constraints that resulted in relatively high or low DLAP prices on certain dates.
Figure 3: FMM Simple Average DLAP Prices (All Hours)
| DLAP LMPs Affected | Dates | Transmission Constraint |
|---|---|---|
| SDGE | May 4-5 | TRCY-PMP to TESLA 230kV line; TL 50004 nomogram; CLER-LKE-KONOCTI6 60kV line |
| SDGE | May 24-25 | 7820_TL-50002_IV-NG-OUT_TDM nomogram |
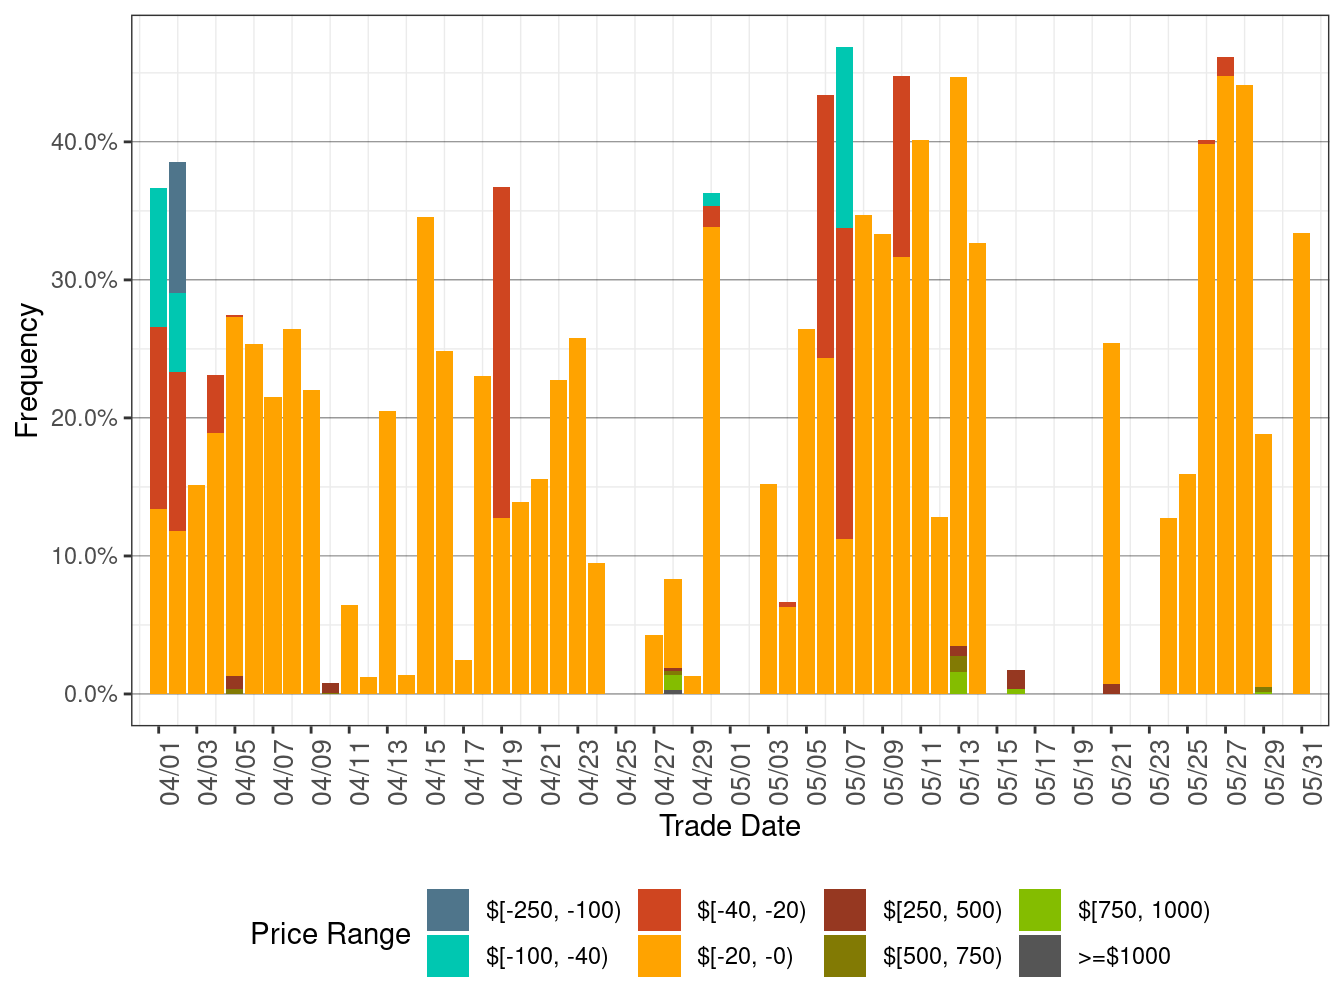
Figure 4 below shows the daily frequency of positive price spikes and negative prices by price range for the DLAPs in the FMM.
The cumulative frequency of prices above $250/MWh decreased to 0.34 percent in May from 0.52 percent in the previous month, while the cumulative frequency of negative prices jumped to 15.51 percent in May from 13.22 percent in the previous month, correlated with the increase in renewable curtailment.
Figure 4: Daily Frequency of FMM DLAP Positive Price Spikes and Negative Prices
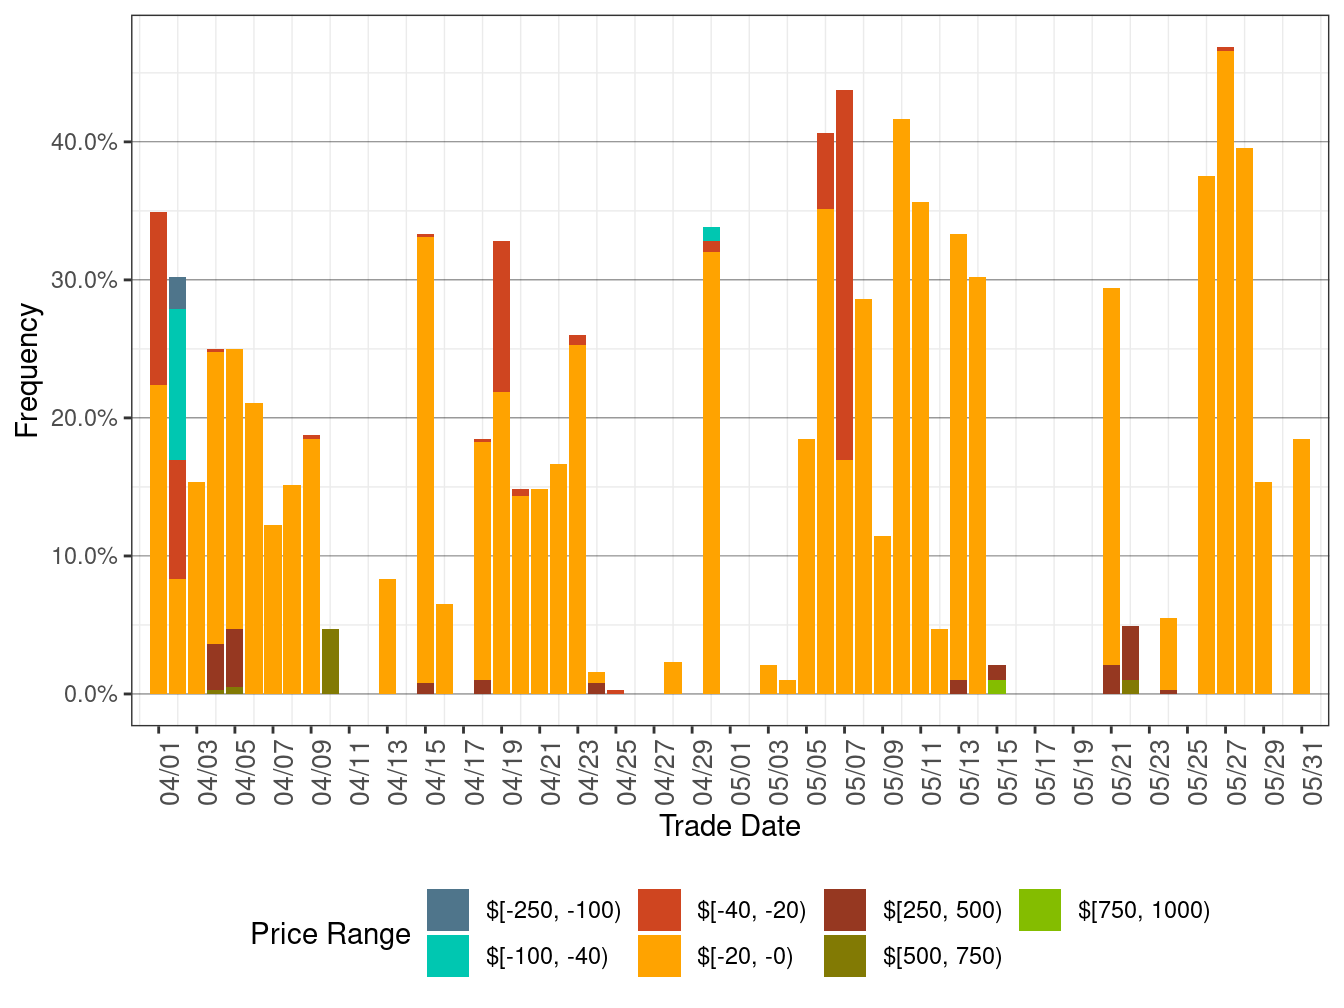
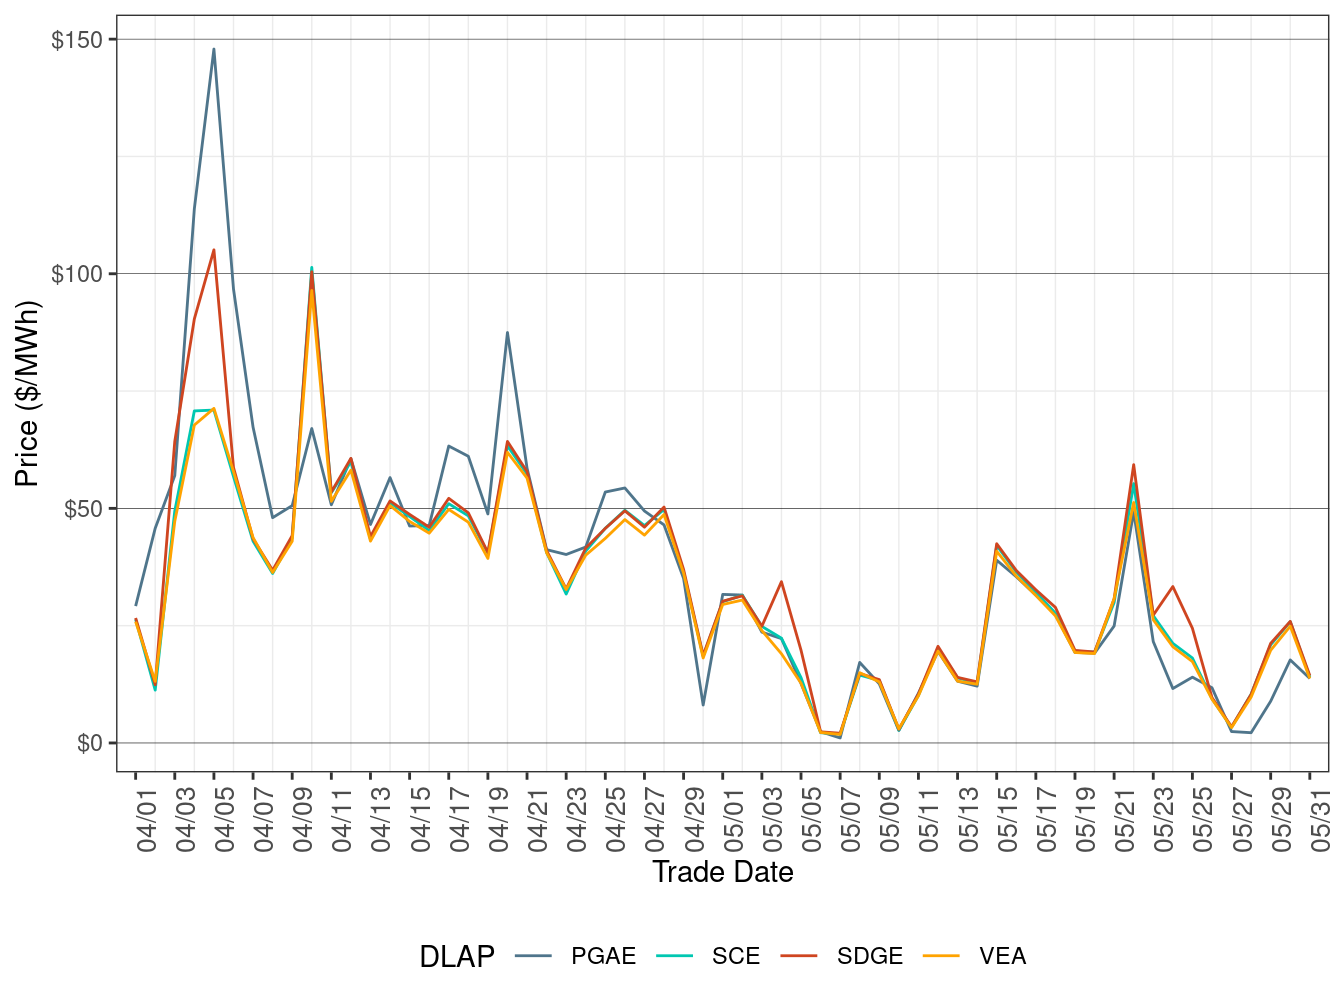
Figure 5 shows daily simple average prices for all the DLAPs (PG&E, SCE, SDG&E, and VEA) for all hours respectively in RTD.
RTD DLAP prices on average fell compared to the previous month, correlated with declining natural gas prices.
TABLE 5 below lists the binding constraints that resulted in relatively high or low DLAP prices on certain dates.
Figure 5: RTD Simple Average DLAP Prices (All Hours)
| DLAP | Dates | Transmission Constraint |
|---|---|---|
| SDGE | May 4-5 | AMASA DIFFICUL 230kV line; TL 50004 nomogram; CLER-LKE-KONOCTI6 60kV line |
| SDGE | May 24-25 | 7820_TL-50002_IV-NG-OUT_TDM nomogram |
Figure 6 below shows the daily frequency of positive price spikes and negative prices by price range for the DLAPs in RTD.
The cumulative frequency of prices above $250/MWh increased to 0.21 percent in May from 0.13 percent in the previous month, while the cumulative frequency of negative prices rose to 19.80 percent in May from 17.39 percent in the previous month, correlated with the increase in renewable generation curtailment.
Figure 6: Daily Frequency of RTD DLAP Positive Price Spikes and Negative Prices