3 Market Performance Metrics
Day-Ahead Prices
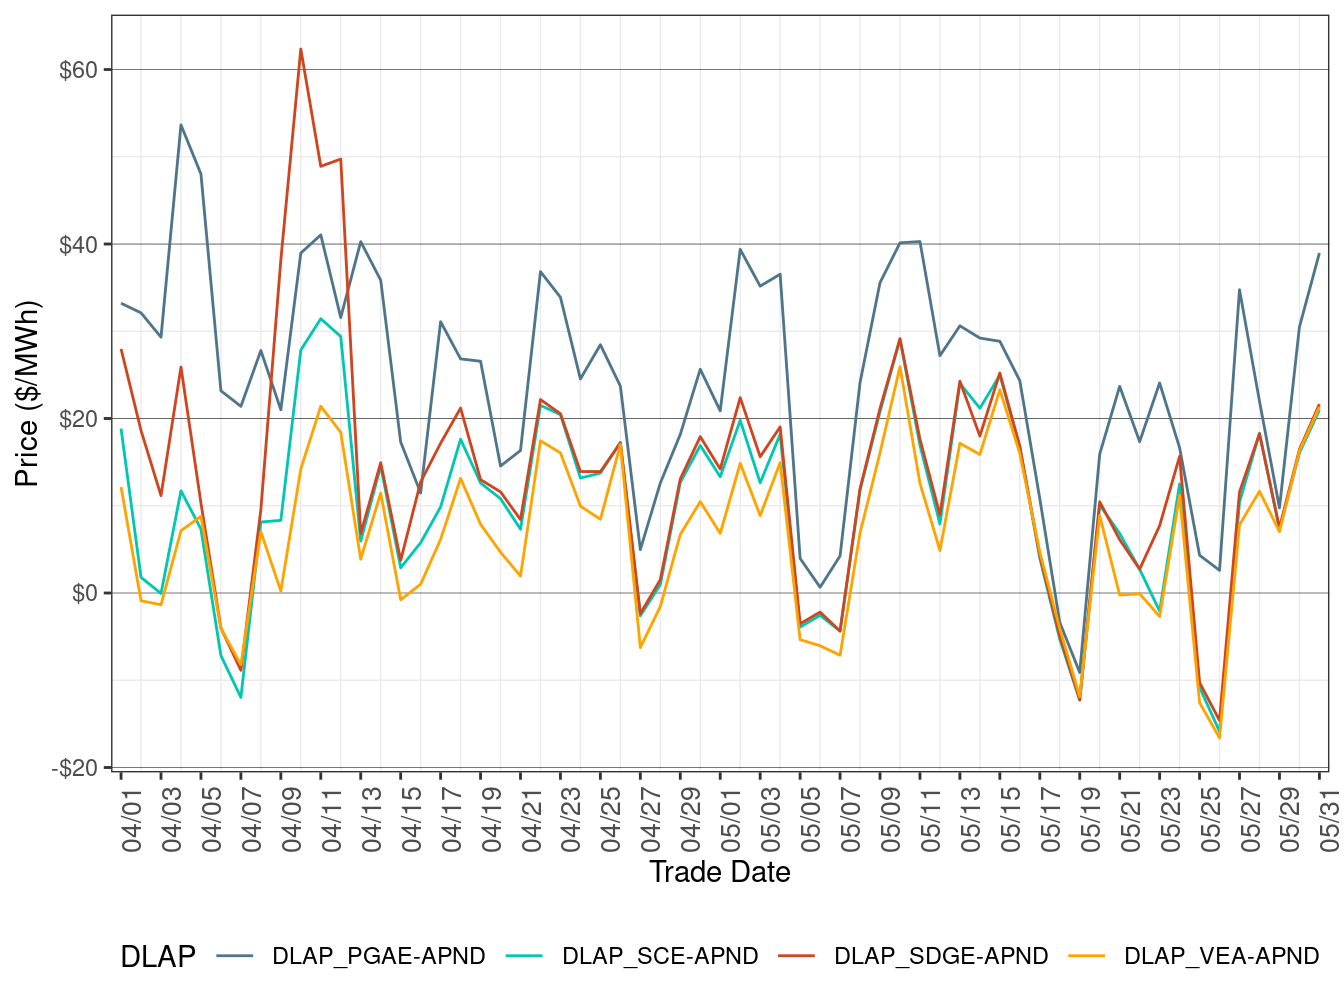
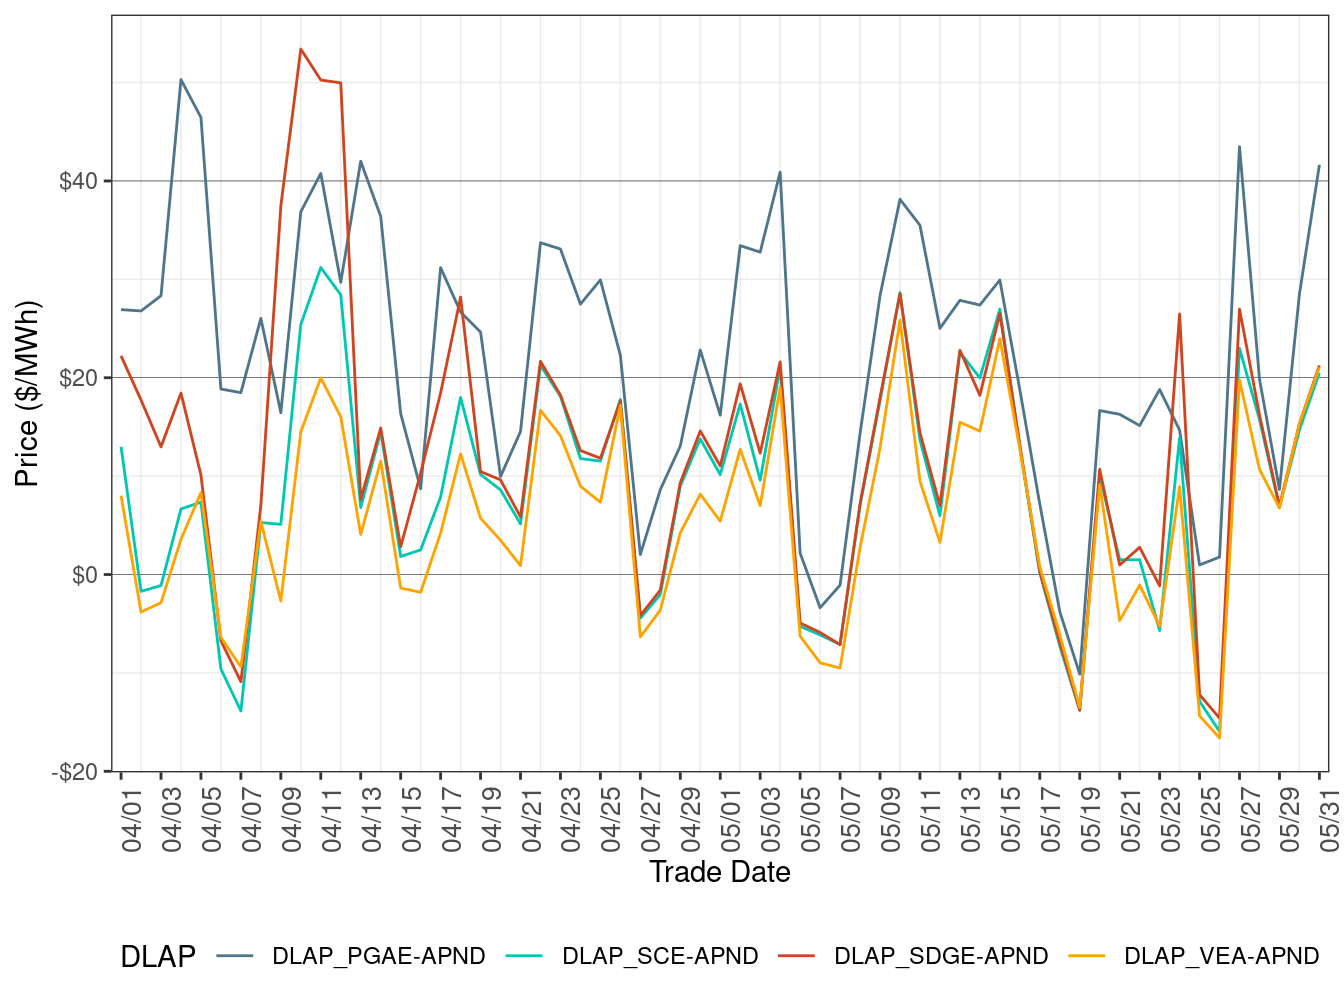
Figure 2 shows the daily simple average prices for all hours in IFM for each of the four default load-aggregation points (DLAP): PG&E, SCE, SDG&E, and VEA.
Day-Ahead DLAP prices on average decreased this month compared to April. All four DLAP LMPs fell in late May due to cooler weather.
TABLE 3 below lists the binding constraints that resulted in relatively high or low DLAP prices on certain dates.
Figure 2: IFM (Day-Ahead) Simple Average DLAP Prices (All Hours)
| DLAP LMPs Affected | Dates | Transmission Constraint |
|---|---|---|
| PGAE | May 1-5, 12 | MOSSLD-LASAGUIL-230kV line; GATES1-MIDWAY-500kV line |
| PGAE | May 6-9, 24-25 | MOSSLD-LASAGUIL-230kV line |
| PGAE | May 10-11 | MOSSLD-LASAGUIL-230kV line; LOSBANOS-PANOCHE-230kV line; PANOCHE-GATES-230kV line |
| PGAE | May 13-15 | MOSSLD-LASAGUIL-230kV line; GATES1-MIDWAY-500kV line; GATES1-GATES-500 XFMR |
| PGAE; SDGE | May 16 | MOSSLD-LASAGUIL-230kV line; GATES1-MIDWAY-500kV line; MIGUEL_BKs_MXFLW_NG nomogram |
| PGAE | May 17, 19-23, 26-29, 31 | MOSSLD-LASAGUIL-230kV line; LOSBANOS-GATES1-500kV line |
| PGAE | May 18, 30 | LOSBANOS-GATES1-500kV line |
Real-Time Price
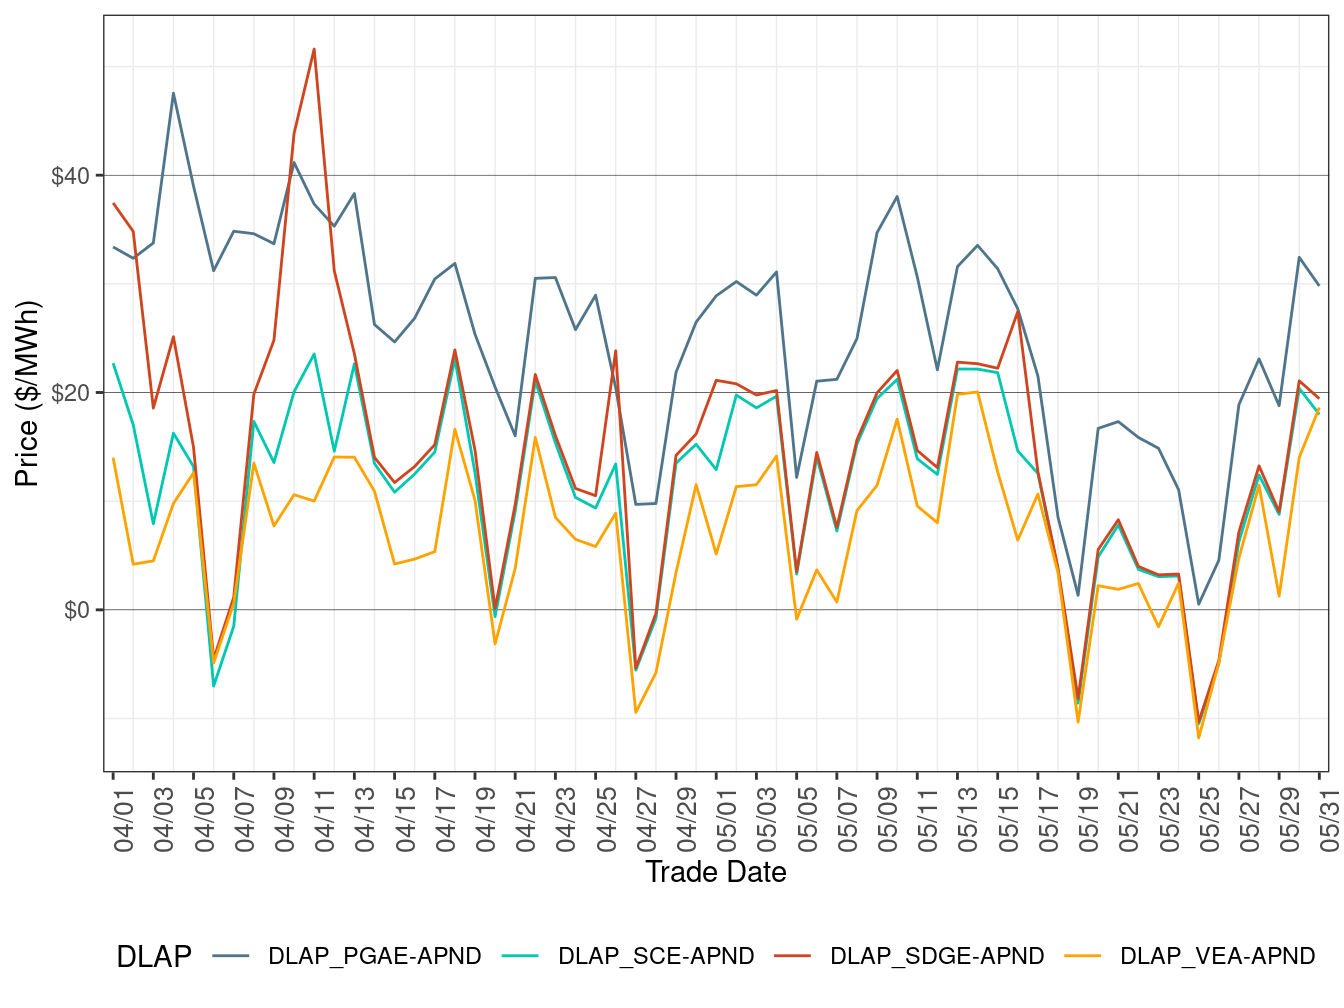
Figure 3 shows daily simple average prices for all four DLAPs (PG&E, SCE, SDG&E, and VEA) for all hours respectively in FMM.
FMM DLAP prices were generally quiet in May, on average decreasing compared to the previous month.
TABLE 4 below lists the binding constraints that resulted in relatively high or low DLAP prices on certain dates.
Figure 3: FMM Simple Average DLAP Prices (All Hours)
| DLAP LMPs Affected | Dates | Transmission Constraint |
|---|---|---|
| PGAE | May 2 | LOSBANOS-GATES1-500kV line; GATES1-GATES-500 XFMR |
| PGAE | May 3 | LOSBANOS-GATES1-500kV line; GATES1-GATES-500 XFMR; GATES1-MIDWAY-500kV line |
| PGAE | May 4 | LOSBANOS-GATES1-500kV line; GATES1-MIDWAY-500kV line; MOSSLD-LASAGUIL-230kV line |
| PGAE | May 9, 22-23, 30-31 | MOSSLD-LASAGUIL-230kV line |
| PGAE | May 10 | MOSSLD-LASAGUIL-230kV line; GATES2-MIDWAY-500kV line |
| PGAE | May 11-12 | LOSBANOS-GATES1-500kV line |
| PGAE | May 21 | DEVERS-CALCAPS2-500kV line |
| PGAE | May 25-27 | MOSSLD-LASAGUIL-230kV line; LOSBANOS-GATES1-500kV line |
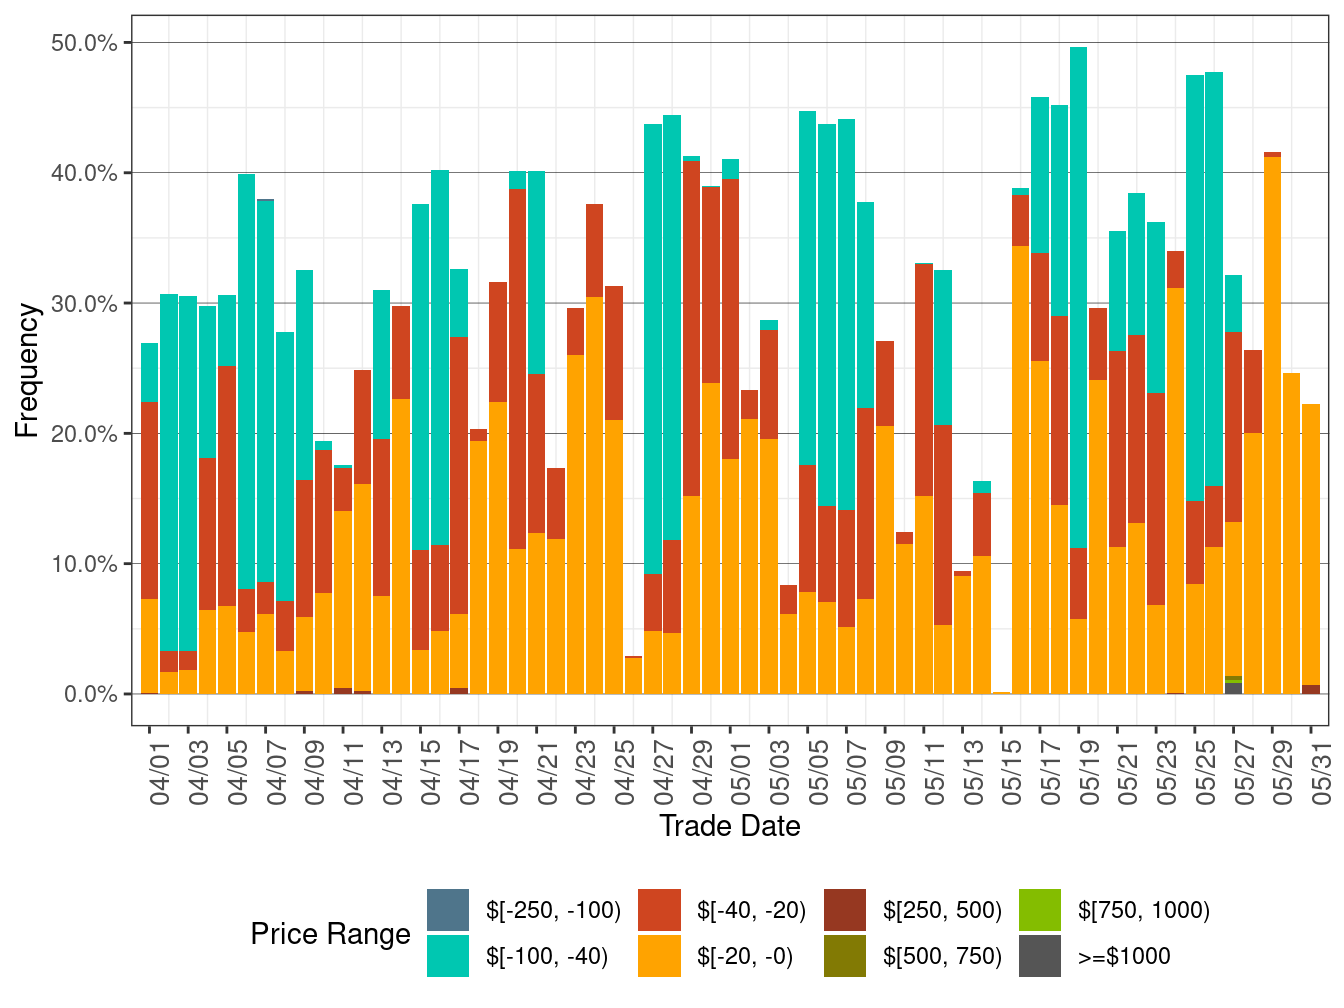
Figure 4 below shows the daily frequency of positive price spikes and negative prices by price range for the DLAPs in the FMM.
The cumulative frequency of prices in FMM above $250/MWh stayed at 0.01 percent in May compared to the previous month, while the cumulative frequency of negative prices edged up to 30.95 percent in May from 30.26 percent in the previous month.
Figure 4: Daily Frequency of FMM DLAP Positive Price Spikes and Negative Prices
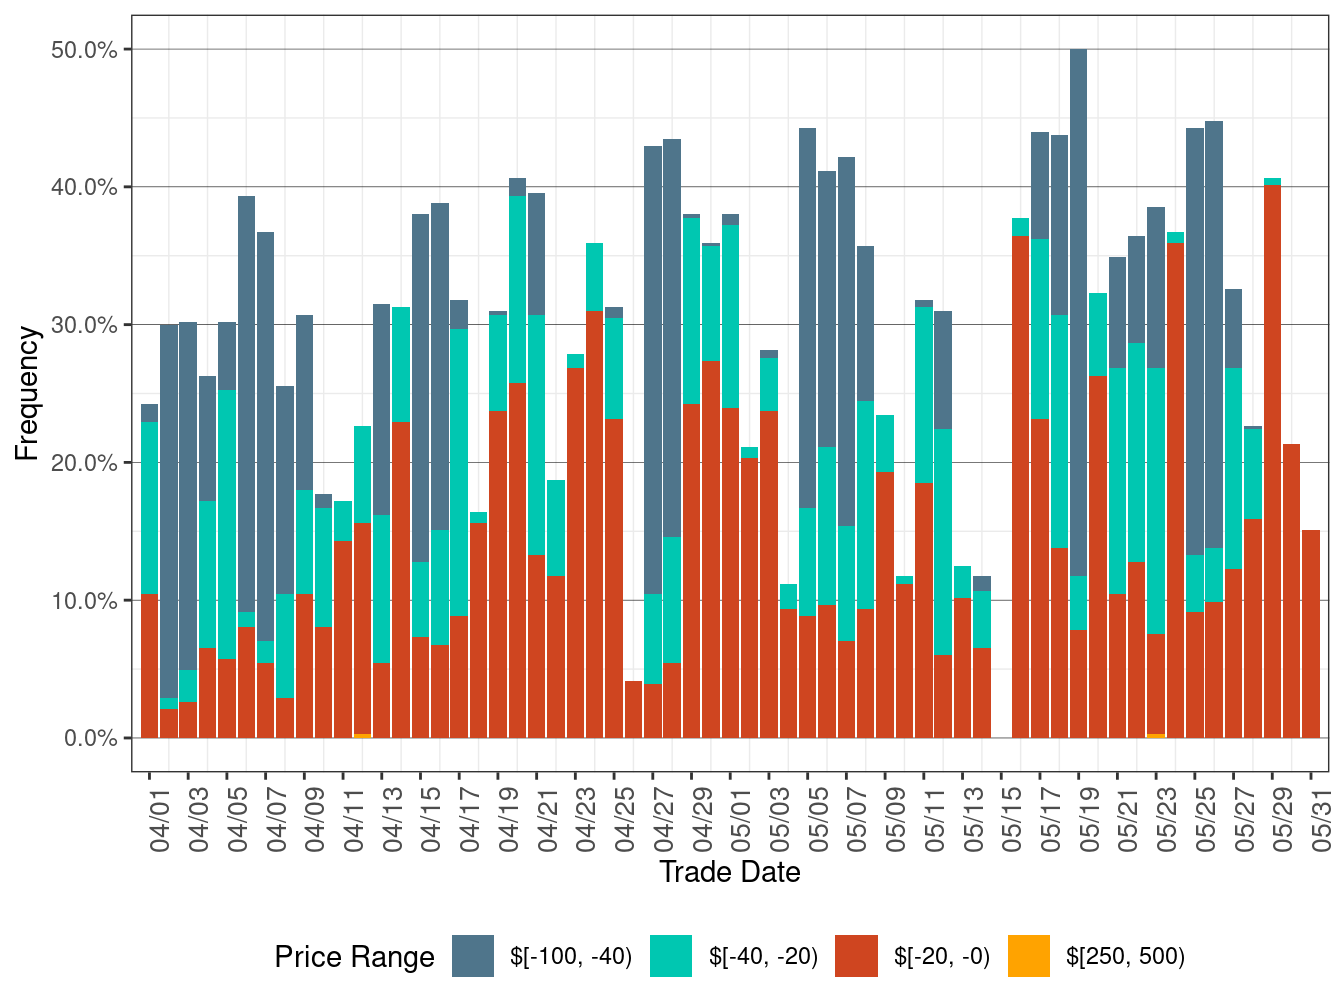
Figure 5 shows daily simple average prices for all the DLAPs (PG&E, SCE, SDG&E, and VEA) for all hours respectively in RTD.
RTD DLAP prices were generally quiet in May, on average decreasing compared to April.
TABLE 5 below lists the binding constraints that resulted in relatively high or low DLAP prices on certain dates.
Figure 5: RTD Simple Average DLAP Prices (All Hours)
| DLAP LMPs Affected | Dates | Transmission Constraint |
|---|---|---|
| PGAE | May 2 | LOSBANOS-GATES1-500kV line; GATES1-GATES-500 XFMR |
| PGAE | May 3 | LOSBANOS-GATES1-500kV line; GATES1-GATES-500 XFMR; GATES1-MIDWAY-500kV line |
| PGAE | May 4 | MOSSLD-LASAGUIL-230kV line; GATES1-MIDWAY-500kV line |
| PGAE | May 11 | LOSBANOS-GATES1-500kV line |
| PGAE | May 12, 26-27 | MOSSLD-LASAGUIL-230kV line; LOSBANOS-GATES1-500kV line |
| PGAE | May 23, 30-31 | MOSSLD-LASAGUIL-230kV line |
| SDGE | May 24 | 7820_TL 230S_OVERLOAD_NG nomogram |
Figure 6 below shows the daily frequency of positive price spikes and negative prices by price range for the DLAPs in RTD.
The cumulative frequency of prices in RTD above $250/MWh increased slightly to 0.07 percent in May from 0.05 percent in the previous month, while the cumulative frequency of negative prices inced up to 32.13 percent in May from 31.26 percent in the previous month.
Figure 6: Daily Frequency of RTD DLAP Positive Price Spikes and Negative Prices