3 Market Performance Metrics
Day-Ahead Prices
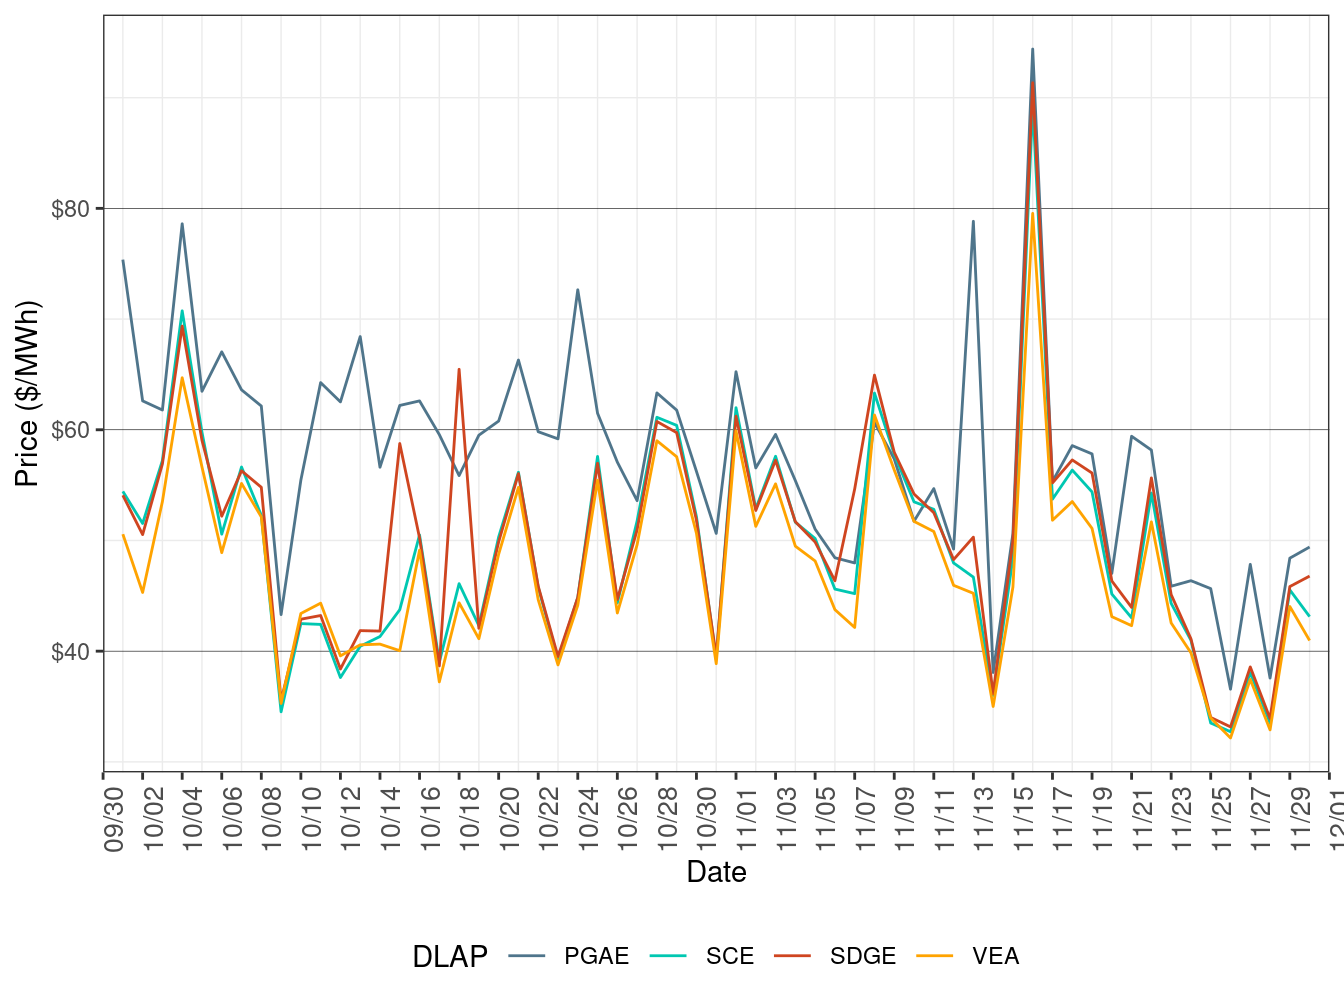
Figure 2 show the daily simple average load-aggregation points (LAP) prices for each of the four default LAPs (PG&E, SCE, SDG&E, and VEA) for all hours. Table 2 below lists the binding constraints along with the associated DLAP locations and the dates when the binding constraints resulted in relatively high or low DLAP prices.
Figure 2: Day-Ahead Simple Average LAP Prices (All Hours)
| DLAP | Dates | Transmission Constraint |
|---|---|---|
| PGAE | November 24-28 | PANOCHE-GATES-230 kV line |
Real-Time Price
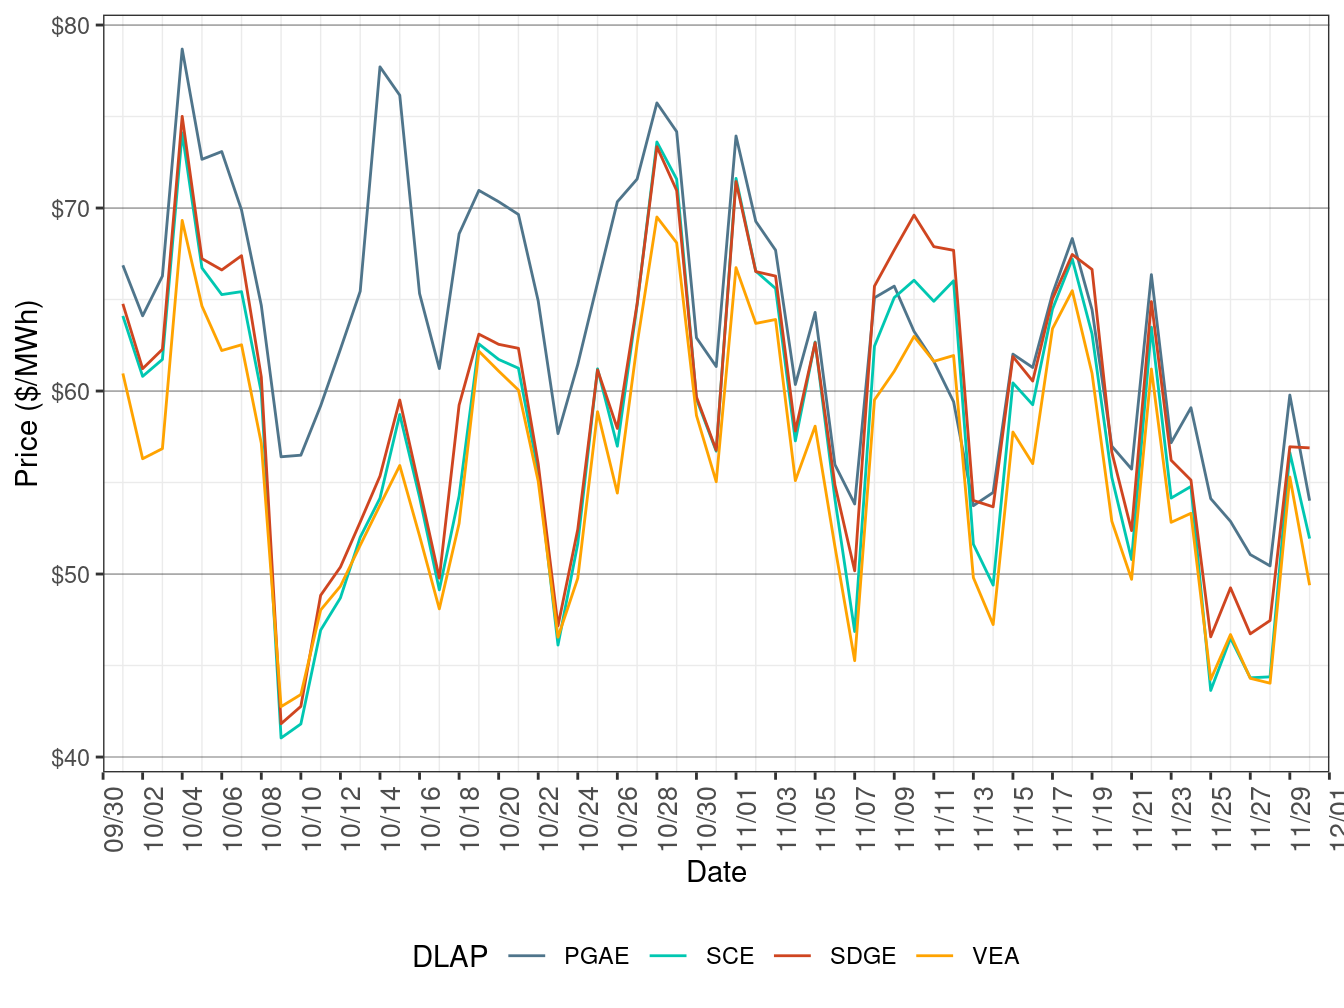
Figure 3 show daily simple average LAP prices for all the default LAPs (PG&E, SCE, SDG&E, and VEA) for all hours respectively in FMM. Table 3 lists the binding constraints along with the associated DLAP locations and the dates when the binding constraints resulted in relatively high or low DLAP prices.
Figure 3: FMM Simple Average LAP Prices (All Hours)
| DLAP | Dates | Transmission Constraint |
|---|---|---|
| PGAE | November 21 | GATES-MIDWAY 500 kV XFMR |
| PGAE | November 25, 27 | PANOCHE-GATES-230 kV line |
| PGAE | November 30 | COTTNWD-ROUND MT-230 kV line |
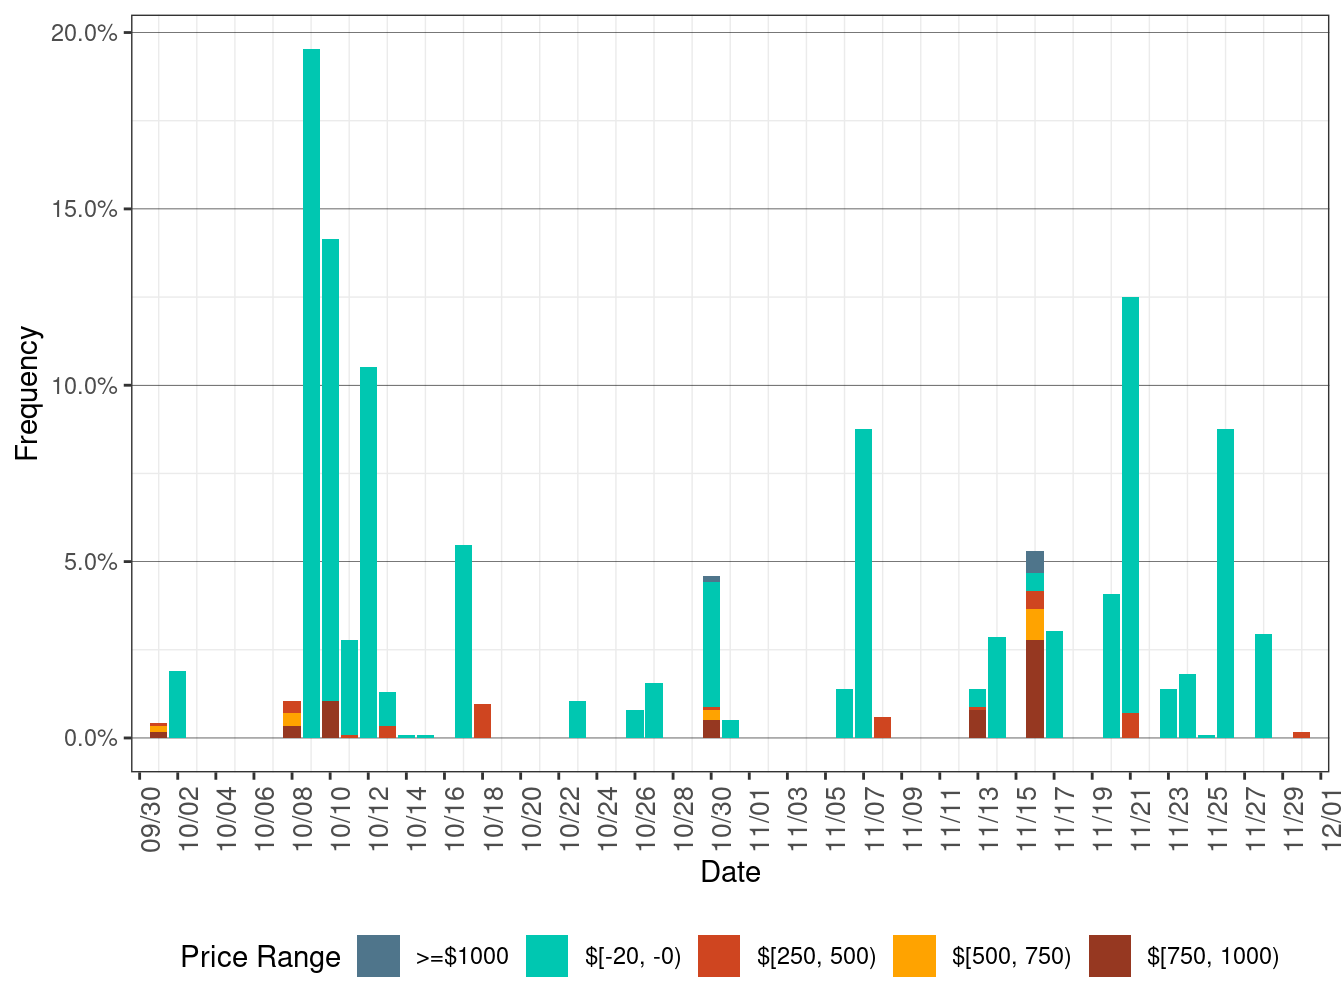
Figure 4 below shows the daily frequency of positive price spikes and negative prices by price range for the default LAPs in the FMM. The cumulative frequency of prices above $250/MWh edged down to 0.22 percent in November from 0.33 percent in October. The cumulative frequency of negative prices increased to 0.52 percent in November from 0.47 percent in October.
Figure 4: Daily Frequency of FMM LAP Positive Price Spikes and Negative Prices
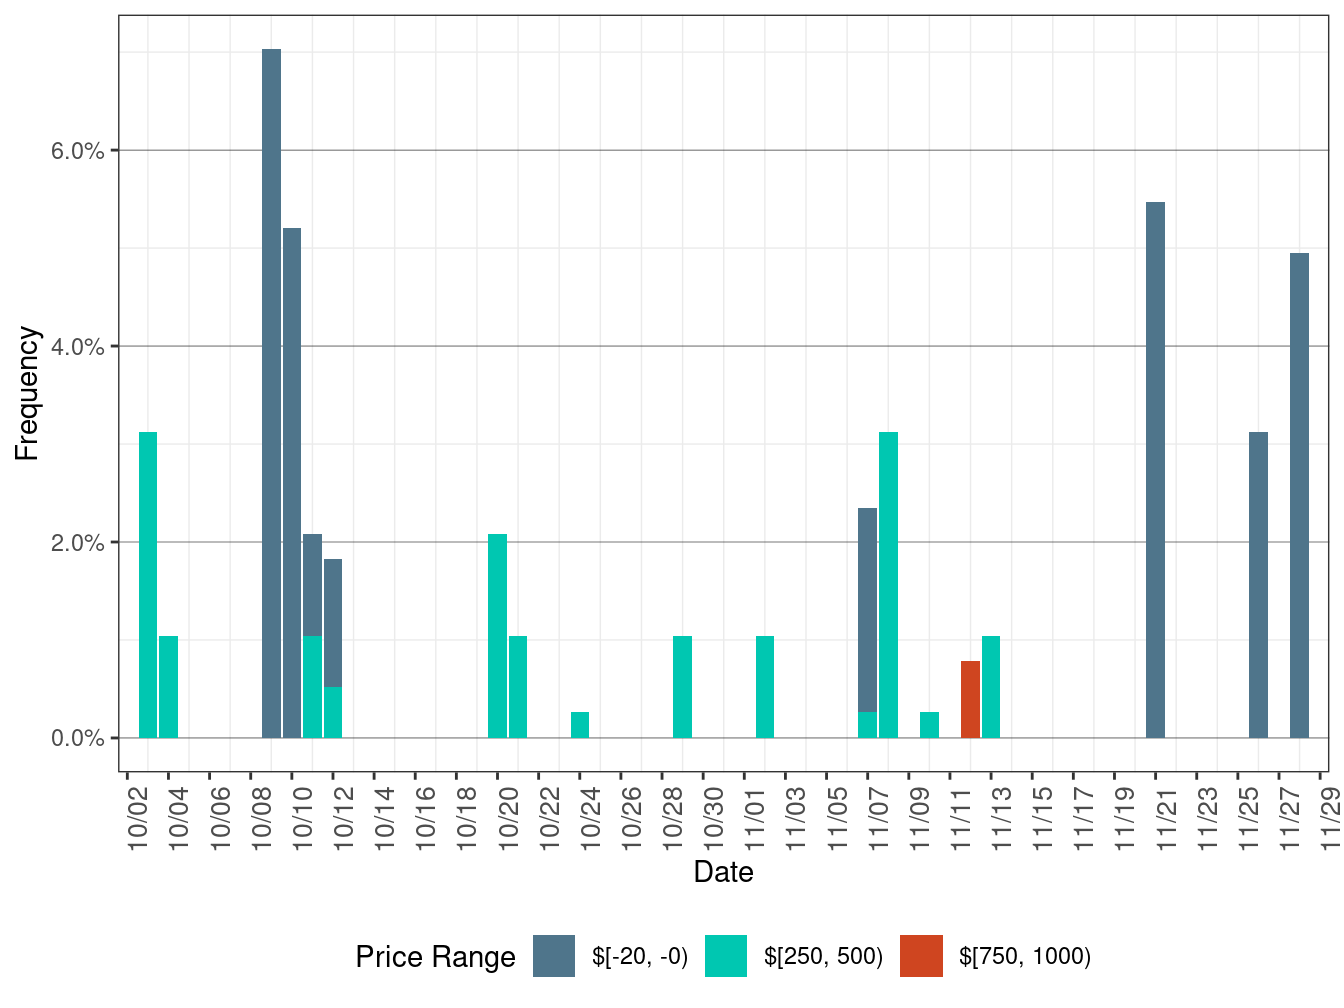
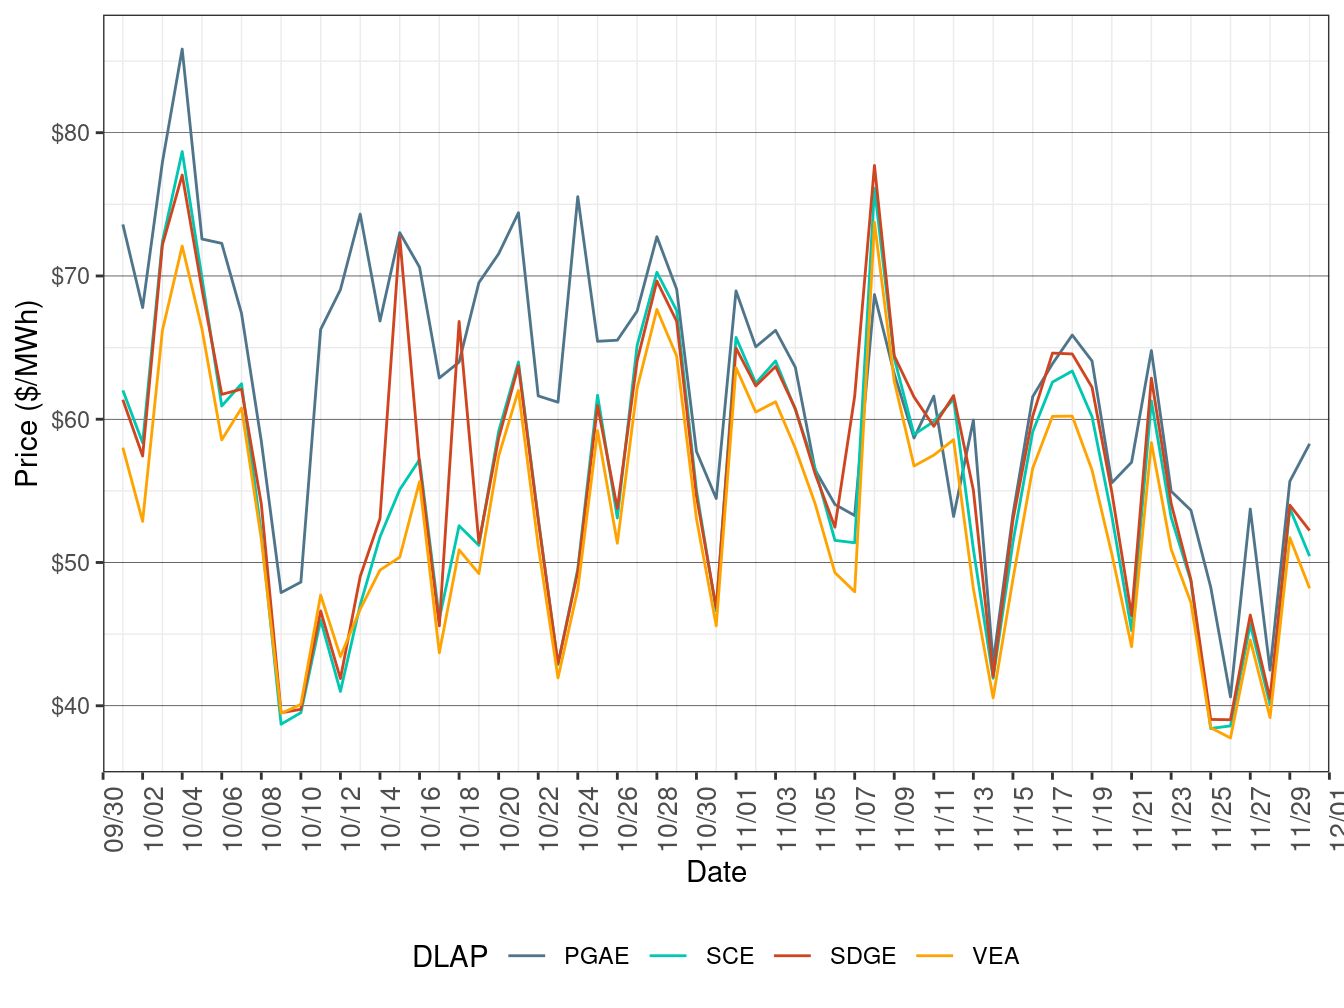
Figure 5 show daily simple average LAP prices for all the default LAPs (PG&E, SCE, SDG&E, and VEA) for all hours respectively in RTD. TABLE 4 lists the binding constraints along with the associated DLAP locations and the dates when the binding constraints resulted in relatively high or low DLAP prices. On November 16, all four DLAP prices were elevated due to renewable deviation.
Figure 5: RTD Simple Average LAP Prices (All Hours)
| DLAP | Dates | Transmission Constraint |
|---|---|---|
| PGAE | November 13 | GATES1-MIDWAY-500 kV line |
Figure 4 below shows the daily frequency of positive price spikes and negative prices by price range for the default LAPs in RTD. The cumulative frequency of prices above $250/MWh rose to 0.24 percent in November from 0.16 percent in October. The cumulative frequency of negative prices inched down to 1.60 percent in November from 1.99 percent in October.
Figure 6: Daily Frequency of RTD LAP Positive Price Spikes and Negative Prices