3 Market Performance Metrics
Day-Ahead Prices
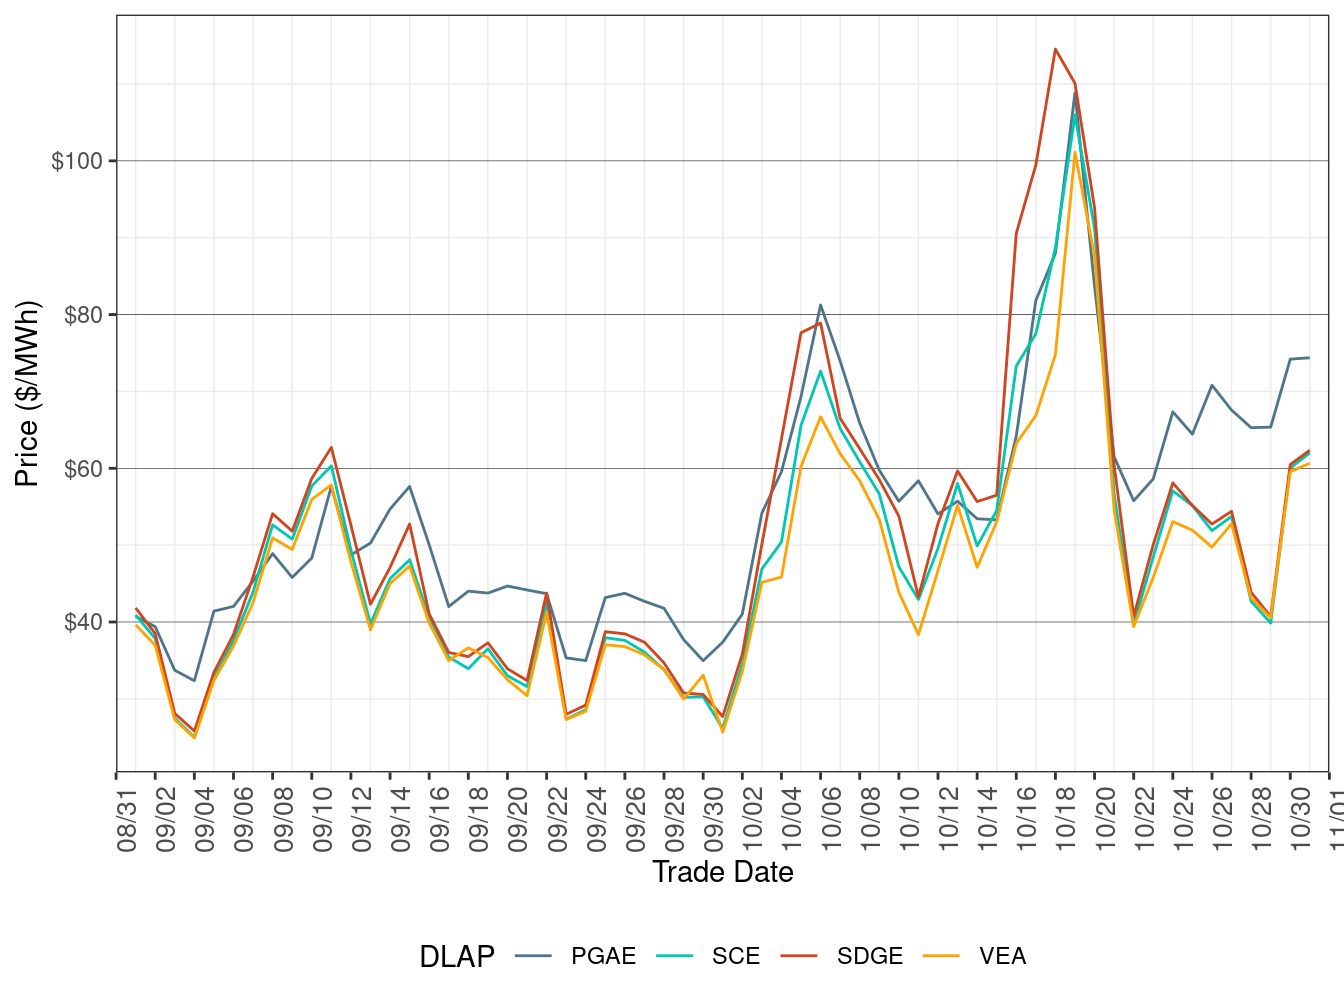
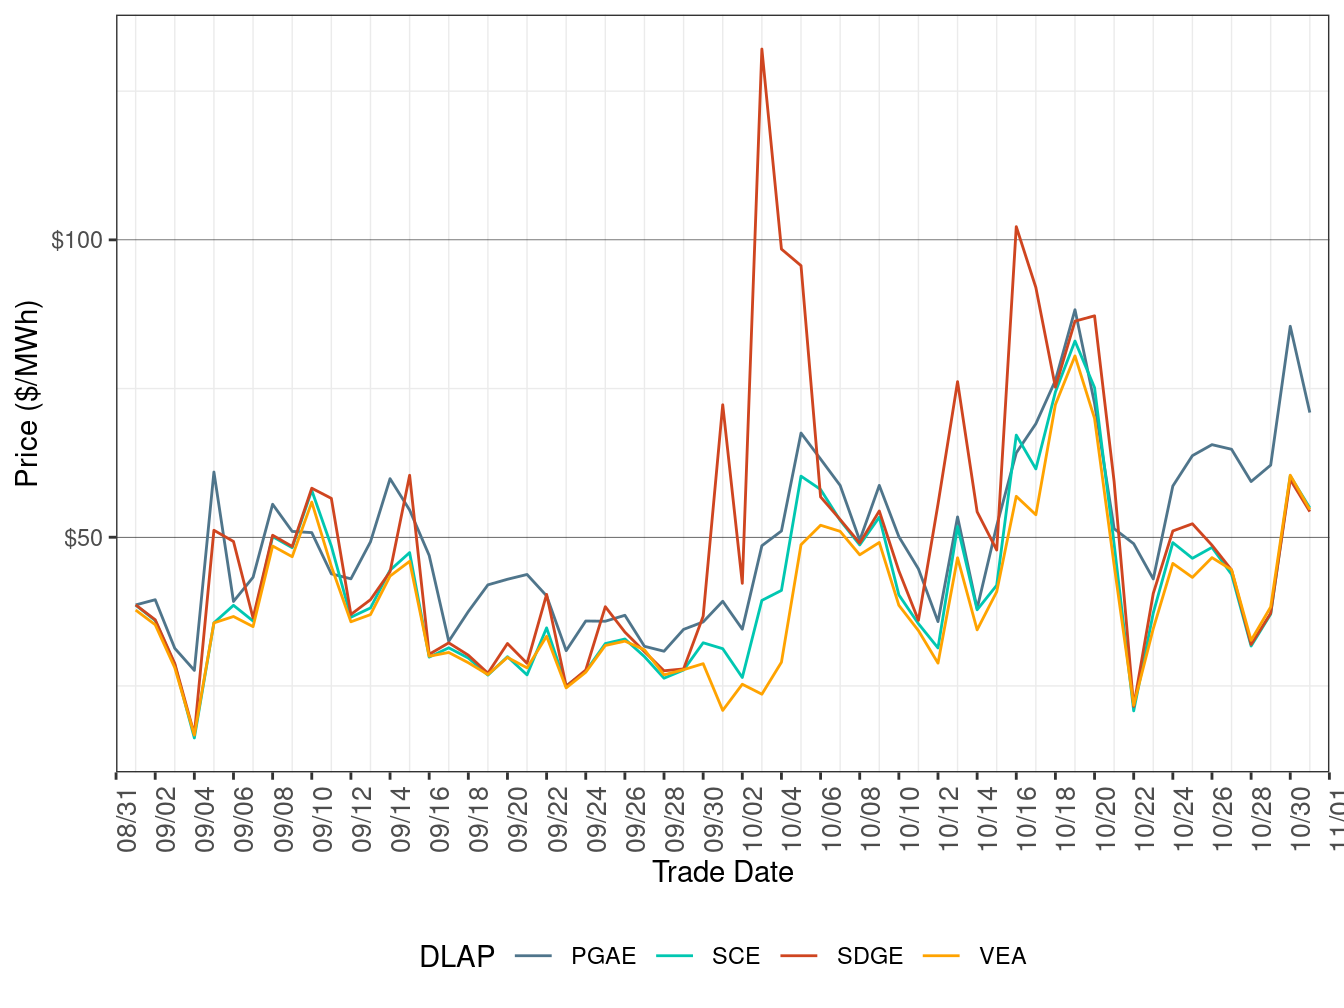
Figure 2 shows the daily simple average prices for all hours in IFM for each of the four default load-aggregation points (DLAP): PG&E, SCE, SDG&E, and VEA.
Day-Ahead DLAP prices on average increased compared to the previous month and were more volatile, correlated with rising natural gas prices.
TABLE 3 below lists the binding constraints that resulted in relatively high or low DLAP prices on certain dates.
Figure 2: IFM (Day-Ahead) Simple Average DLAP Prices (All Hours)
| DLAP LMPs Affected | Dates | Transmission Constraint |
|---|---|---|
| All | October 2-10 | GATES1-MIDWAY-500kV line; MOSSLD-LASAGUIL-230kV line; IBM HR J-METCALF-115kV line; WIRLWIND-WIRLWIND-500 XFMR; VICTOR-LUGO-230kV line; PANOCHE-GATES-230kV line; 7820_TL23040_IV_SPS_NG nomogram |
| PGAE | October 11 | TESLA-LOSBANOS-500kV line |
| All | October 12-13 | TESLA-LOSBANOS-500kV line; WIRLWIND-WIRLWIND-500 XFMR; 6410_CP1_NG nomogram; WIRLWIND-WIRLWIND-500 XFMR; VICTOR-LUGO-230kV line |
| PGAE | October 21-23 | 7820_TL23040_IV_SPS_NG nomogram; GATES1-MIDWAY-500kV line; TESLA-LOSBANOS-500kV line; DEVERS-DEVERS-500 XFMR |
| All | October 24 | DEVERS-DEVERS-500 XFMR |
| PGAE | October 25-29 | DEVERS-DEVERS-500 XFMR; TESLA-LOSBANOS-500kV line; OMS_14196425_WHIRWD_CB6092 nomogram; GATES1-MIDWAY-500kV line |
| All | October 30-31 | TESLA-LOSBANOS-500kV line |
Real-Time Price
Figure 3 shows daily simple average prices for all four DLAPs (PG&E, SCE, SDG&E, and VEA) for all hours respectively in FMM.
FMM DLAP prices on average increased compared to the previous month and were more volatile, correlated with rising natural gas prices.
TABLE 4 below lists the binding constraints that resulted in relatively high or low DLAP prices on certain dates.
Figure 3: FMM Simple Average DLAP Prices (All Hours)
| DLAP LMPs Affected | Dates | Transmission Constraint |
|---|---|---|
| SDGE | October 1-2 | OMS_14330422_Miguel_BK81 nomogram; PANOCHE-GATES-230kV line; 7820_TL-50002_IV-NG-OUT_TDM nomogram; GATES1-MIDWAY-500kV line |
| SDGE | October 3-4 | 7820_TL-50002_IV-NG-OUT_TDM nomogram |
| All | October 5-6 | 7820_TL-50002_IV-NG-OUT_TDM nomogram; WIRLWIND-WIRLWIND-500 XFMR |
| All | October 13 | 7820_TL 230S_OVERLOAD_NG nomogram |
| All | October 15-21 | 7820_TL 230S_OVERLOAD_NG nomogram; LOSBANOS-GATES1-500kV line; MOSSLD-LASAGUIL-230kV line; OMS-14204875-ML_BK80_NG nomogram; MIGUEL-MIGUEL-230 XFMR; OMS_14168328_IV-SX_OUTAGE_NG nomogram; MIGUEL_BKs_MXFLW_NG nomogram; 32950_PITSBURG_115_30527_PITSBRG-_230_XF_13 line |
| PGAE | October 22 | GATES1-MIDWAY-500kV line |
| All | October 23-24 | DEVERS-DEVERS-500 XFMR; MOSSLD-LASAGUIL-230kV line |
| PGAE | October 25-29 | 7820_TL 230S_OVERLOAD_NG nomogram; GATES1-MIDWAY-500kV line; DEVERS-DEVERS-500 XFMR; LOSBANOS-GATES1-500kV line |
| All | October 30-31 | LOSBANOS-GATES1-500kV line; TESLA-LOSBANOS-500kV line |
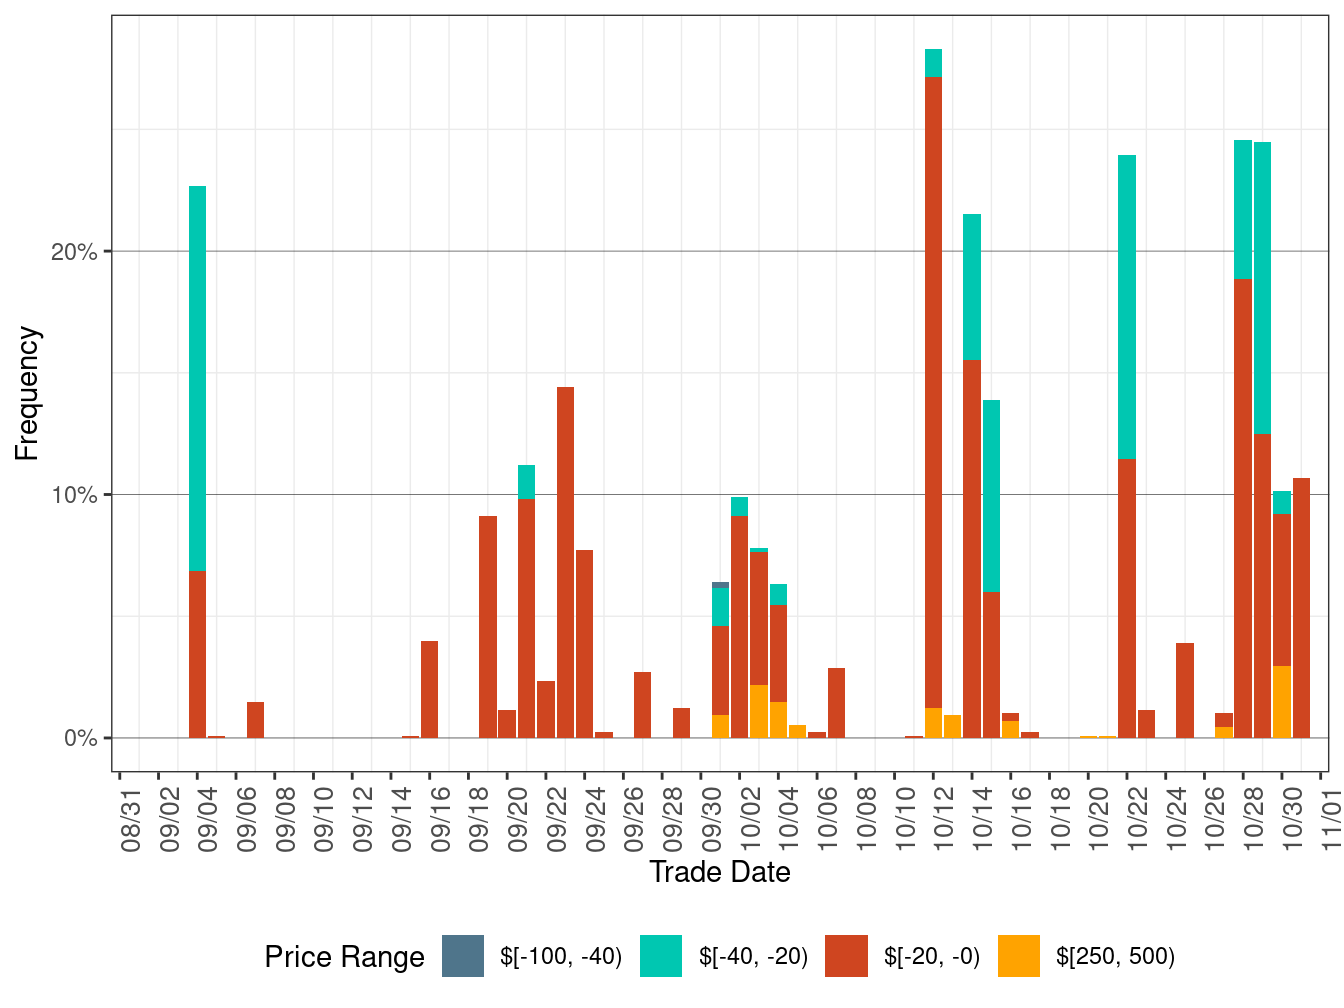
Figure 4 below shows the daily frequency of positive price spikes and negative prices by price range for the DLAPs in the FMM.
The cumulative frequency of prices in FMM above $250/MWh increased to 0.55 percent in October from 0.24 percent in the previous month, while the cumulative frequency of negative prices increased to 4.92 percent in October from 1.42 percent in the previous month, correlated with the increase in renewable curtailment.
Figure 4: Daily Frequency of FMM DLAP Positive Price Spikes and Negative Prices
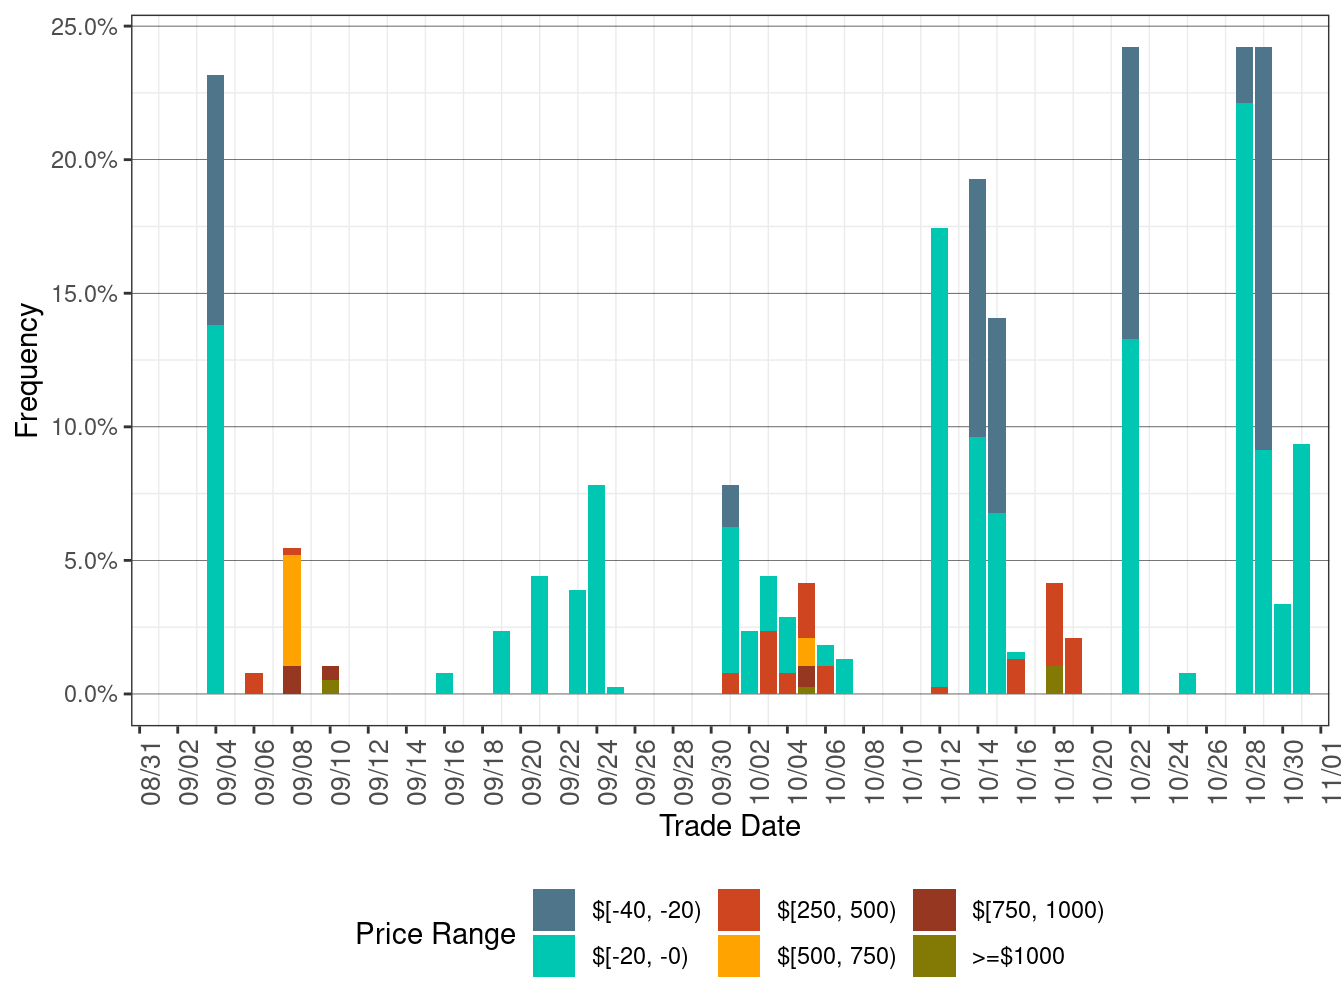
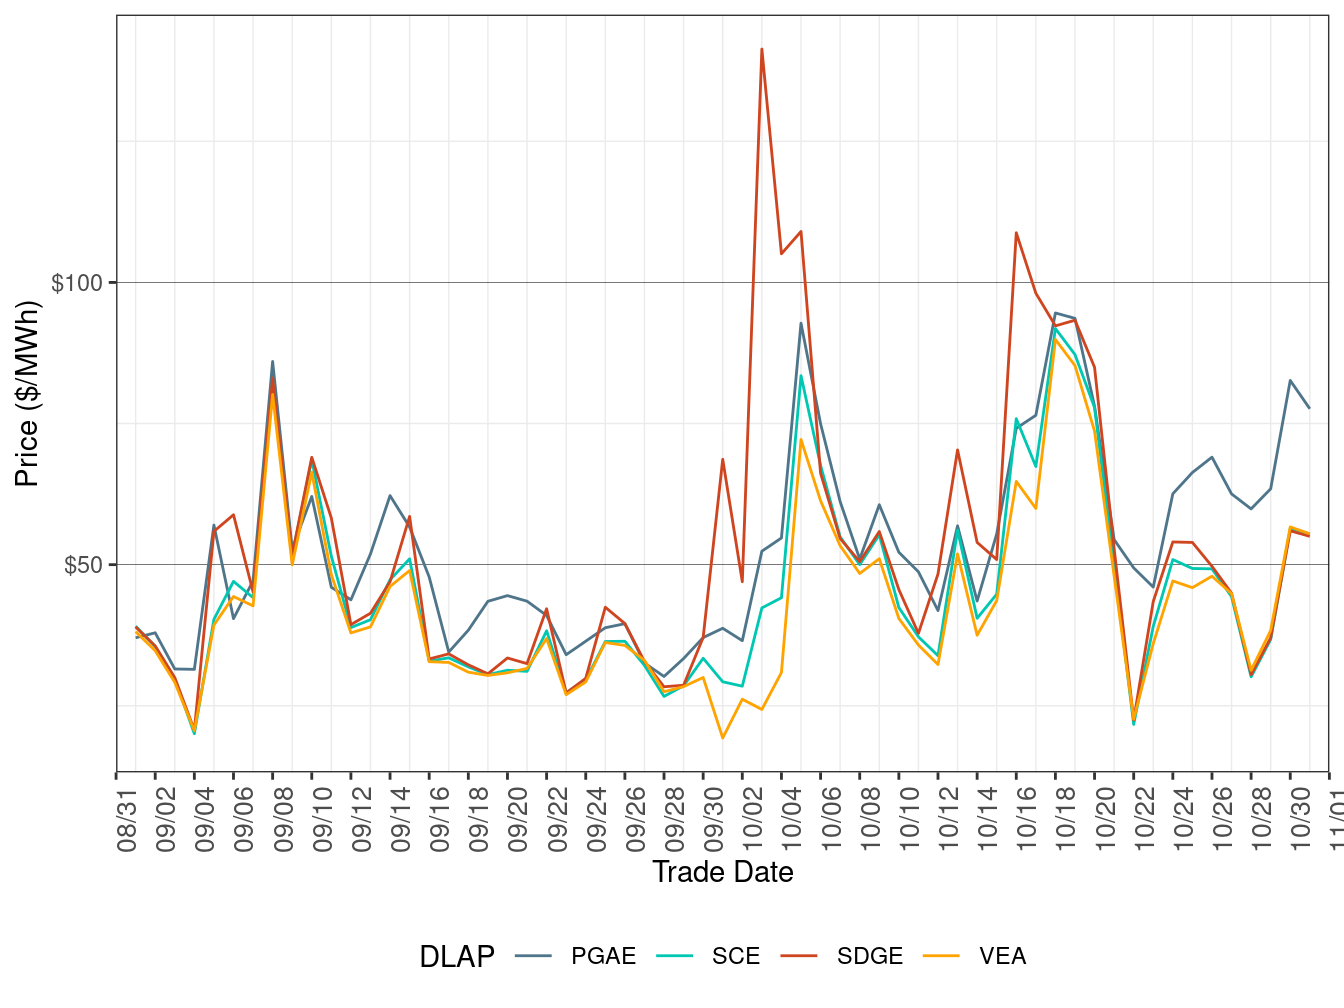
Figure 5 shows daily simple average prices for all the DLAPs (PG&E, SCE, SDG&E, and VEA) for all hours respectively in RTD.
RTD DLAP prices on average increased compared to the previous month and were more volatile, correlated with rising natural gas prices.
TABLE 5 below lists the binding constraints that resulted in relatively high or low DLAP prices on certain dates.
Figure 5: RTD Simple Average DLAP Prices (All Hours)
| DLAP | Dates | Transmission Constraint |
|---|---|---|
| SDGE | October 1 | OMS_14330422_Miguel_BK81 nomogram; PANOCHE-GATES-230kV line |
| SDGE | October 3-5 | 7820_TL 50002_IV-NG-OUT_TDM nomogram |
| All | October 13 | 7820_TL 230S_OVERLOAD_NG nomogram |
| SDGE | October 16-17 | OMS-14204875-ML_BK80_NG nomogram; MIGUEL-MIGUEL-230 XFMR; OMS_14168328_IV-SX_OUTAGE_NG nomogram; MIGUEL_BKs_MXFLW_NG nomogram |
| All | October 18-20 | 7820_TL23040_IV_SPS_NG nomogram; 30750_MOSSLD–_230_30797_LASAGUIL_230_BR_1-_1 line; 7820_TL 230S_OVERLOAD_NG nomogram |
| PGAE | October 22 | GATES1-MIDWAY-500kV line |
| PGAE | October 24-29 | DEVERS-DEVERS-500 XFMR; 7820_TL 230S_OVERLOAD_NG nomogram; LOSBANOS-GATES1-500kV line; GATES1-MIDWAY-500kV line |
| All | October 30-31 | LOSBANOS-GATES1-500kV line; TESLA-LOSBANOS-500kV line |
Figure 6 below shows the daily frequency of positive price spikes and negative prices by price range for the DLAPs in RTD.
The cumulative frequency of prices in RTD above $250/MWh increased to 0.37 percent in October from 0.00 percent in the previous month, while the cumulative frequency of negative prices increased to 6.09 percent in October from 2.61 percent in the previous month, correlated with the increase in renewable generation curtailment.
Figure 6: Daily Frequency of RTD DLAP Positive Price Spikes and Negative Prices