Section 5 Congestion Revenue Rights
Congestion Revenue Rights are a financial tool developed for the purpose of allowing load and exports to hedge against congestion charges paid when congestion occurs on a transmission line (aka congestion rents as was described in the previous section). If the congestion occurs in the same direction the CRR is held for the CRR holder is paid, but the CRR holder may have an obligation to pay if congestion occurs in the opposite direction.
Congestion revenue rights auction efficiency 1B became effective on January 1, 2019. It includes key changes related to the congestion revenue rights settlements process:
- Targeted reduction of congestion revenue rights payouts on a constraint by constraint basis.
- Distribute congestion revenues to the extent that CAISO collected the requisite revenue on the constraint over the month. That is, implement a pro-rata funding for CRRs.
- Allow surpluses on one constraint in one hour to offset deficits on the same constraint in another hour over the course of the month.
- Only distribute surpluses to congestion revenue rights if the surplus is collected on a constraint that the congestion revenue right accrued a deficit, and only up to the full target payment value of the congestion revenue right.
- Distribute remaining surplus revenue at the end of the month, which are associated with constraints that collect more surplus over the month than deficits, to measured demand.
Monthly CRR Revenue
Figure 5.1 illustrates the daily CRR notional value in the corresponding month for the various transmission elements that experienced congestion during the month. CRR notional value is calculated as the product of CRR implied flow (MW) and constraint shadow price ($/MWh) in each hour per constraint and CRR.
Figure 5.1: Daily CRR Notional Value by Transmission Element
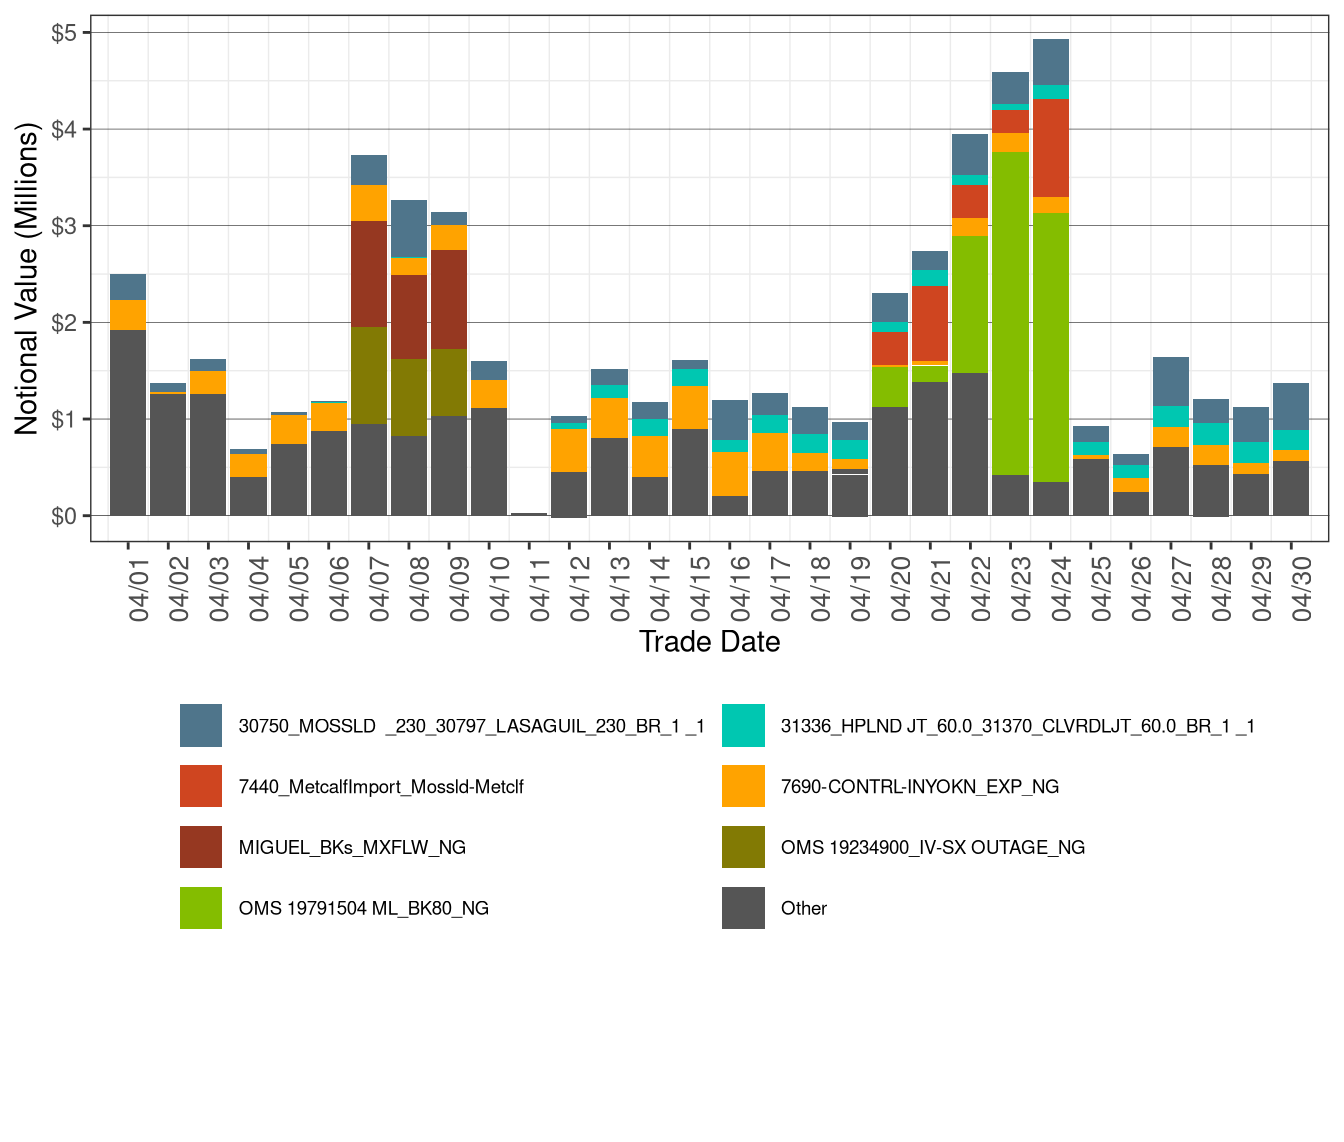
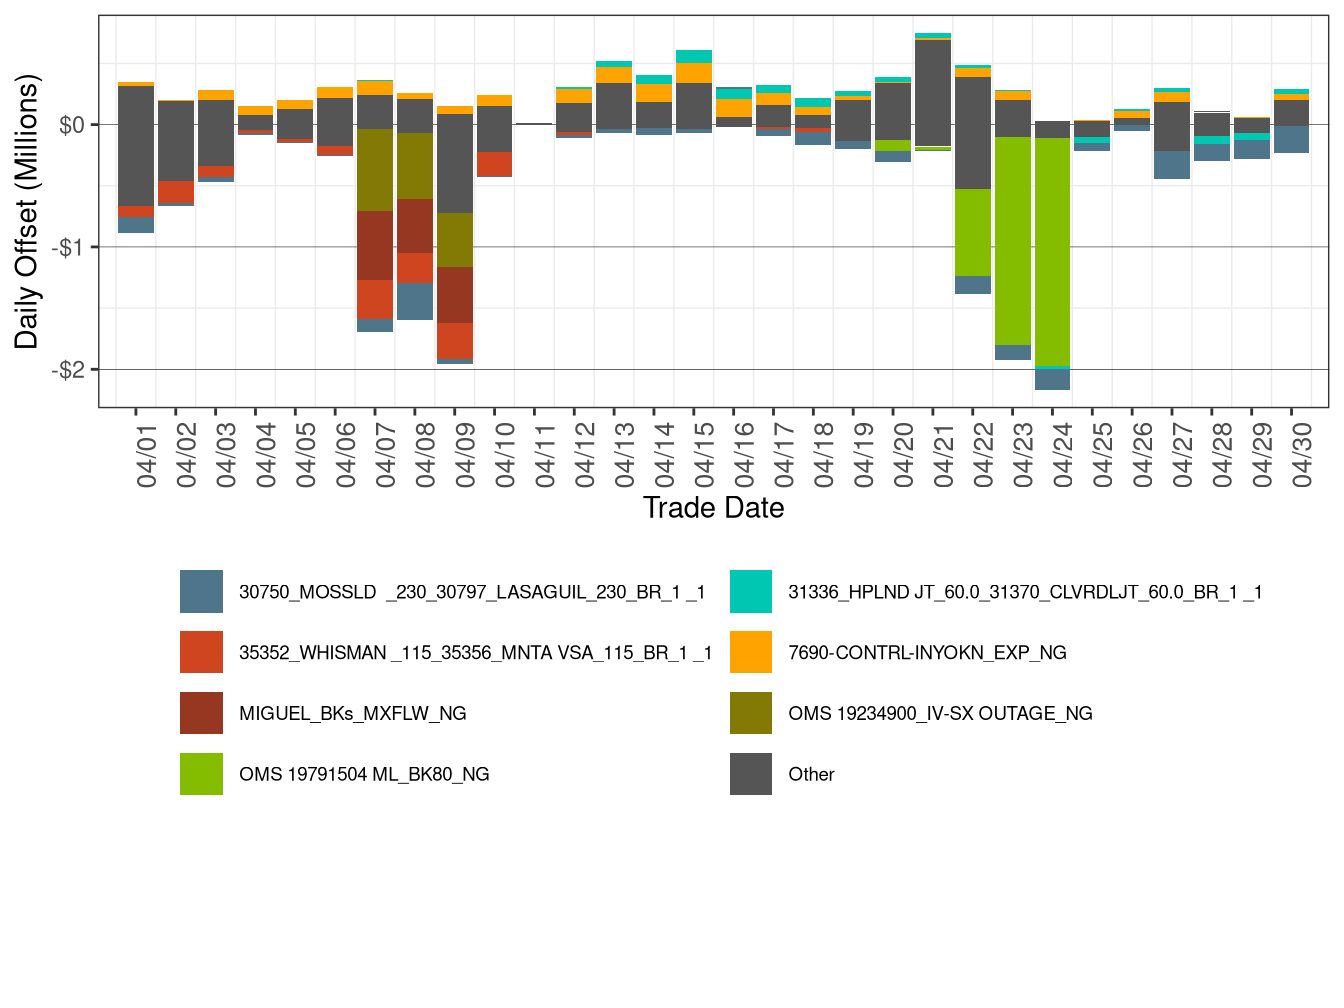
Figure 5.2 illustrates the daily CRR offset value in the corresponding month for the transmission elements that experienced congestion during the month. CRR offset value is the difference between the revenue collected from the congestion and the CRR notional value. A positive CRR offset value represents surplus and a negative CRR offset value represents shortfall.
As shown below, table 5.1 shows the percentage of monthly CRR deficit by transmission element and Table 5.2 shows the percentage of monthly CRR surplus by transmission element.
Figure 5.2: Daily CRR Offset Value by Transmission Element
| Constraint | Percent |
|---|---|
| OMS 19791504 ML_BK80_NG | 27.49 |
| 30750_MOSSLD _230_30797_LASAGUIL_230_BR_1 _1 | 15.45 |
| Other | 11.98 |
| OMS 19234900_IV-SX OUTAGE_NG | 10.40 |
| 35352_WHISMAN _115_35356_MNTA VSA_115_BR_1 _1 | 10.23 |
| MIGUEL_BKs_MXFLW_NG | 9.20 |
| OMS IV-ML OUTAGE_NG | 3.88 |
| 22136_CLAIRMNT_69.0_22140_CLARMTTP_69.0_BR_1 _1 | 3.66 |
| 30765_LOSBANOS_230_30790_PANOCHE _230_BR_2 _1 | 3.62 |
| OMS_18894306_VACA-TSL | 2.06 |
| OMS 19669035 IV-ML OUTAGE_NG | 2.02 |
| Constraint | Percent |
|---|---|
| 7690-CONTRL-INYOKN_EXP_NG | 24.64 |
| Other | 19.01 |
| 30735_METCALF _230_30042_METCALF _500_XF_13 | 11.18 |
| 30056_GATES2 _500_30060_MIDWAY _500_BR_2 _1 | 11.14 |
| 7440_MetcalfImport_Mossld-Metclf | 8.39 |
| 31336_HPLND JT_60.0_31370_CLVRDLJT_60.0_BR_1 _1 | 6.86 |
| 30060_MIDWAY _500_29402_WIRLWIND_500_BR_1 _2 | 4.68 |
| NOB_ITC | 4.59 |
| 6110_SOL10_NG | 3.60 |
| MALIN500_ISL | 3.22 |
| 7690-INYOKN_VOLTAGE_EX_NG | 2.69 |
The main reasons for CRR offset shortfall were
- The line OMS 19791504 ML_BK80_NG was binding on 5 days of this month, resulting in offset shortfall of $4.384 million.
- The line 30750_MOSSLD _230_30797_LASAGUIL_230_BR_1 _1 was binding on 29 days of this month, resulting in offset shortfall of $2.436 million.
The main reasons for CRR offset surplus were
- The line 7690-CONTRL-INYOKN_EXP_NG was binding on 29 days of this month, resulting in offset surplus of $1.909 million.
Table 5.3 shows the percentage of monthly CRR payment by transmission element.
| Constraint | Percent |
|---|---|
| Other | 25.45 |
| 7690-CONTRL-INYOKN_EXP_NG | 17.19 |
| 30750_MOSSLD _230_30797_LASAGUIL_230_BR_1 _1 | 11.60 |
| OMS 19791504 ML_BK80_NG | 9.58 |
| 31336_HPLND JT_60.0_31370_CLVRDLJT_60.0_BR_1 _1 | 7.52 |
| 7440_MetcalfImport_Mossld-Metclf | 6.79 |
| 30735_METCALF _230_30042_METCALF _500_XF_13 | 5.80 |
| 30056_GATES2 _500_30060_MIDWAY _500_BR_2 _1 | 4.80 |
| 30790_PANOCHE _230_30900_GATES _230_BR_1 _1 | 4.26 |
| MIGUEL_BKs_MXFLW_NG | 3.90 |
| MALIN500_ISL | 3.10 |
Table 5.4 shows the monthly CRR statistics. The Net Monthly Balancing Surplus calculates as CRR Surplus plus CRR Daily Balancing Account minus total auction revenue. The total auction revenue is the sum of Monthly Auction Revenue and Annual Auction Revenue. The Allocation to Measured demand is calculated as sum of total auction revenue and Net Monthly Balancing Surplus.
Net Monthly Balancing Surplus in April was $6,509,731. The auction revenues credited to the balancing account for April were $5,245,918. As a result, the balancing account had a surplus of approximately $11.756 million compared to $17.697 million in the previous month, which was allocated to measured demand.
| Description | APRIL -2026 | MARCH -2026 |
|---|---|---|
| CRR Notional Value | $55,406,269 | $46,742,705 |
| CRR Deficit | -$15,765,030 | -$8,650,405 |
| CRR Settlement Rule | -$3,103 | -$62,930 |
| CRR Adjusted Payment | $39,638,136 | $38,029,370 |
| CRR Surplus | $7,750,485 | $11,913,152 |
| Monthly Auction Revenue | $1,585,946 | $448,318 |
| Annual Auction Revenue | $3,659,972 | $6,861,355 |
| CRR Daily Balancing Account | $4,005,164 | $5,784,185 |
| Net Monthly Balancing Surplus | $6,509,731 | $10,387,664 |
| Allocation to Measured Demand | $11,755,649 | $17,697,337 |