Section 3 Market Performance Metrics
Day-Ahead Prices
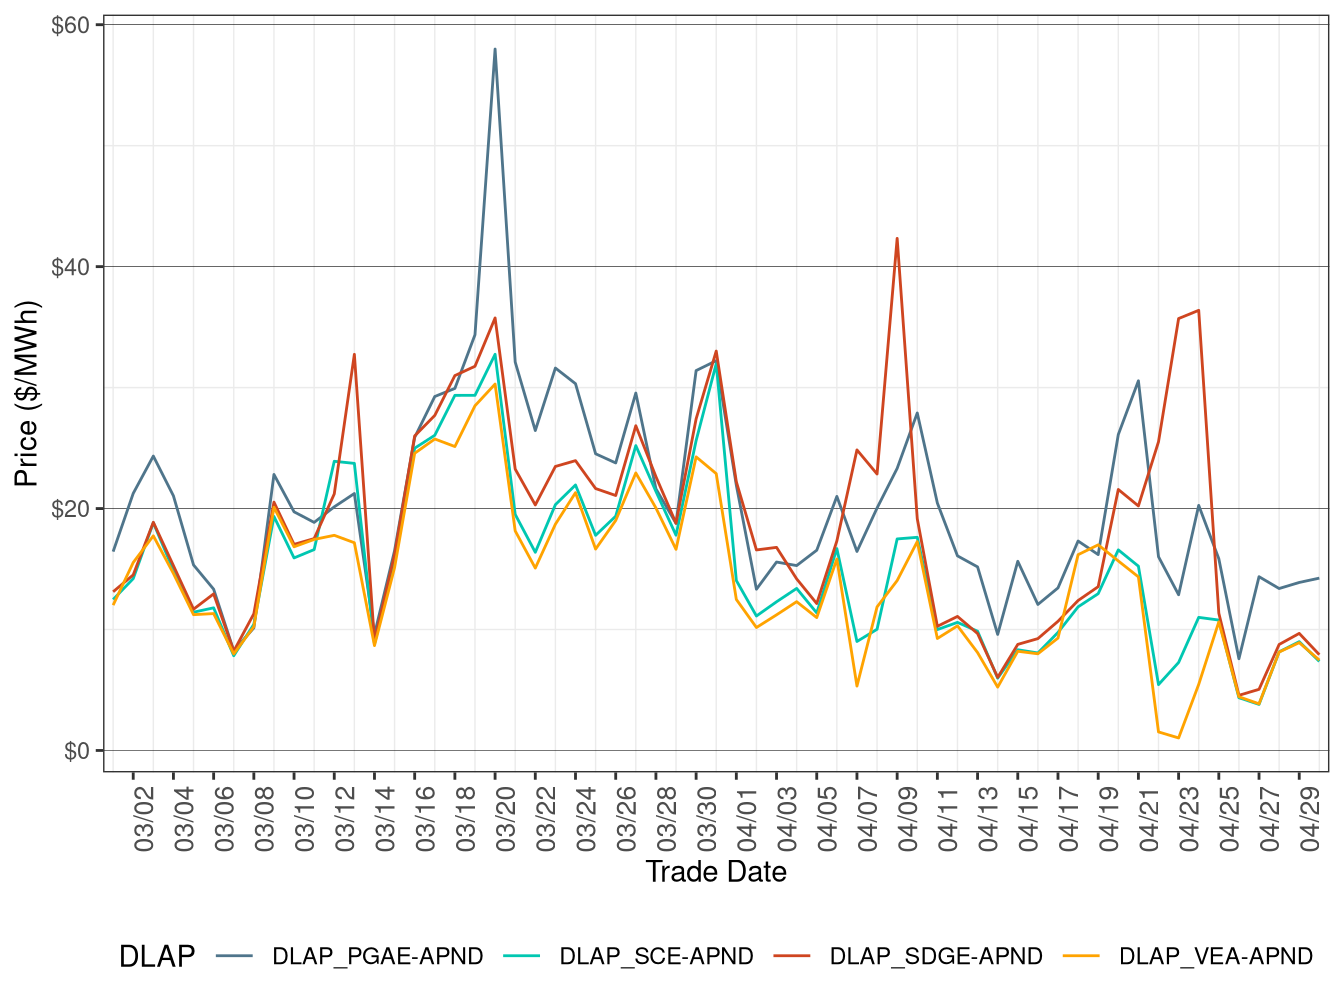
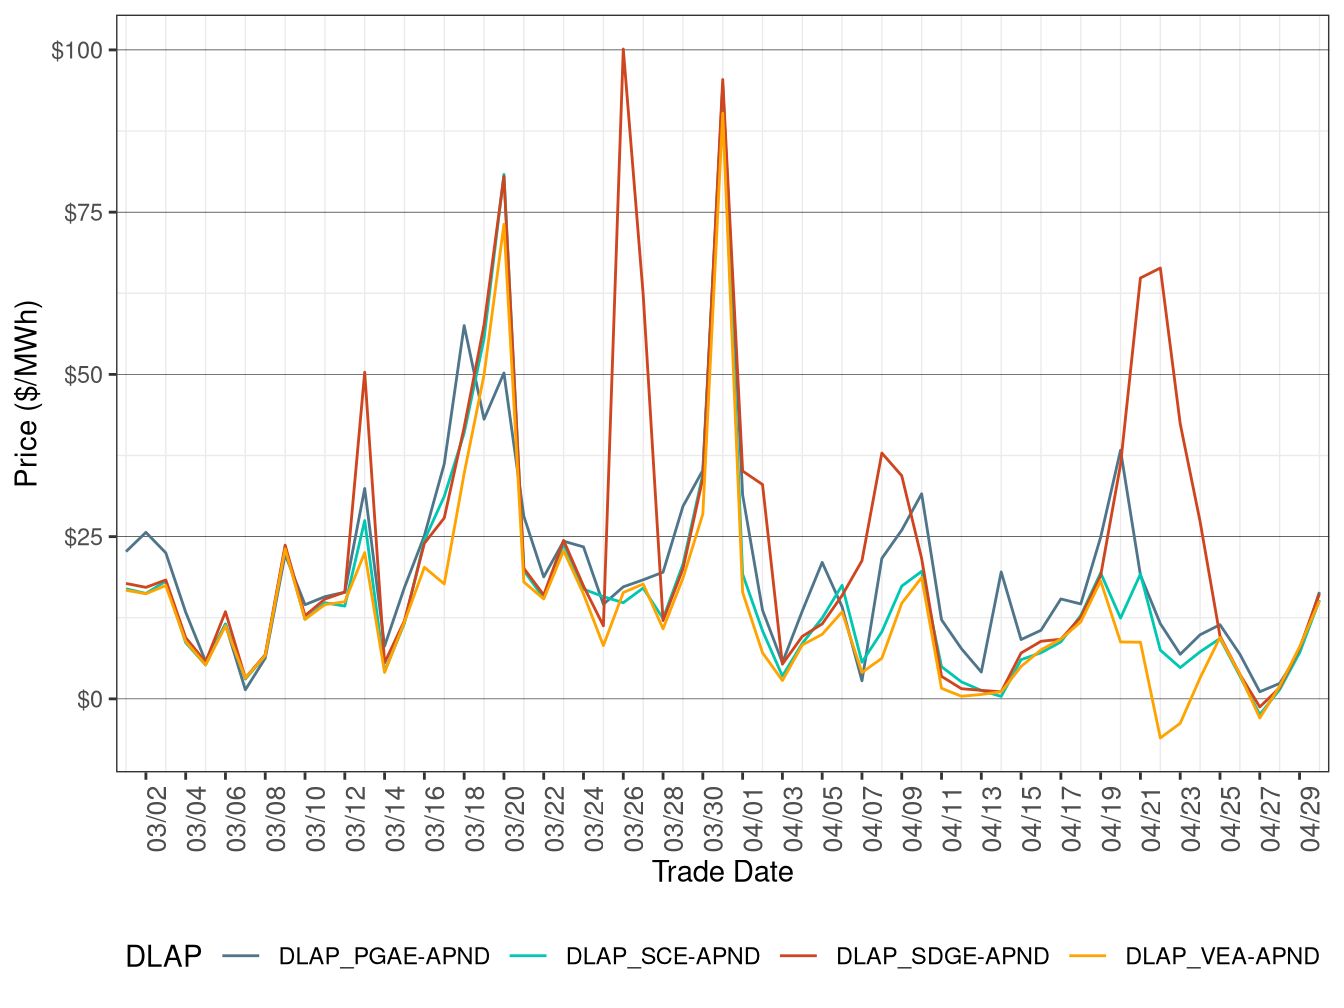
Figure 3.1 shows the daily simple average prices for all hours in IFM for each of the four default load-aggregation points (DLAP): PG&E, SCE, SDG&E, and VEA.
Average Day-Ahead DLAP prices across PGAE, SCE, SDGE, and VEA were generally lower in April 2026 than in March 2026, although occasional price spikes occurred during the month.
TABLE 3.1 below lists the binding constraints that resulted in relatively high or low DLAP prices on certain dates.
Figure 3.1: IFM (Day-Ahead) Simple Average DLAP Prices (All Hours)
| DLAP LMPs Affected | Dates | Transmission Constraint |
|---|---|---|
| PGAE; SDGE | Apr 1 | MOSSLD-LASAGUIL-230kV line from HE 9 to HE 18 and on the GATES2-MIDWAY-500kV line from HE 9 to HE 17 |
| PGAE | Apr 5 | GATES2-MIDWAY-500kV line from HE 9 to HE 17 and on the LOSBANOS-PANOCHE-230kV line from HE 9 to HE 18 |
| PGAE | Apr 6 | LOSBANOS-PANOCHE-230kV line from HE 9 to HE 18 and on the LASAGUIL-PANOCHE-230kV line from HE 9 to HE 17 |
| PGAE; SDGE | Apr 7 | MIGUEL_BKs_MXFLW_NG nomogram binding from HE 9 to HE 23 and OMS-19234900-IV-SX-OUTAGE_NG binding from HE 8 to HE 24 |
| VEA | Apr 8 | MIGUEL_BKs_MXFLW_NG nomogram binding from HE 8 to HE 23 and OMS-19234900-IV-SX-OUTAGE_NG binding from HE 1 to HE 24 |
| SDGE | Apr 9 | CLAIRMNT-CLARMTTP 69kV line from HE 1 to HE 15 |
| PGAE | Apr 10 | MOSSLD-LASAGUIL-230kV line from HE 9 to HE 18 and on the GATES2-MIDWAY-500kV line from HE 10 to HE 12 |
| PGAE | Apr 11 | GATES2-MIDWAY-500kV line from HE 9 to HE 18 |
| PGAE | Apr 12 | GATES2-MIDWAY-500kV line from HE 9 to HE 17 and on the MOSSLD-LASAGUIL-230kV line from HE 9 to HE 16 |
| PGAE | Apr 15 | METCALF-METCALF-230 XFMR from HE 8 to HE 21 and on the GATES2-MIDWAY-500kV line from HE 9 to HE 16 |
| VEA | Apr 19 | MOSSLD-LASAGUIL-230kV line from HE 9 to HE 18 |
| PGAE | Apr 21 | OMS-19791504-ML_BK80_NG nomogram binding from HE 1 to HE 23 and 7440_MetcalfImport_Mossld-Metclf binding from HE 8 to HE 19 |
| PGAE | Apr 25 | PANOCHE-GATES-230kV line from HE 9 to HE 18 and on the METCALF-METCALF-230 XFMR from HE 8 to HE 21 |
| PGAE | Apr 27 | MOSSLD-LASAGUIL-230kV line from HE 8 to HE 18 |
Real-Time Price
Figure 3.2 shows daily simple average prices for all four DLAPs (PG&E, SCE, SDG&E, and VEA) for all hours respectively in FMM.
Average FMM DLAP prices across PGAE, SCE, SDGE, and VEA decreased relative to the previous month.
TABLE 3.2 below lists the binding constraints that resulted in relatively high or low DLAP prices on certain dates.
Figure 3.2: FMM Simple Average DLAP Prices (All Hours)
| DLAP LMPs Affected | Dates | Transmission Constraint |
|---|---|---|
| SDGE | Apr 2 | SUNCREST-SUNCREST-230 XFMR from HE 1 to HE 24 and on the EL CAJON-LOSCOCHS-69kV line from HE 1 to HE 22 |
| PGAE | Apr 10 | MOSSLD-LASAGUIL-230kV line from HE 9 to HE 15 and on the GATES2-MIDWAY-500kV line from HE 11 to HE 18 |
| PGAE | Apr 11 | GATES2-MIDWAY-500kV line from HE 8 to HE 19 and on the MOSSLD-LASAGUIL-230kV line from HE 9 to HE 16 |
| PGAE | Apr 14 | METCALF-METCALF-230 XFMR from HE 9 to HE 22 |
| PGAE | Apr 20 | OMS-19791504-ML_BK80_NG nomogram binding from HE 8 to HE 24 and 7440_MetcalfImport_Mossld-Metclf binding from HE 9 to HE 22 |
| SDGE | Apr 21 | OMS-19791504-ML_BK80_NG nomogram binding from HE 1 to HE 24 |
| SDGE | Apr 22 | OMS-19791504-ML_BK80_NG nomogram binding from HE 1 to HE 24 and 7440_MetcalfImport_Mossld-Metclf binding from HE 8 to HE 19 |
| SDGE | Apr 23 | NWARK-115-NEWARK-230 XFMR from HE 19 to HE 23 and on the PNM1-FC-PINTADO 345kV line from HE 10 to HE 17 |
| SDGE | Apr 24 | PANOCHE-GATES-230kV line from HE 8 to HE 18 and on the TESLA-LOSBANOS-500kV line from HE 10 to HE 18 |
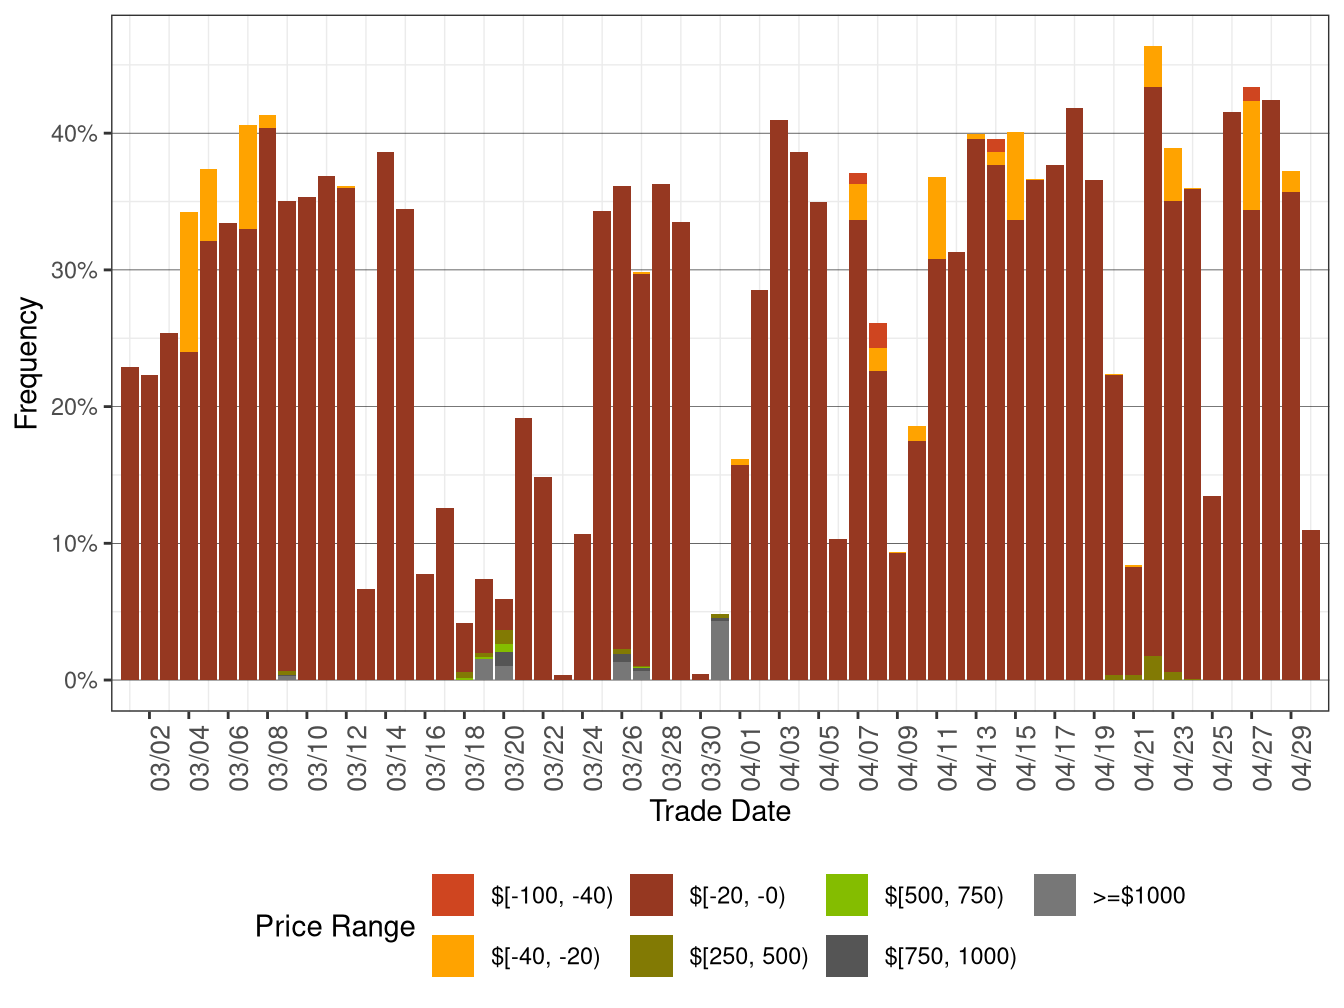
Figure 3.3 below shows the daily frequency of positive price spikes and negative prices by price range for the DLAPs in the FMM.
The cumulative frequency of prices in FMM above $250/MWh decreased from 0.15 percent in March 2026 to 0.10 percent in April 2026, while the cumulative frequency of negative prices increased from 23.34 percent in March 2026 to 30.61 percent in April 2026.
Figure 3.3: Daily Frequency of FMM DLAP Positive Price Spikes and Negative Prices
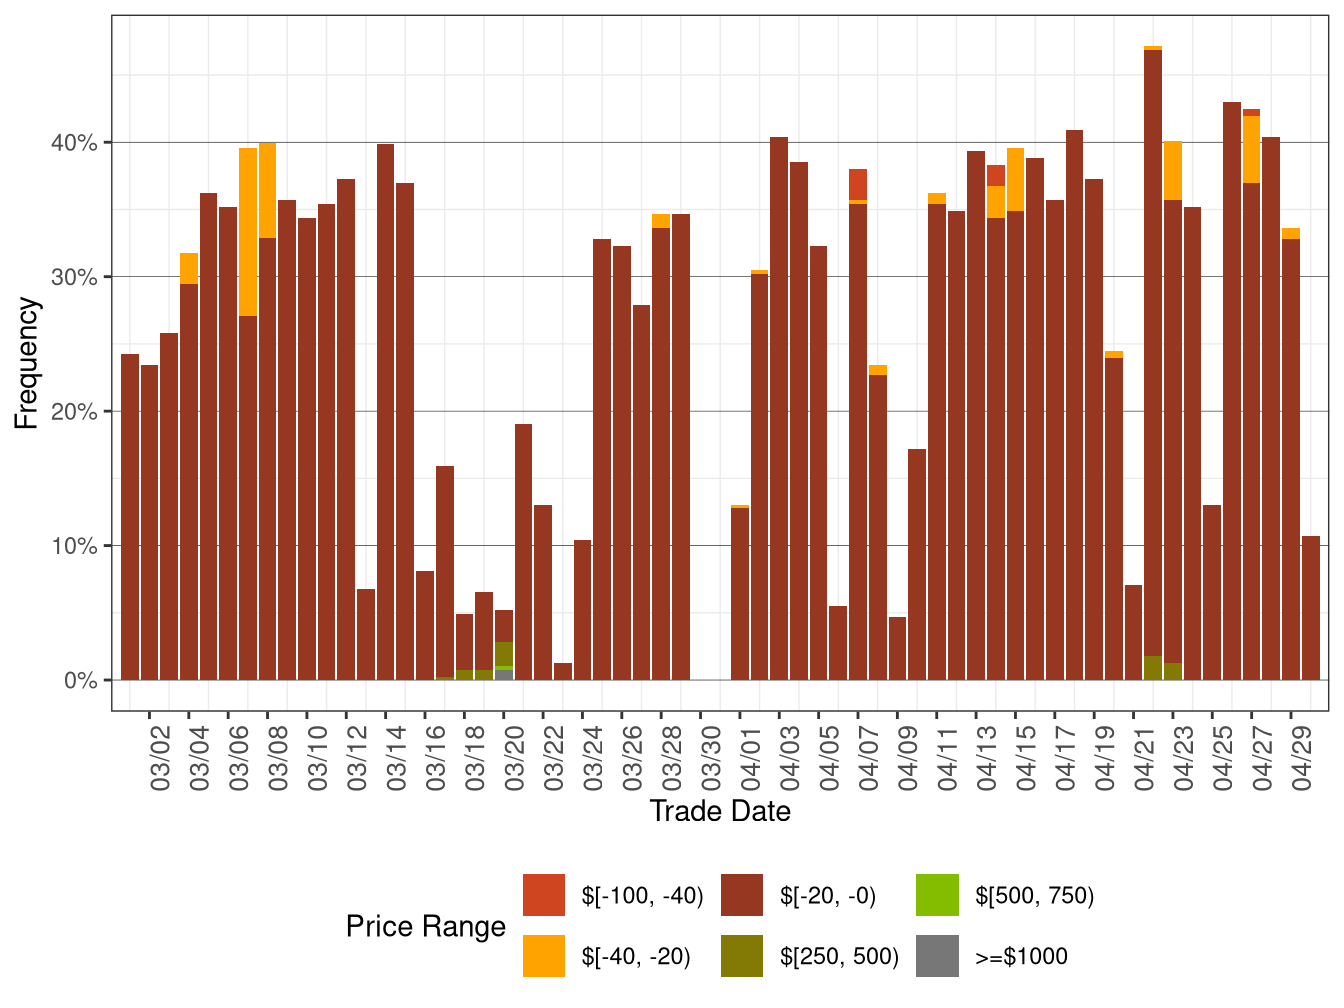
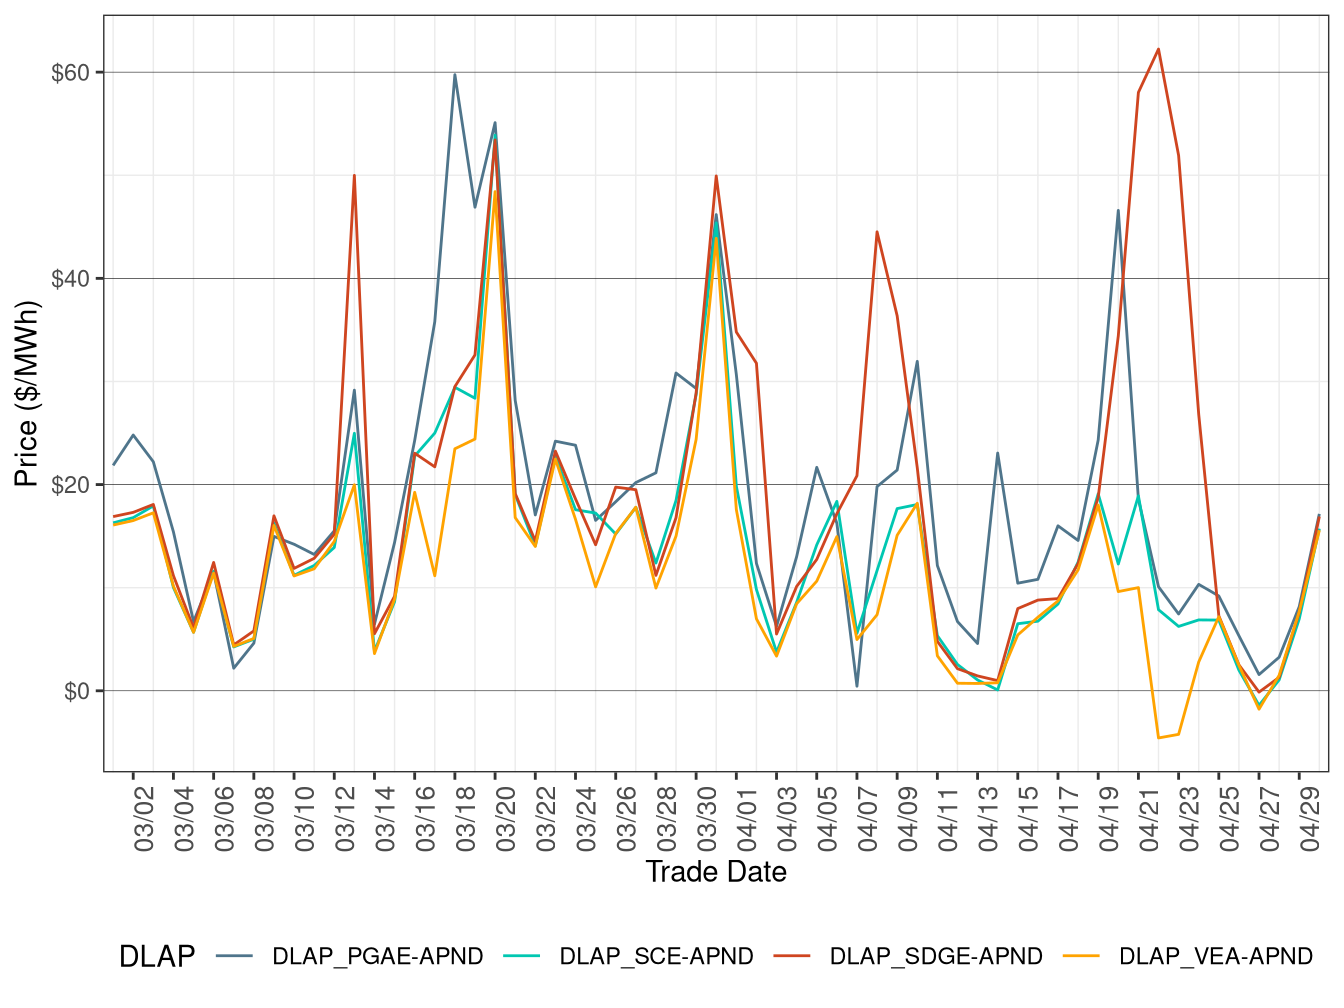
Figure 3.4 shows daily simple average prices for all the DLAPs (PG&E, SCE, SDG&E, and VEA) for all hours respectively in RTD.
Average RTD DLAP prices across PGAE, SCE, SDGE, and VEA decreased relative to the previous month.
TABLE 3.3 below lists the binding constraints that resulted in relatively high or low DLAP prices on certain dates.
Figure 3.4: RTD Simple Average DLAP Prices (All Hours)
| DLAP LMPs Affected | Dates | Transmission Constraint |
|---|---|---|
| SDGE | Apr 2 | SUNCREST-SUNCREST-230 XFMR from HE 1 to HE 24 and on the EL CAJON-LOSCOCHS-69kV line from HE 6 to HE 22 |
| PGAE | Apr 10 | MOSSLD-LASAGUIL-230kV line from HE 9 to HE 15 and on the GATES2-MIDWAY-500kV line from HE 11 to HE 17 |
| PGAE | Apr 11 | GATES2-MIDWAY-500kV line from HE 8 to HE 19 and on the MOSSLD-LASAGUIL-230kV line from HE 9 to HE 18 |
| PGAE | Apr 20 | OMS-19791504-ML_BK80_NG nomogram binding from HE 8 to HE 24 and 7440_MetcalfImport_Mossld-Metclf binding from HE 8 to HE 22 |
| SDGE | Apr 21 | OMS-19791504-ML_BK80_NG nomogram binding from HE 1 to HE 24 |
| SDGE | Apr 22 | OMS-19791504-ML_BK80_NG nomogram binding from HE 1 to HE 24 and 7440_MetcalfImport_Mossld-Metclf binding from HE 8 to HE 11 |
| SDGE | Apr 23 | V588-BP1-MARION-PEARL 500kV line from HE 8 to HE 9 and from HE 13 to HE 18, and on the NWARK-115-NEWARK-230 XFMR from HE 19 to HE 22 |
| SDGE | Apr 24 | OMS-19791504-ML_BK80_NG nomogram binding from HE 1 to HE 14 |
Figure 3.5 below shows the daily frequency of positive price spikes and negative prices by price range for the DLAPs in RTD.
The cumulative frequency of prices in RTD above $250/MWh decreased from 0.49 percent in March 2026 to 0.10 percent in April 2026, while the cumulative frequency of negative prices increased from 23.32 percent in March 2026 to 31.31 percent in April 2026.
Figure 3.5: Daily Frequency of RTD DLAP Positive Price Spikes and Negative Prices