5 Congestion Revenue Rights
Congestion revenue rights auction efficiency 1B became in effect on January 1, 2019. It includes key changes related to the congestion revenue rights settlements process:
- Targeted reduction of congestion revenue rights payouts on a constraint by constraint basis.
- Distribute congestion revenues to the extent that CAISO collected the requisite revenue on the constraint over the month. That is, implement a pro-rata funding for CRRs.
- Allow surpluses on one constraint in one hour to offset deficits on the same constraint in another hour over the course of the month.
- Only distribute surpluses to congestion revenue rights if the surplus is collected on a constraint that the congestion revenue right accrued a deficit, and only up to the full target payment value of the congestion revenue right.
- Distribute remaining surplus revenue at the end of the month, which are associated with constraints that collect more surplus over the month than deficits, to measured demand.
Monthly CRR Revenue
Figure 11 illustrates the daily CRR notional value in the corresponding month for the various transmission elements that experienced congestion during the month. CRR notional value is calculated as the product of CRR implied flow and constraint shadow price in each hour per constraint and CRR.
Figure 11: Daily CRR Notional Value by Transmission Element
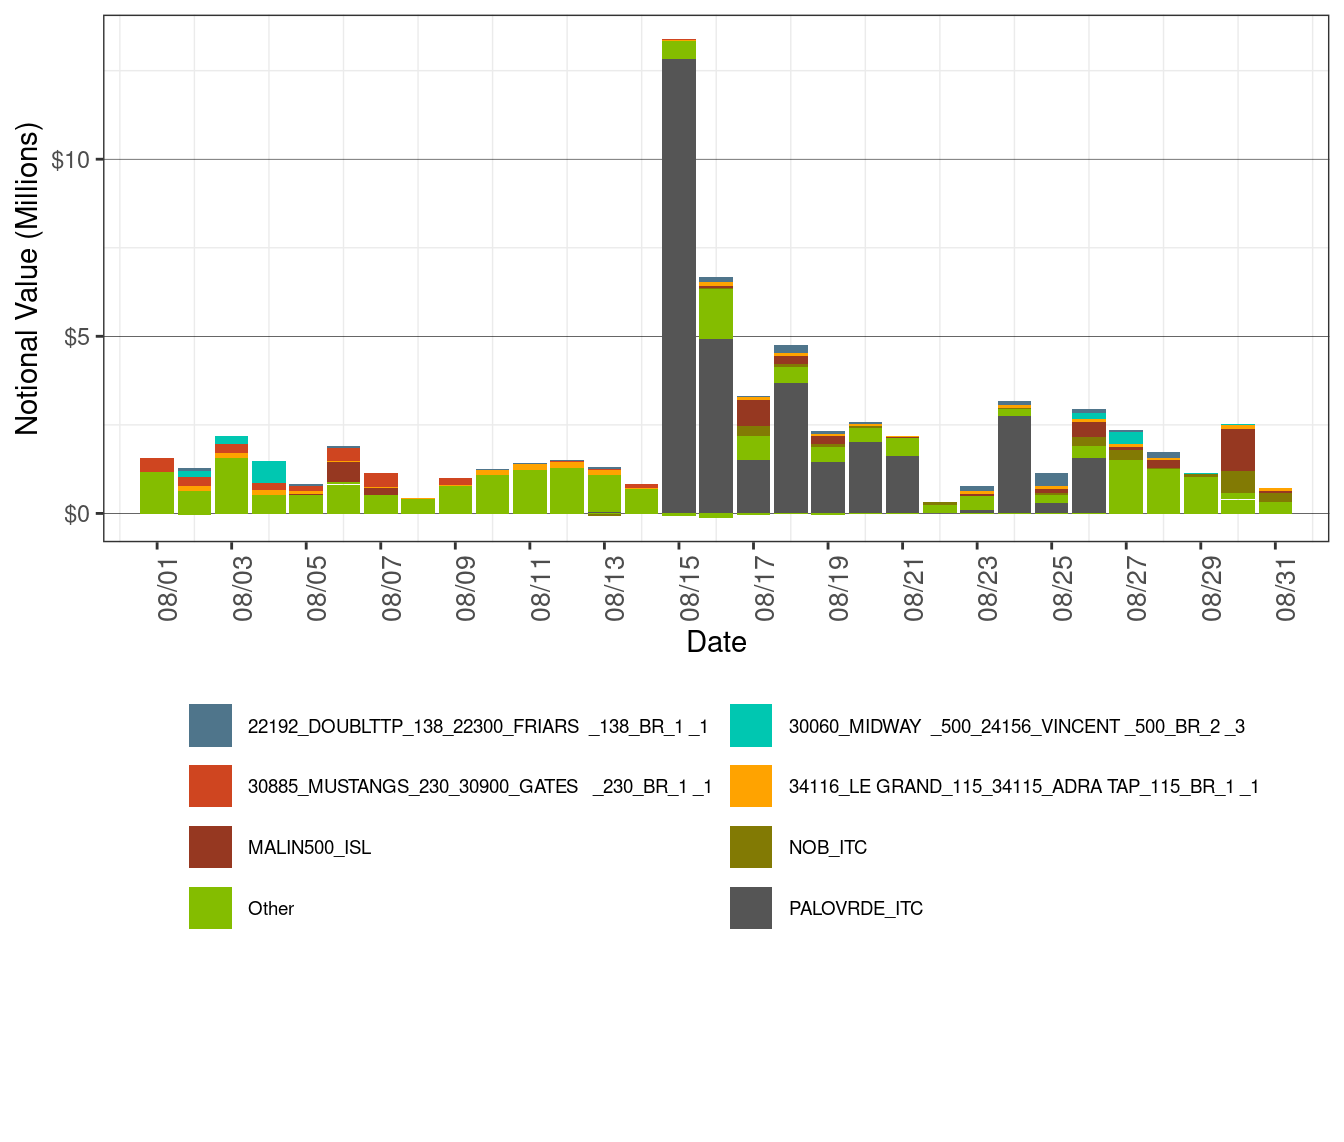
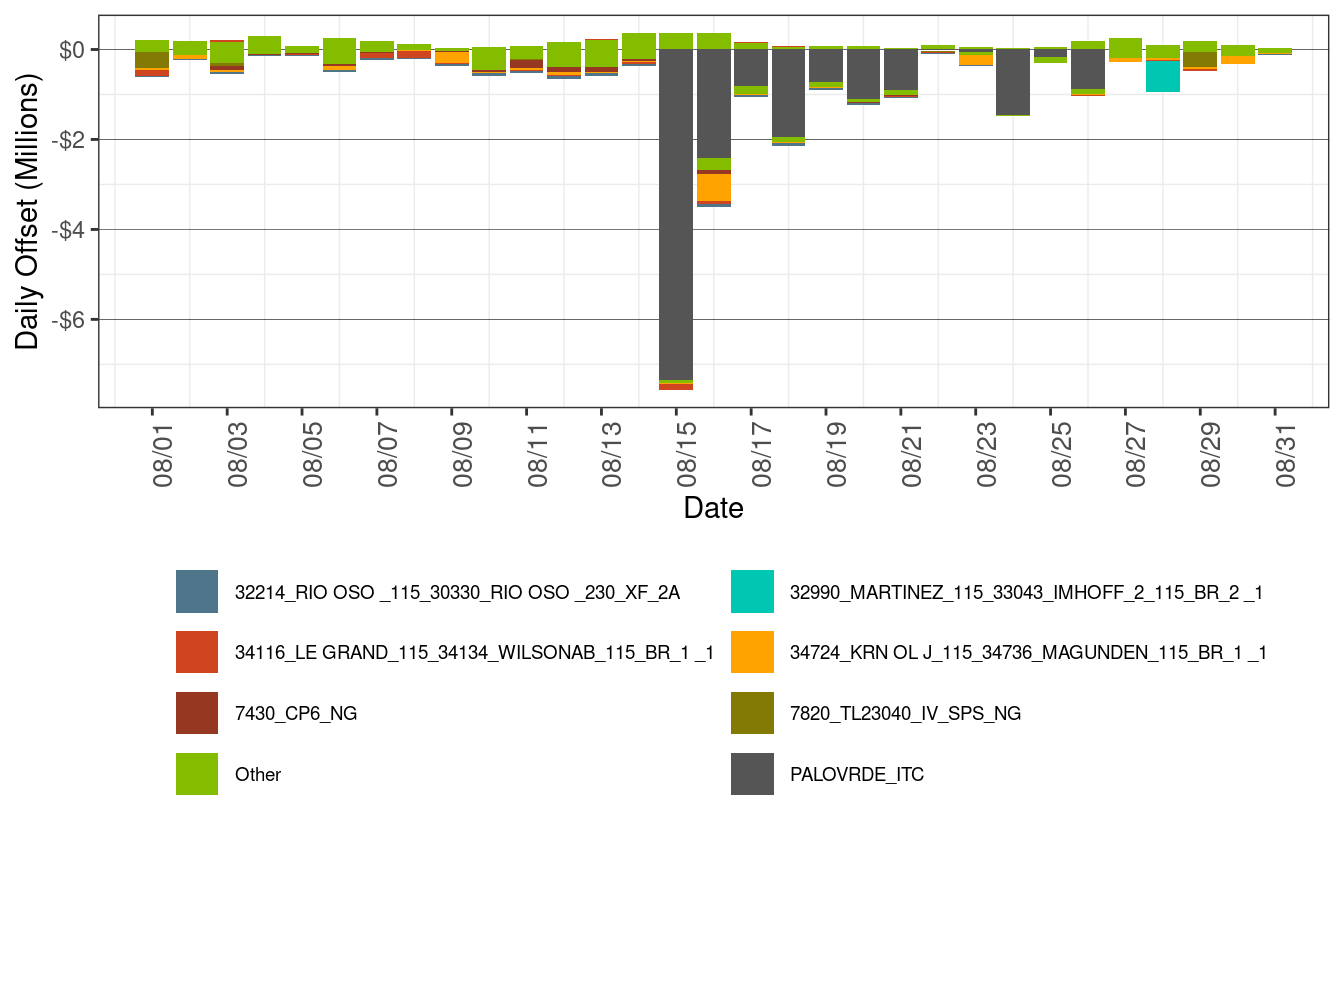
Figure 12 illustrates the daily CRR offset value in the corresponding month for the transmission elements that experienced congestion during the month. CRR offset value is the difference between the revenue collected from the congestion CRR. A positive CRR offset value represents surplus and a negative CRR offset value represents shortfall.
The main reason for CRR offset shortfall is
- PALOVRDE_ITC was binding in 13 days of this month, resulting in offset shortfall of $17.83 million. PALOVRDE_ITC was derated in the second half of this month mainly driven by the outage of Colorado River-Palo Verde 500 kV line.
Figure 12: Daily CRR Offset Value by Transmission Element
Furthermore, Table 5 shows the monthly CRR deficit in the month broken out by transmission elements and Table 6 shows the monthly CRR surplus in the month broken out by transmission elements.
| Constraint | Percent |
|---|---|
| PALOVRDE_ITC | 62.69 |
| Other | 9.97 |
| 34724_KRN OL J_115_34736_MAGUNDEN_115_BR_1 _1 | 6.83 |
| 32214_RIO OSO _115_30330_RIO OSO _230_XF_2A | 3.63 |
| 34116_LE GRAND_115_34134_WILSONAB_115_BR_1 _1 | 3.53 |
| 7820_TL23040_IV_SPS_NG | 2.96 |
| 7430_CP6_NG | 2.67 |
| 32990_MARTINEZ_115_33043_IMHOFF_2_115_BR_2 _1 | 2.45 |
| 32056_CORTINA 60.0_30451_CRTNA M 1.0_XF_1 | 2.27 |
| 35656_PIERCY _115_35642_METCALF _115_BR_1 _1 | 1.56 |
| 34492_REEDLEY _70.0_34497_DNUBAJCT_70.0_BR_1 _1 | 1.43 |
| Constraint | Percent |
|---|---|
| Other | 35.78 |
| 30060_MIDWAY _500_24156_VINCENT _500_BR_2 _3 | 13.03 |
| 30885_MUSTANGS_230_30900_GATES _230_BR_1 _1 | 7.88 |
| MALIN500_ISL | 6.43 |
| 34116_LE GRAND_115_34134_WILSONAB_115_BR_1 _1 | 6.15 |
| 30055_GATES1 _500_30900_GATES _230_XF_12_P | 5.84 |
| NOB_ITC | 5.63 |
| WSTWGMEAD_ITC | 5.21 |
| 34116_LE GRAND_115_34115_ADRA TAP_115_BR_1 _1 | 5.14 |
| 34150_NEWHALL _115_34154_DAIRYLND_115_BR_1 _1 | 4.83 |
| 32225_BRNSWKT1_115_32222_DTCH2TAP_115_BR_1 _1 | 4.08 |
Table 7 shows the monthly CRR payment in the month broken out by transmission elements
| Constraint | Percent |
|---|---|
| PALOVRDE_ITC | 36.49 |
| Other | 21.16 |
| MALIN500_ISL | 10.19 |
| 30885_MUSTANGS_230_30900_GATES _230_BR_1 _1 | 5.91 |
| 34116_LE GRAND_115_34115_ADRA TAP_115_BR_1 _1 | 5.79 |
| NOB_ITC | 5.43 |
| 30060_MIDWAY _500_24156_VINCENT _500_BR_2 _3 | 3.90 |
| 22192_DOUBLTTP_138_22300_FRIARS _138_BR_1 _1 | 3.68 |
| NdGrp: 36411_DIABLO 1_25.0_B1 | 2.66 |
| OMS_9959454_CUYAMS_TAFT_70_1 | 2.44 |
| 34860_TAFT _70.0_34943_Q356TAP _70.0_BR_1 _1 | 2.33 |
Table 8 shows the monthly CRR payments. Net monthly balancing surplus in August was -$1.55 million. The auction revenues credited to the balancing account for August was $6.65 million. As a result, the balancing account for August had a surplus of approximately $5.10 million, which was allocated to measured demand. The Net Monthly Balancing Surplus is calculates as sum of CRR surplus plus CRR daily Balancing account minus total auction revenue. The Total Auction revenue is sum of monthly and annual auction revenue. The Allocation to Measured demand is calculated as sum of Total Auction revenue plus Net Monthly Balancing Surplus.
| Description | AUGUST -2021 | JULY -2021 |
|---|---|---|
| CRR Notional Value | $69,555,161 | $81,395,041 |
| CRR Deficit | -$28,432,875 | -$35,351,055 |
| CRR Settlement Rule | -$11,132 | -$21,983 |
| CRR Adjusted Payment | $41,111,155 | $46,022,003 |
| CRR Surplus | $4,624,926 | $11,345,835 |
| Monthly Auction Revenue | $4,482,755 | $6,089,197 |
| Annual Auction Revenue | $2,163,171 | $2,163,171 |
| CRR Daily Balancing Account | $470,328 | -$4,399,017 |
| Net Monthly Balancing Surplur | -$1,550,673 | -$1,305,551 |
| Allocation to Measured Demand | $5,095,254 | $6,946,817 |