3 Market Performance Metrics
Day-Ahead Prices
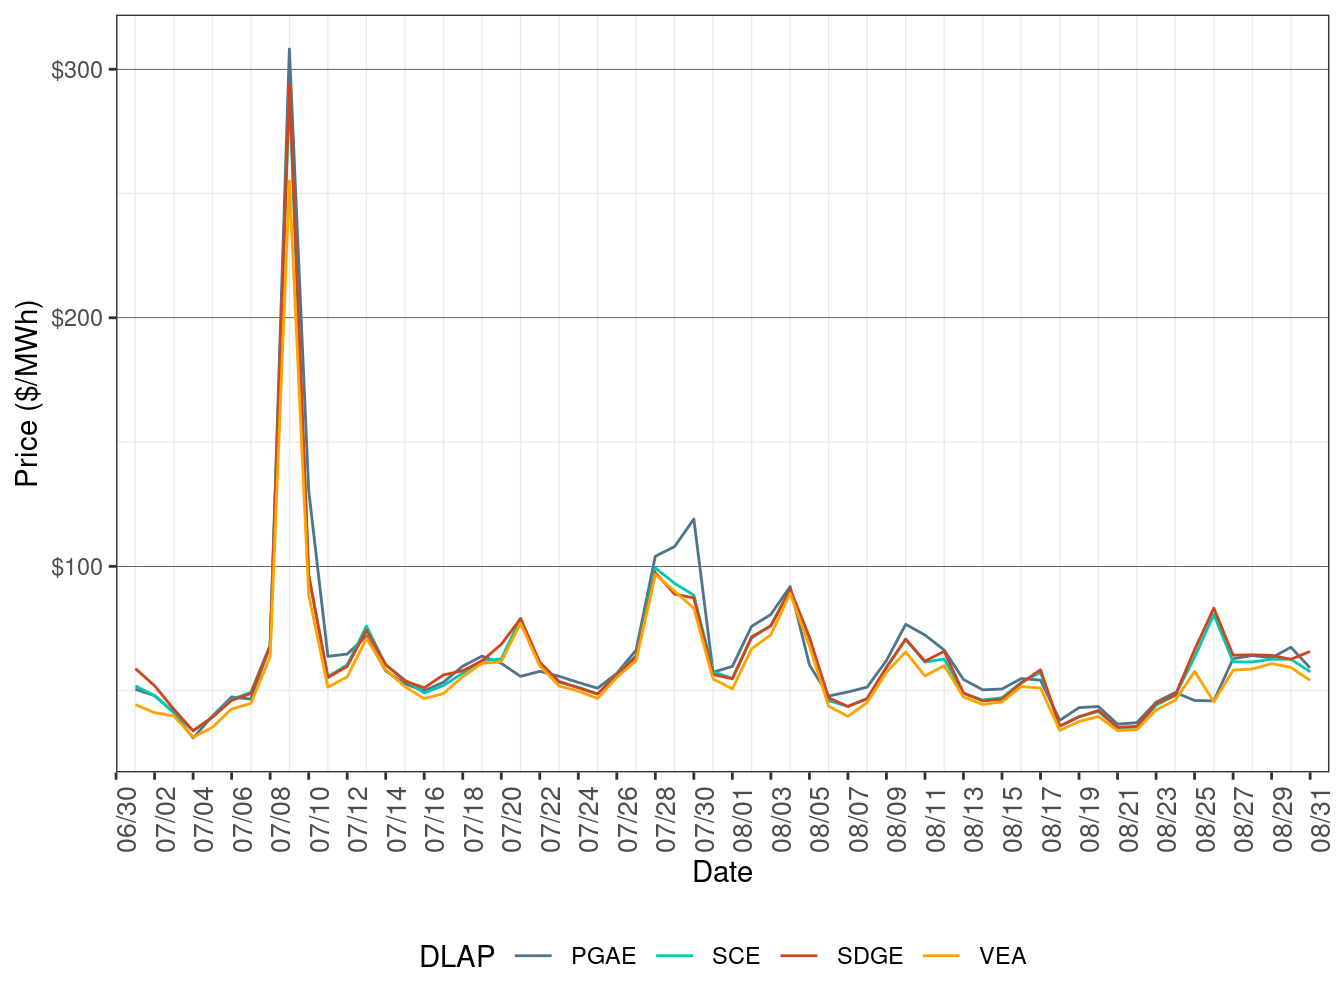
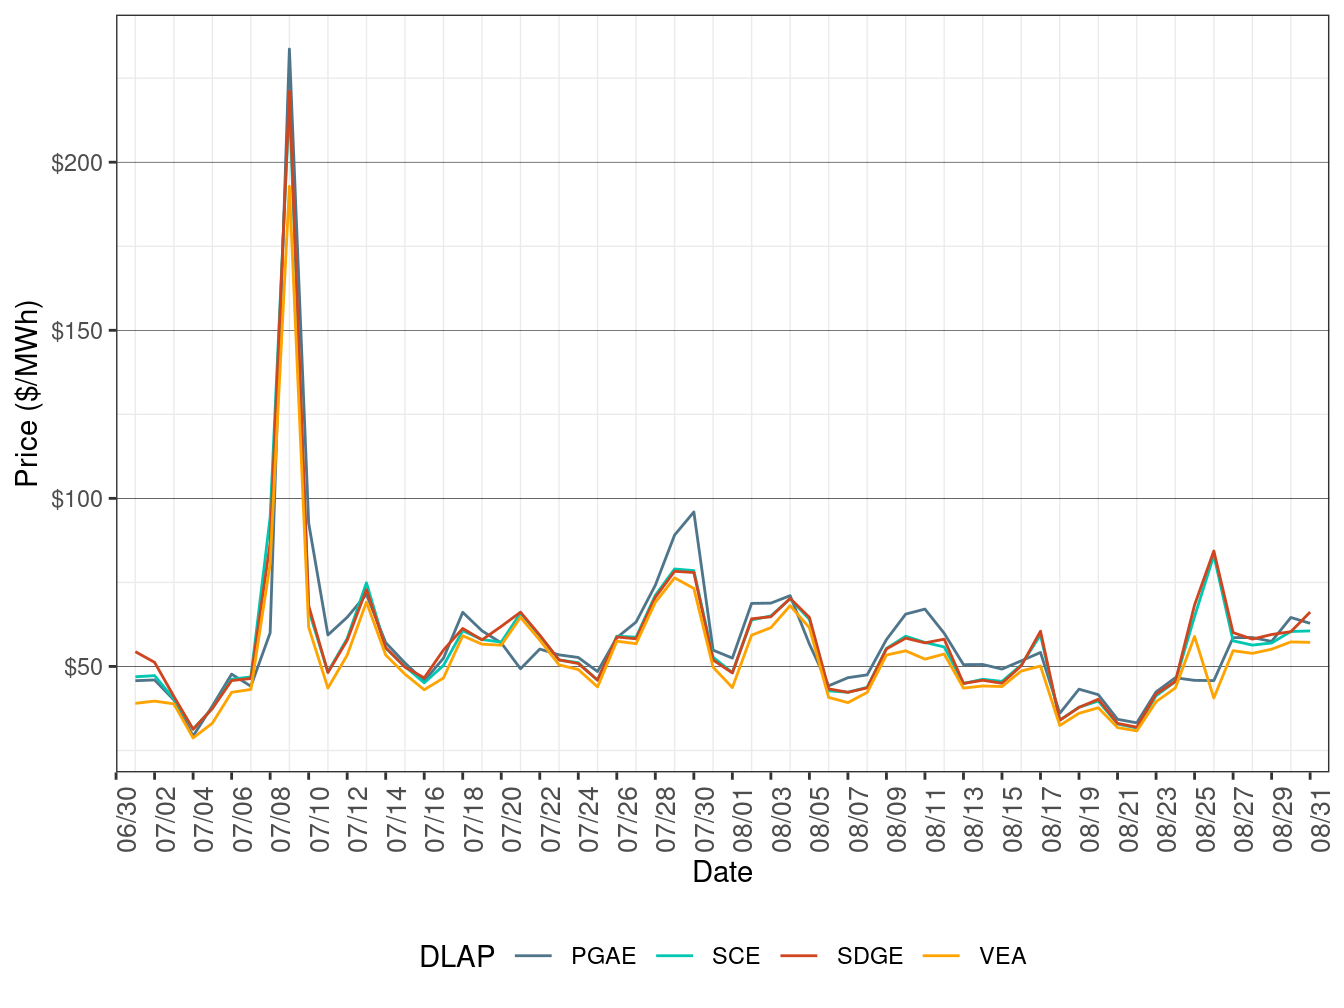
Figure 2 show the daily simple average load-aggregation points (LAP) prices for each of the four default LAPs (PG&E, SCE, SDG&E, and VEA) for all hours. TABLE 2 below lists the binding constraints along with the associated DLAP locations and the dates when the binding constraints resulted in relatively high or low DLAP prices.
Figure 2: Day-Ahead Simple Average LAP Prices (All Hours)
| DLAP | Dates | Transmission Constraint |
|---|---|---|
| PGAE | August 14 | GATES1-GATES-500 XFMR, MUSTANGS-GATES 230 kV line |
| SDGE | August 28 | DOUBLTTP-FRIARS-138 kV line |
| SDGE | August 29 | 7820_TL23040_IV_SPS_NG |
Real-Time Price
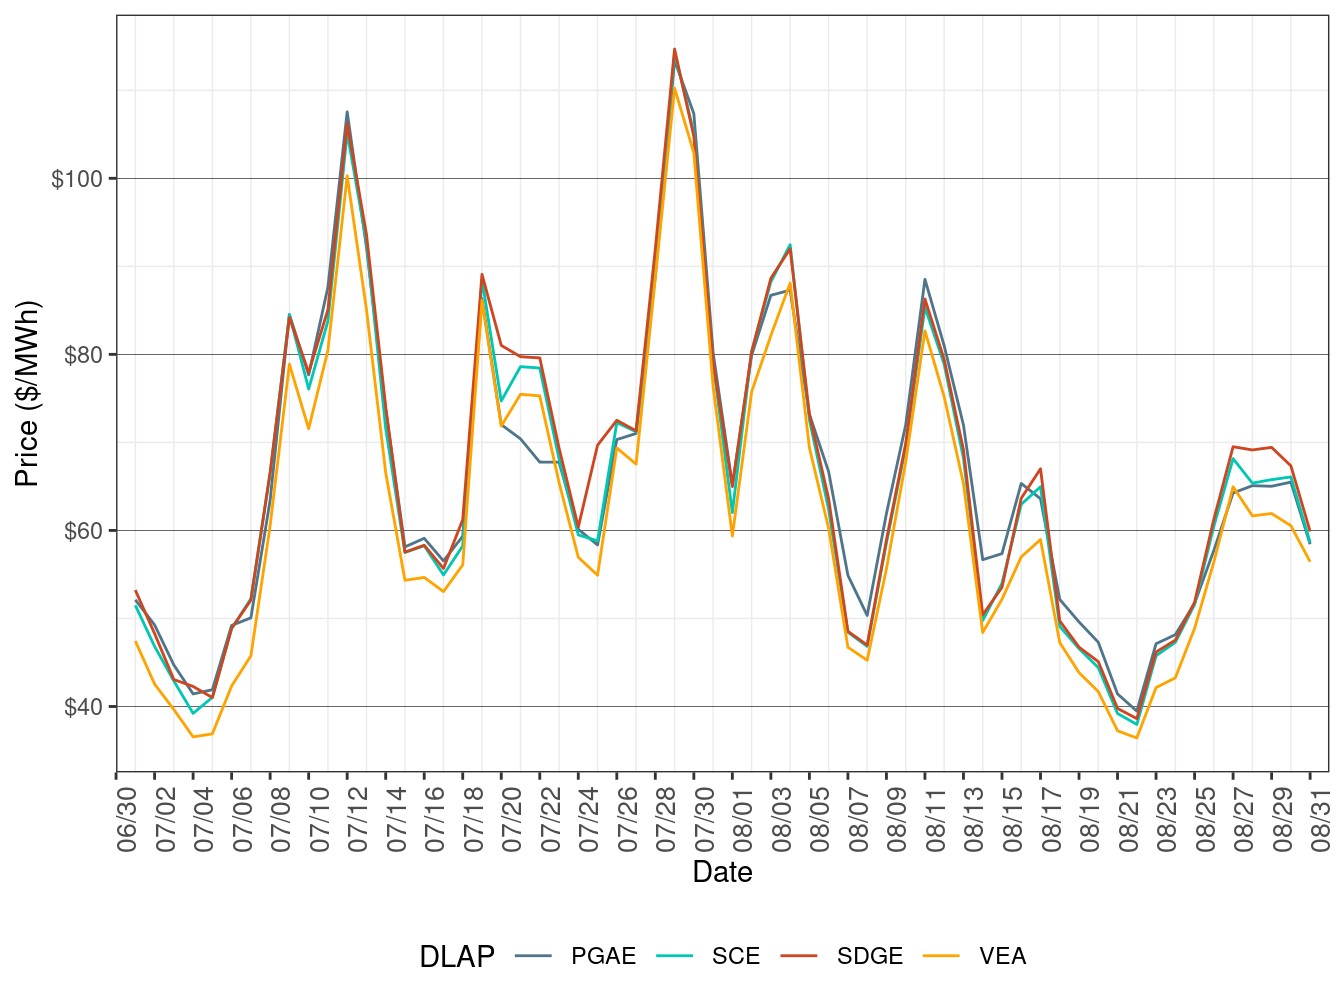
Figure 3 show daily simple average LAP prices for all the default LAPs (PG&E, SCE, SDG&E, and VEA) for all hours respectively in FMM. TABLE 3 lists the binding constraints along with the associated DLAP locations and the dates when the binding constraints resulted in relatively high or low DLAP prices.
Figure 3: FMM Simple Average LAP Prices (All Hours)
| DLAP | Dates | Transmission Constraint |
|---|---|---|
| PGAE | August 10-11 | MUSTANGS-GATES-230 kV line, T342.MPSN |
| SCE, SDGE, VEA | August 25 | WEST TS-EAST TS-500 kV line |
| SCE, SDGE | August 26 | OMS_10629362_LUGO-RVISTA |
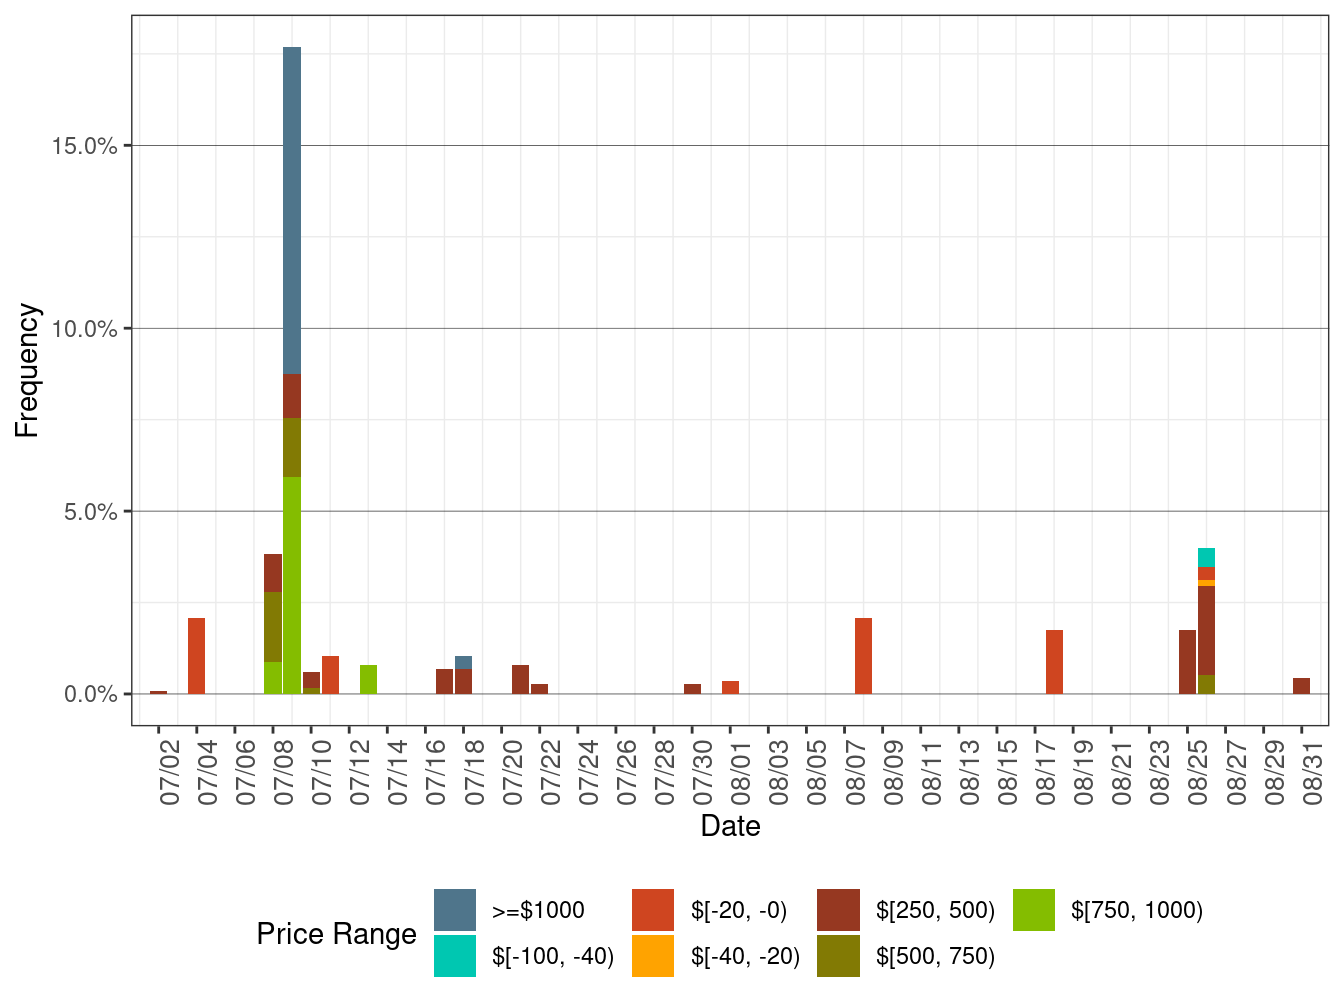
Figure 4 below shows the daily frequency of positive price spikes and negative prices by price range for the default LAPs in the FMM. The cumulative frequency of prices above $250/MWh decreased to 0.50 percent in August from 1.59 percent in July. The cumulative frequency of negative prices fell to 0.01 percent in August from 0.07 percent in July.
Figure 4: Daily Frequency of FMM LAP Positive Price Spikes and Negative Prices
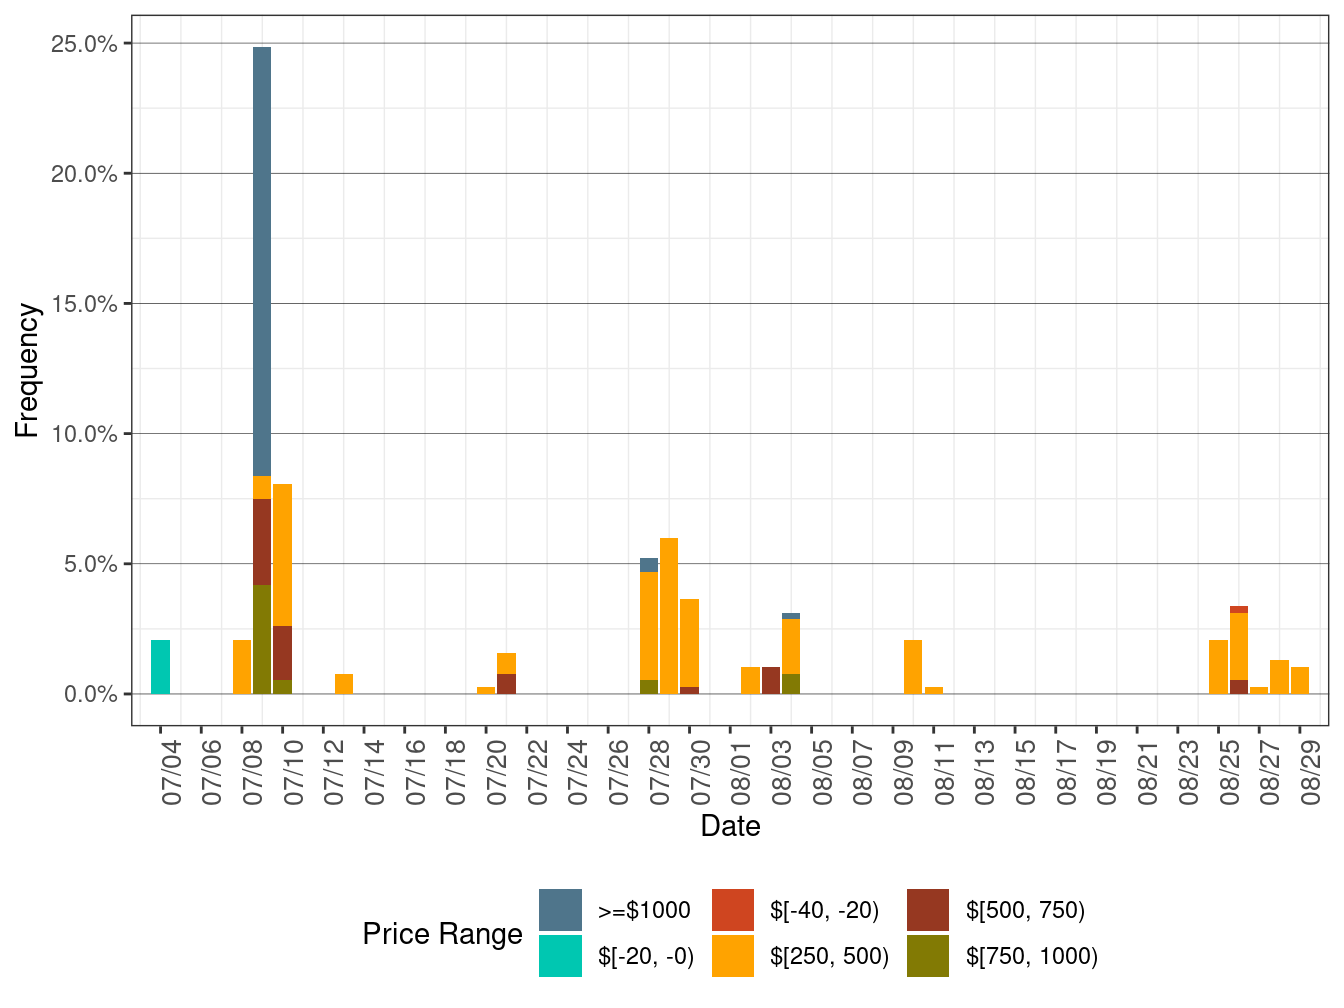
Figure 5 show daily simple average LAP prices for all the default LAPs (PG&E, SCE, SDG&E, and VEA) for all hours respectively in RTD. TABLE 4 lists the binding constraints along with the associated DLAP locations and the dates when the binding constraints resulted in relatively high or low DLAP prices.
Figure 5: RTD Simple Average LAP Prices (All Hours)
| DLAP | Dates | Transmission Constraint |
|---|---|---|
| PGAE | August 10-11 | MUSTANGS-GATES-230 kV line, T342.MPSN |
| SCE, SDGE, VEA | August 25 | WEST TS-EAST TS-500 kV line |
| SCE, SDGE | August 26 | OMS_10629362_LUGO-RVISTA |
Figure 4 below shows the daily frequency of positive price spikes and negative prices by price range for the default LAPs in RTD. The cumulative frequency of prices above $250/MWh dropped to 0.19 percent in August from 0.78 percent in July. The cumulative frequency of negative prices increased to 0.17 percent in August from 0.10 percent in July.
Figure 6: Daily Frequency of RTD LAP Positive Price Spikes and Negative Prices