Section 3 Market Performance Metrics
Day-Ahead Prices
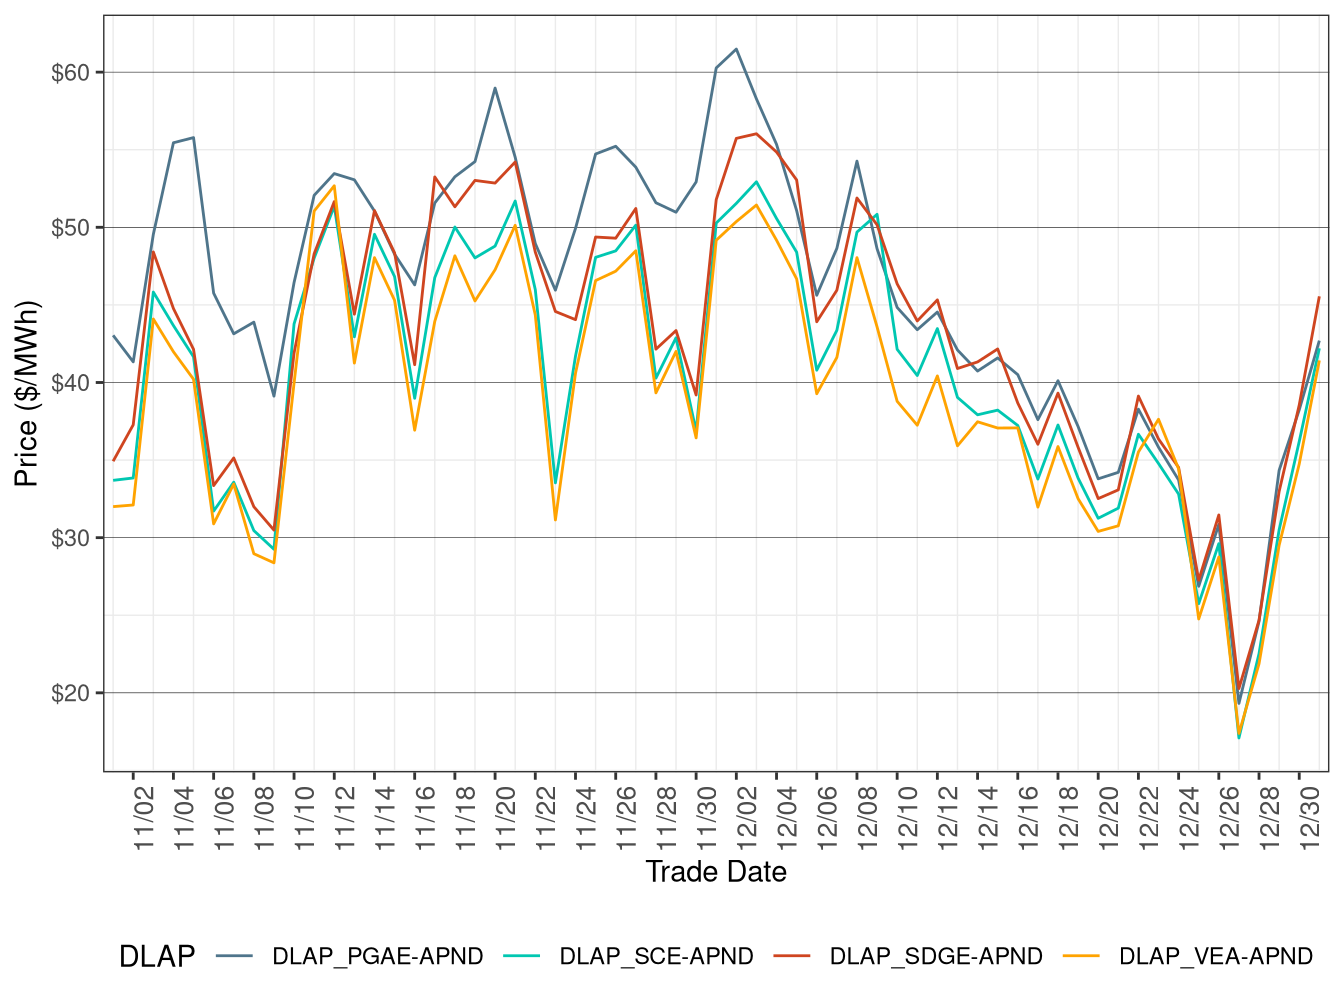
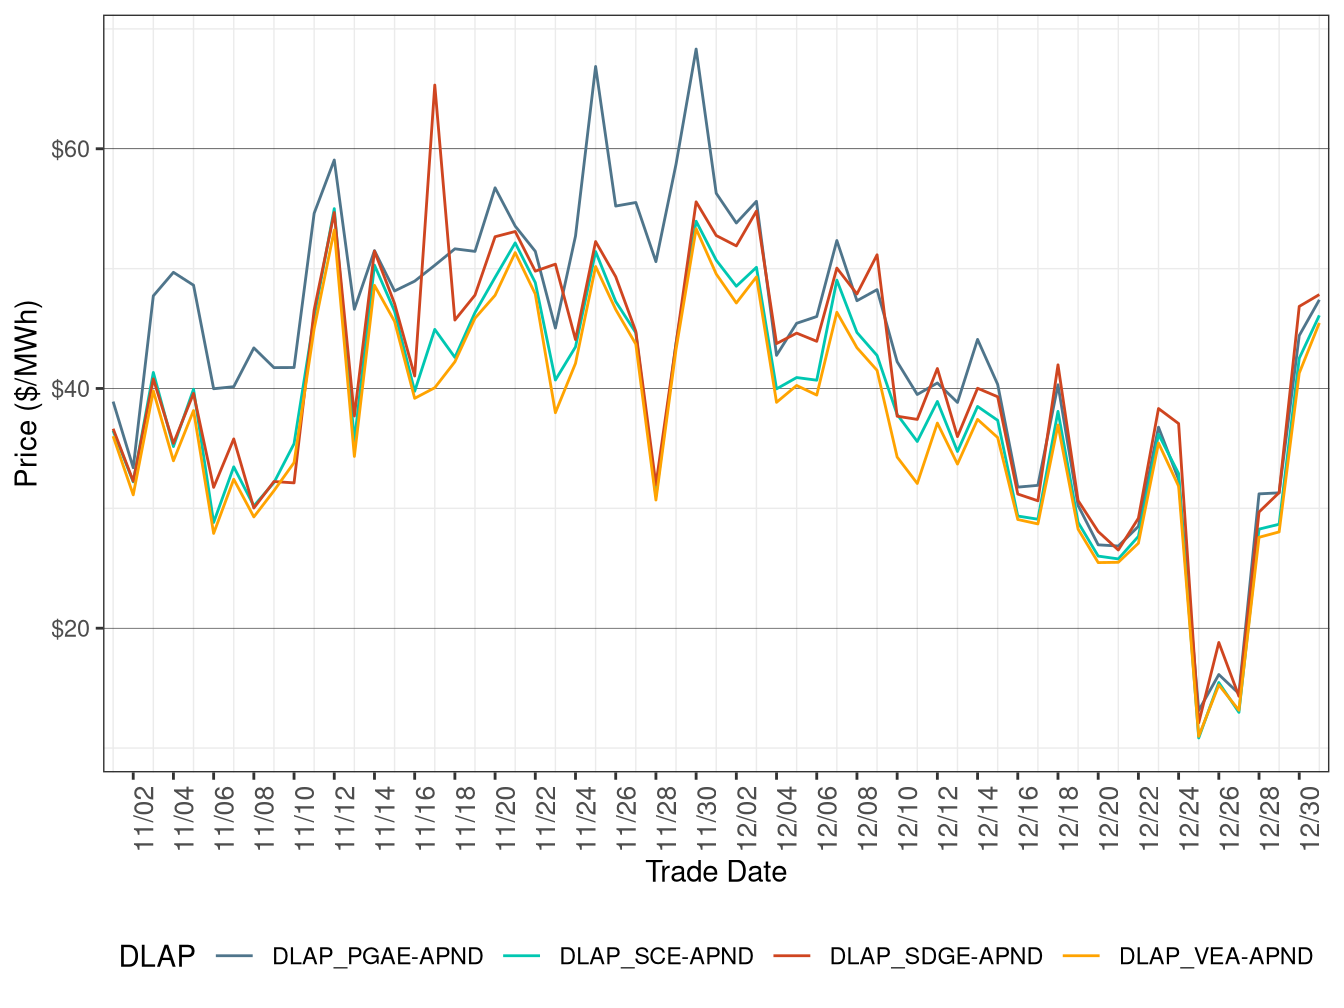
Figure 3.1 shows the daily simple average prices for all hours in IFM for each of the four default load-aggregation points (DLAP): PG&E, SCE, SDG&E, and VEA.
Average Day-Ahead DLAP prices in PGAE, SCE, SDGE, and VEA all decreased between from November to December. This downward trend was likely driven by increased renewable generation in neighboring Balancing Authority Areas (BAAs), which suppressed Locational Marginal Prices (LMPs) system-wide.
TABLE 3.1 below lists the binding constraints that resulted in relatively high or low DLAP prices on certain dates.
Figure 3.1: IFM (Day-Ahead) Simple Average DLAP Prices (All Hours)
| DLAP LMPs Affected | Dates | Transmission Constraint |
|---|---|---|
| PGAE | Dec 1 | GATES1-MIDWAY-500kV line from HE 8 to HE 16 |
| PGAE; SDGE | Dec 2 | PANOCHE-GATES-230kV line from HE 8 to HE 19 |
| PGAE | Dec 3 | GATES1-MIDWAY-500kV line from HE 9 to HE 14 and on the EL CAJON-LOSCOCHS-69kV line from HE 1 to HE 24 |
| PGAE; SDGE | Dec 4 | GATES1-DAIBLO-500kV line from HE 9 to HE 14 and on the PANOCHE-GATES-230kV line from HE 1 to HE 15 |
| PGAE; SDGE; VEA; SCE | Dec 5 | EL CAJON-LOSCOCHS-69kV line from HE 1 to HE 24 and on the PANOCHE-GATES-230kV line from HE 9 to HE 15 |
| PGAE | Dec 6-7 | PANOCHE-GATES-230kV line from HE 9 to HE 15 and on the GATES1-MIDWAY-500kV line from HE 11 to HE 15 |
| PGAE | Dec 8 | CONTROL-TAP188-115kV line from HE 1 to HE 24 and on the MIDWAY-WIRLWIND-500kV line from HE 9 to HE 15 |
| SCE; VEA | Dec 9 | MESA CAL-LAGUBELL-230kV line from HE 9 to HE 17 |
| PGAE; SDGE; VEA; SCE | Dec 10 | DEVERS-DEVERS-500 XFMR from HE 8 to HE 23 |
| PGAE; SDGE; VEA; SCE | Dec 11 | DEVERS-DEVERS-500 XFMR from HE 8 to HE 16 and on the PANOCHE-GATES-230kV line from HE 9 to HE 15 |
| VEA | Dec 12 | CONTROL-TAP188-115kV line from HE 1 to HE 24 and on the LEWIS-SERRANO-230kV line from HE 9 to HE 15 |
| VEA | Dec 13 | EL CAJON-LOSCOCHS-69kV line from HE 1 to HE 24 and on the METCALF-METCALF-115 XFMR from HE 7 to HE 24 |
| PGAE; SDGE; VEA; SCE | Dec 14 | EL CAJON-LOSCOCHS-69kV line from HE 1 to HE 24 |
| PGAE; SDGE; VEA; SCE | Dec 15 | MORAGA-SN LNDRO-115kV line from HE 1 to HE 24 and on the PANOCHE-GATES-230kV line from HE 9 to HE 15 |
| PGAE; VEA | Dec 16-18 | MORAGA-SN LNDRO-115kV line from HE 2 to HE 24 |
| PGAE | Dec 19 | EL CAJON-LOSCOCHS-69kV line from HE 1 to HE 24 |
| PGAE; VEA | Dec 20 | EL CAJON-LOSCOCHS-69kV line from HE 1 to HE 24 and on the PANOCHE-GATES-230kV line from HE 9 to HE 15 |
| PGAE; VEA | Dec 21 | EL CAJON-LOSCOCHS-69kV line from HE 1 to HE 24 |
| PGAE; SDGE; VEA; SCE | Dec 22 | 7820_TL 230S_OVERLOAD_NG nomogram binding from HE 7 to HE 21 |
| VEA | Dec 23-26 | EL CAJON-LOSCOCHS-69kV line from HE 1 to HE 24 |
| VEA | Dec 27-28 | PANOCHE-GATES-230kV line from HE 9 to HE 16 |
| PGAE | Dec 29 | EL CAJON-LOSCOCHS-69kV line from HE 1 to HE 24 and on the MOSSLD-LASAGUIL-230kV line from HE 9 to HE 19 |
| PGAE; SDGE; VEA; SCE | Dec 30-31 | EL CAJON-LOSCOCHS-69kV line from HE 1 to HE 24 |
Real-Time Price
Figure 3.2 shows daily simple average prices for all four DLAPs (PG&E, SCE, SDG&E, and VEA) for all hours respectively in FMM.
Average FMM DLAP prices across PGAE, SCE, SDGE, and VEA decreased relative to the previous month.
TABLE 3.2 below lists the binding constraints that resulted in relatively high or low DLAP prices on certain dates.
Figure 3.2: FMM Simple Average DLAP Prices (All Hours)
| DLAP LMPs Affected | Dates | Transmission Constraint |
|---|---|---|
| PGAE | Dec 1 | GATES1-MIDWAY-500kV line from HE 8 to HE 12 |
| PGAE; SDGE | Dec 3 | GATES1-MIDWAY-500kV line from HE 8 to HE 16 and on the PANOCHE-GATES-230kV line from HE 10 to HE 16 |
| PGAE; SDGE | Dec 4-6 | PANOCHE-GATES-230kV line from HE 9 to HE 16 |
| PGAE; SDGE; VEA; SCE | Dec 7 | GATES1-MIDWAY-500kV line from HE 9 to HE 15 and on the PANOCHE-GATES-230kV line from HE 11 to HE 15 |
| PGAE; SDGE; VEA; SCE | Dec 8 | GATES1-MIDWAY-500kV line from HE 9 to HE 16 |
| PGAE; SDGE; VEA; SCE | Dec 9 | DEVERS-DEVERS-500 XFMR from HE 8 to HE 24 and on the TRES VIS-TBLE MTN-60kV line from HE 10 to HE 24 |
| PGAE; SDGE; VEA; SCE | Dec 10-11 | DEVERS-DEVERS-500 XFMR from HE 7 to HE 13 and on the LEWIS-SERRANO-230kV line from HE 13 to HE 16 |
| PGAE; SDGE; VEA; SCE | Dec 12 | PANOCHE-GATES-230kV line from HE 8 to HE 16 and on the LEWIS-SERRANO-230kV line from HE 9 to HE 15 |
| PGAE; SDGE; VEA; SCE | Dec 13 | METCALF-METCALF-115 XFMR from HE 7 to HE 24 and on the GATES1-MIDWAY-500kV line from HE 9 to HE 15 |
| PGAE | Dec 14 | METCALF-METCALF-115 XFMR from HE 1 to HE 16 and on the EL CAJON-LOSCOCHS-69kV line from HE 9 to HE 24 |
| SDGE | Dec 16 | PANOCHE-GATES-230kV line from HE 9 to HE 15 |
| PGAE; SDGE | Dec 17 | 6110_COI_N-S nomogram binding from HE 4 to HE 7 and 6410_CP7_NG binding from HE 10 to HE 23 |
| PGAE; SDGE; VEA; SCE | Dec 18-19 | EL-CAJON-LOSCOCHS-69kV line from HE 4 to HE 17 |
| SDGE | Dec 20 | EL CAJON-LOSCOCHS-69kV line from HE 11 to HE 17 |
| SDGE | Dec 22 | 7820_TL23040_IV_SPS_NG nomogram binding from HE 8 to HE 9 |
| SDGE | Dec 23 | EL CAJON-LOSCOCHS-69kV line from HE 8 to HE 23 |
| SDGE | Dec 24 | EL CAJON-LOSCOCHS-69kV line from HE 7 to HE 24 |
| PGAE; SDGE | Dec 25 | 6410_CP7_NG nomogram binding from HE 9 to HE 16 |
| SDGE | Dec 26 | EL CAJON-LOSCOCHS-69kV line from HE 1 to HE 24 |
| PGAE; SDGE | Dec 27-28 | 6410_CP7_NG nomogram binding from HE 8 to HE 10 |
| PGAE; SDGE | Dec 29 | EL CAJON-LOSCOCHS-69kV line from HE 7 to HE 24 and on the MOSSLD-LASAGUIL-230kV line from HE 10 to HE 16 |
| PGAE; SDGE; VEA; SCE | Dec 30 | EL CAJON-LOSCOCHS-69kV line from HE 1 to HE 21 |
| PGAE; SDGE; VEA; SCE | Dec 31 | CARIBOU-CARBOU-115 XFMR from HE 6 to HE 24 |
Figure 3.3 below shows the daily frequency of positive price spikes and negative prices by price range for the DLAPs in the FMM.
The cumulative frequency of prices in FMM above $250/MWh decreased from 0.0174 percent in November to 0 in December, while the cumulative frequency of negative prices increased from 1.31 percent in November to 2.23 percent in December, correlated with an increase in renewable generation curtailment.
Figure 3.3: Daily Frequency of FMM DLAP Positive Price Spikes and Negative Prices
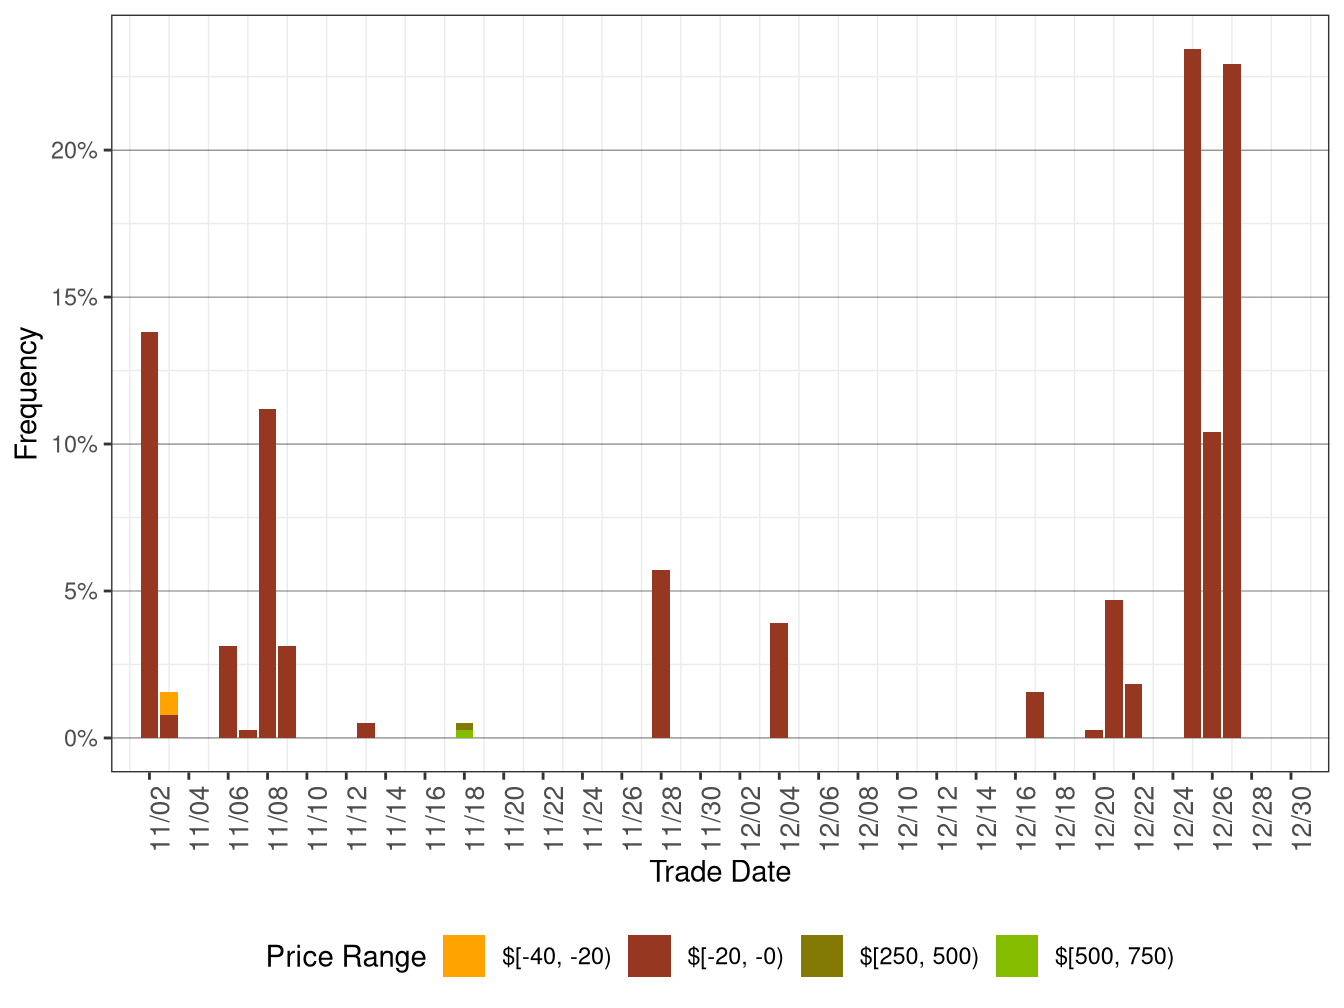
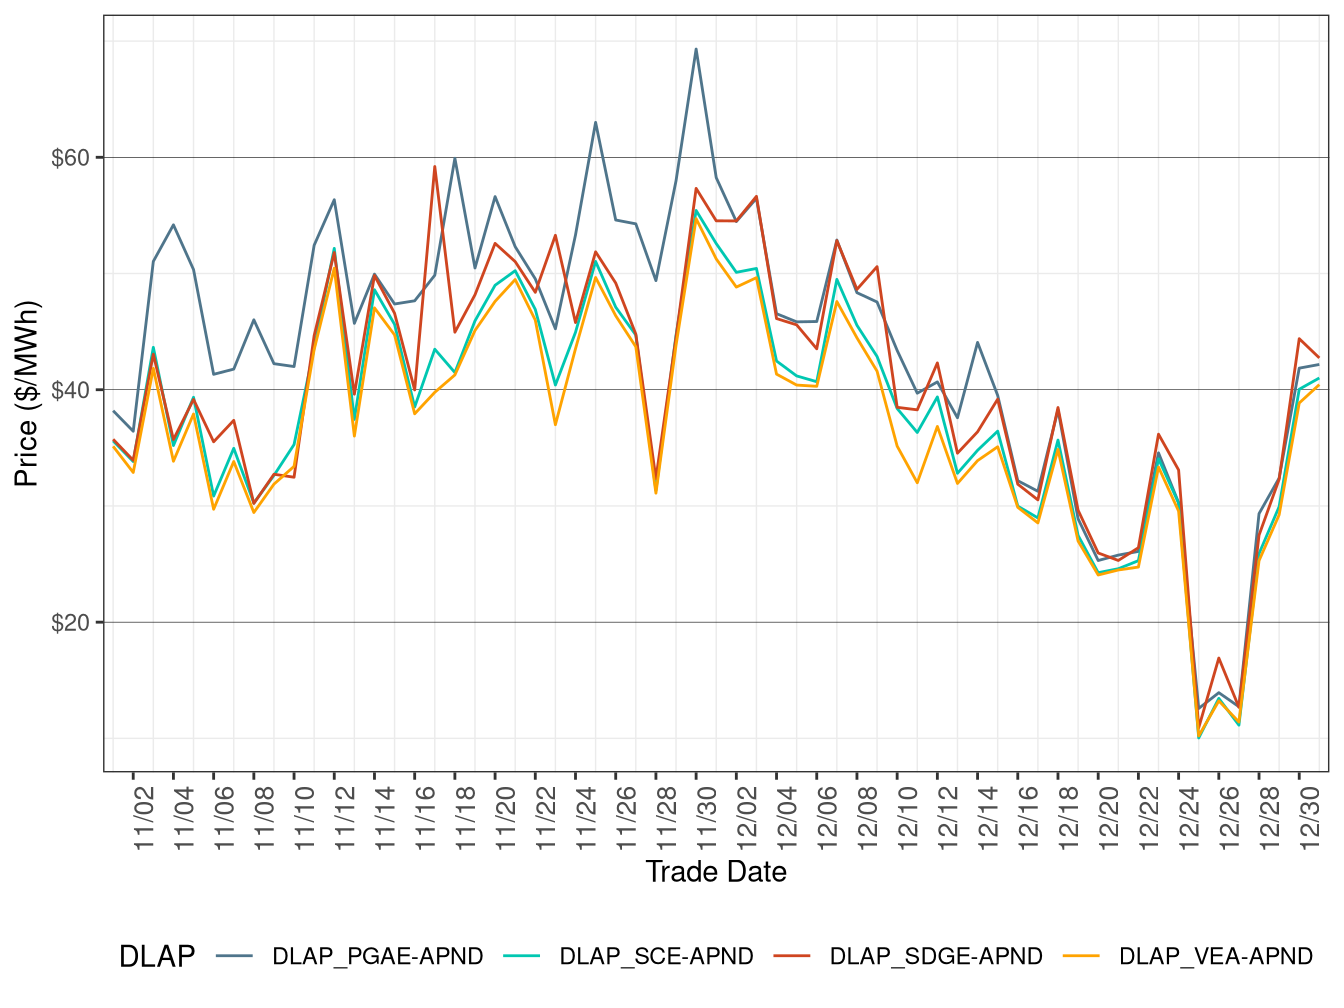
Figure 3.4 shows daily simple average prices for all the DLAPs (PG&E, SCE, SDG&E, and VEA) for all hours respectively in RTD.
Average RTD DLAP prices across PGAE, SCE, SDGE, and VEA decreased relative to the previous month.
TABLE 3.3 below lists the binding constraints that resulted in relatively high or low DLAP prices on certain dates.
Figure 3.4: RTD Simple Average DLAP Prices (All Hours)
| DLAP LMPs Affected | Dates | Transmission Constraint |
|---|---|---|
| PGAE; SDGE | Dec 1 | GATES1-MIDWAY-500kV line from HE 8 to HE 12 |
| PGAE; SDGE | Dec 2 | SILVERGT-OLDTWNTP-230kV line from HE 8 to HE 13 and on the GATES1-MIDWAY-500kV line from HE 10 to HE 16 |
| PGAE; SDGE | Dec 3 | GATES1-MIDWAY-500kV line from HE 8 to HE 16 and on the PENSQTOS-MIRAMRTP-69kV line from HE 8 to HE 17 |
| PGAE; SDGE | Dec 4 | PANOCHE-GATES-230kV line from HE 8 to HE 16 |
| PGAE; SDGE | Dec 5-6 | EL CAJON-LOSCOCHS-69kV line from HE 4 to HE 23 and on the PANOCHE-GATES-230kV line from HE 8 to HE 16 |
| PGAE; SDGE; VEA; SCE | Dec 7 | GATES1-MIDWAY-500kV line from HE 9 to HE 16 and on the PANOCHE-GATES-230kV line from HE 11 to HE 15 |
| PGAE; SDGE; VEA; SCE | Dec 8 | MORROBAY-SOLARSS-230kV line from HE 11 to HE 15 |
| PGAE; SDGE; VEA; SCE | Dec 9 | GATES1-MIDWAY-500kV line from HE 8 to HE 16 |
| PGAE; SDGE; VEA; SCE | Dec 10 | DEVERS-DEVERS-500 XFMR from HE 8 to HE 24 and on the TRES VIS-TBLE MTN-60kV line from HE 10 to HE 24 |
| PGAE; SDGE; VEA; SCE | Dec 11 | DEVERS-DEVERS-500 XFMR from HE 8 to HE 13 and on the LEWIS-SERRANO-230kV line from HE 13 to HE 16 |
| PGAE; SDGE; VEA; SCE | Dec 12 | PANOCHE-GATES-230kV line from HE 9 to HE 16 and on the LEWIS-SERRANO-230kV line from HE 10 to HE 15 |
| PGAE; SDGE | Dec 13 | METCALF-METCALF-115 XFMR from HE 7 to HE 24 and on the GATES1-MIDWAY-500kV line from HE 9 to HE 15 |
| PGAE | Dec 14 | METCALF-METCALF-115 XFMR from HE 1 to HE 16 and on the EL CAJON-LOSCOCHS-69kV line from HE 8 to HE 24 |
| SDGE | Dec 15 | PANOCHE-GATES-230kV line from HE 9 to HE 10 |
| SDGE | Dec 16 | 7820_TL23040_IV_SPS_NG nomogram binding from HE 8 to HE 9 |
| PGAE; SDGE | Dec 17 | 6110_COI_N-S nomogram binding from HE 3 to HE 7 and 6410_CP7_NG binding from HE 9 to HE 22 |
| SDGE | Dec 18-19 | EL-CAJON-LOSCOCHS-69kV line from HE 4 to HE 17 |
| SDGE | Dec 20-22 | 7820_TL23040_IV_SPS_NG nomogram binding from HE 8 to HE 11 |
| SDGE | Dec 23 | EL CAJON-LOSCOCHS-69kV line from HE 8 to HE 24 |
| SDGE | Dec 24 | EL CAJON-LOSCOCHS-69kV line from HE 2 to HE 24 and on the MIDWAY-VINCENT-500kV line from HE 14 to HE 16 |
| PGAE; SDGE | Dec 25 | 6410_CP7_NG nomogram binding from HE 9 to HE 16 |
| SDGE | Dec 26 | EL CAJON-LOSCOCHS-69kV line from HE 1 to HE 24 |
| PGAE; SDGE; VEA; SCE | Dec 27 | LOSBANOS-GATES1-500kV line from HE 9 to HE 13 and on the PANOCHE-GATES-230kV line from HE 15 to HE 20 |
| PGAE | Dec 28 | EL CAJON-LOSCOCHS-69kV line from HE 1 to HE 20 |
| PGAE; SDGE | Dec 29 | EL CAJON-LOSCOCHS-69kV line from HE 7 to HE 24 and on the MOSSLD-LASAGUIL-230kV line from HE 10 to HE 16 |
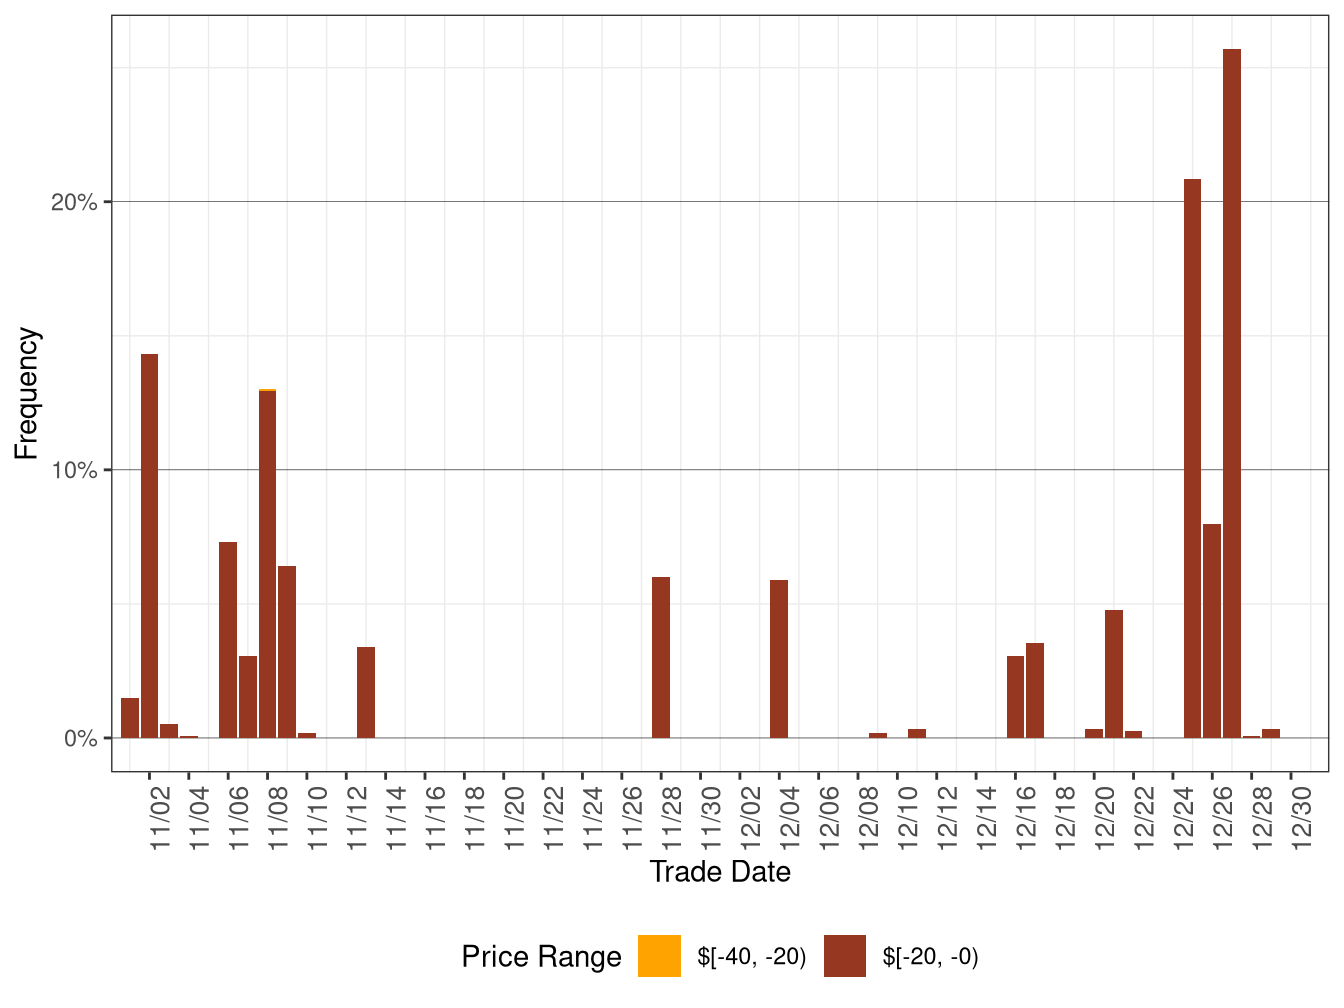
Figure 3.5 below shows the daily frequency of positive price spikes and negative prices by price range for the DLAPs in RTD.
The cumulative frequency of prices in RTD above $250/MWh maintained at 0 from November to December, while the cumulative frequency of negative prices increased from 1.86 percent in November to 2.37 percent in December, correlated with a increase in renewable generation curtailment.
Figure 3.5: Daily Frequency of RTD DLAP Positive Price Spikes and Negative Prices