3 Market Performance Metrics
Day-Ahead Prices
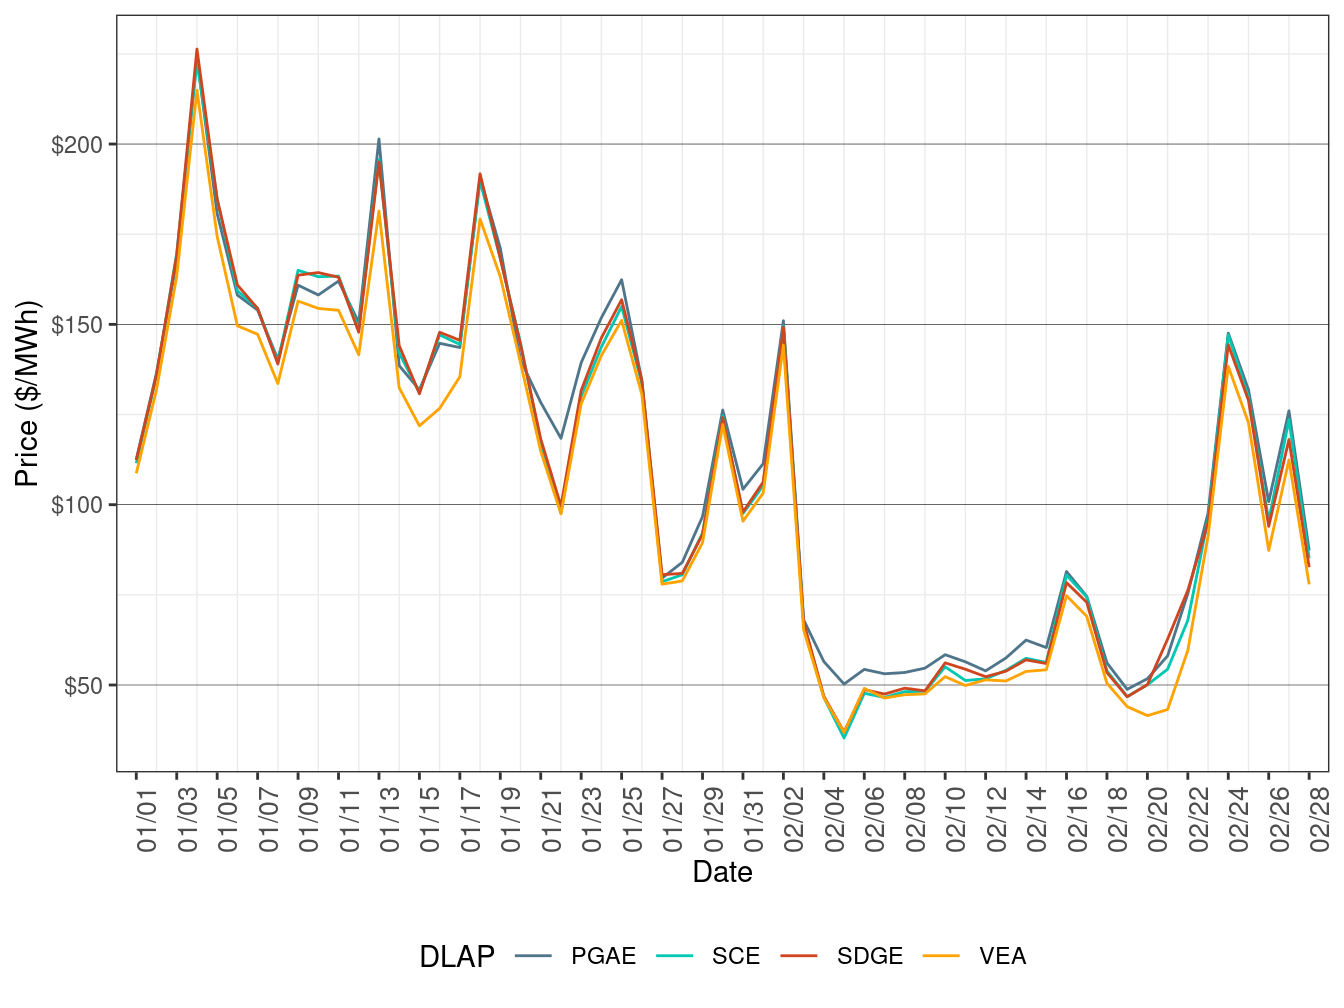
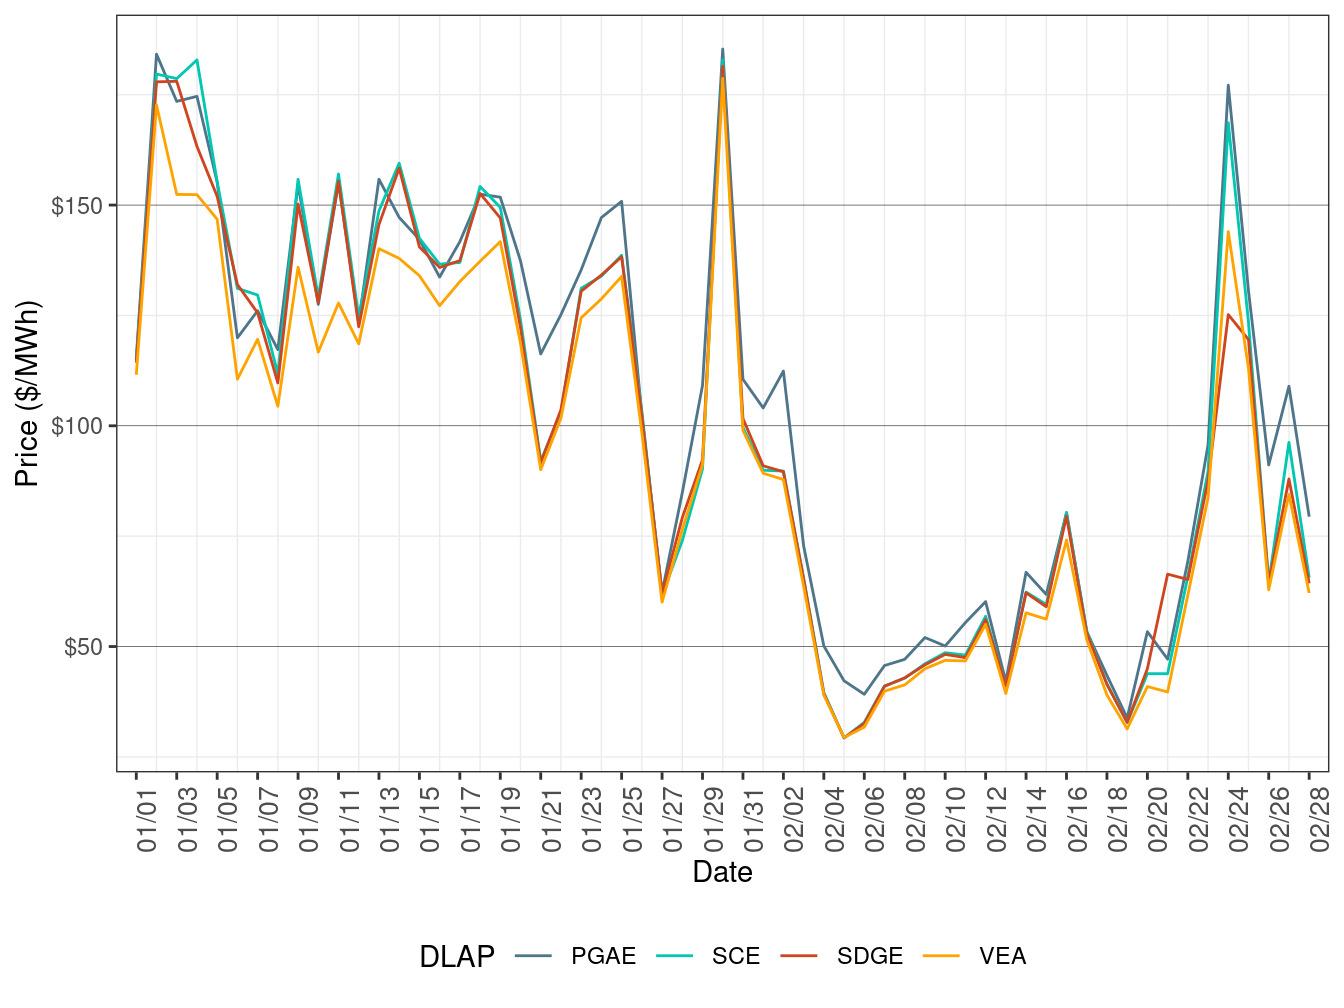
Figure 2 shows the daily simple average prices for each of the four default load-aggregation points (DLAP): PG&E, SCE, SDG&E, and VEA. All four DLAP LMPs fell further in February driven by declining natural gas prices.
TABLE 3 below lists the binding constraints that resulted in relatively high or low DLAP prices on certain dates.
Figure 2: Day-Ahead Simple Average DLAP Prices (All Hours)
| DLAP LMPs Affected | Dates | Transmission Constraint |
|---|---|---|
Real-Time Price
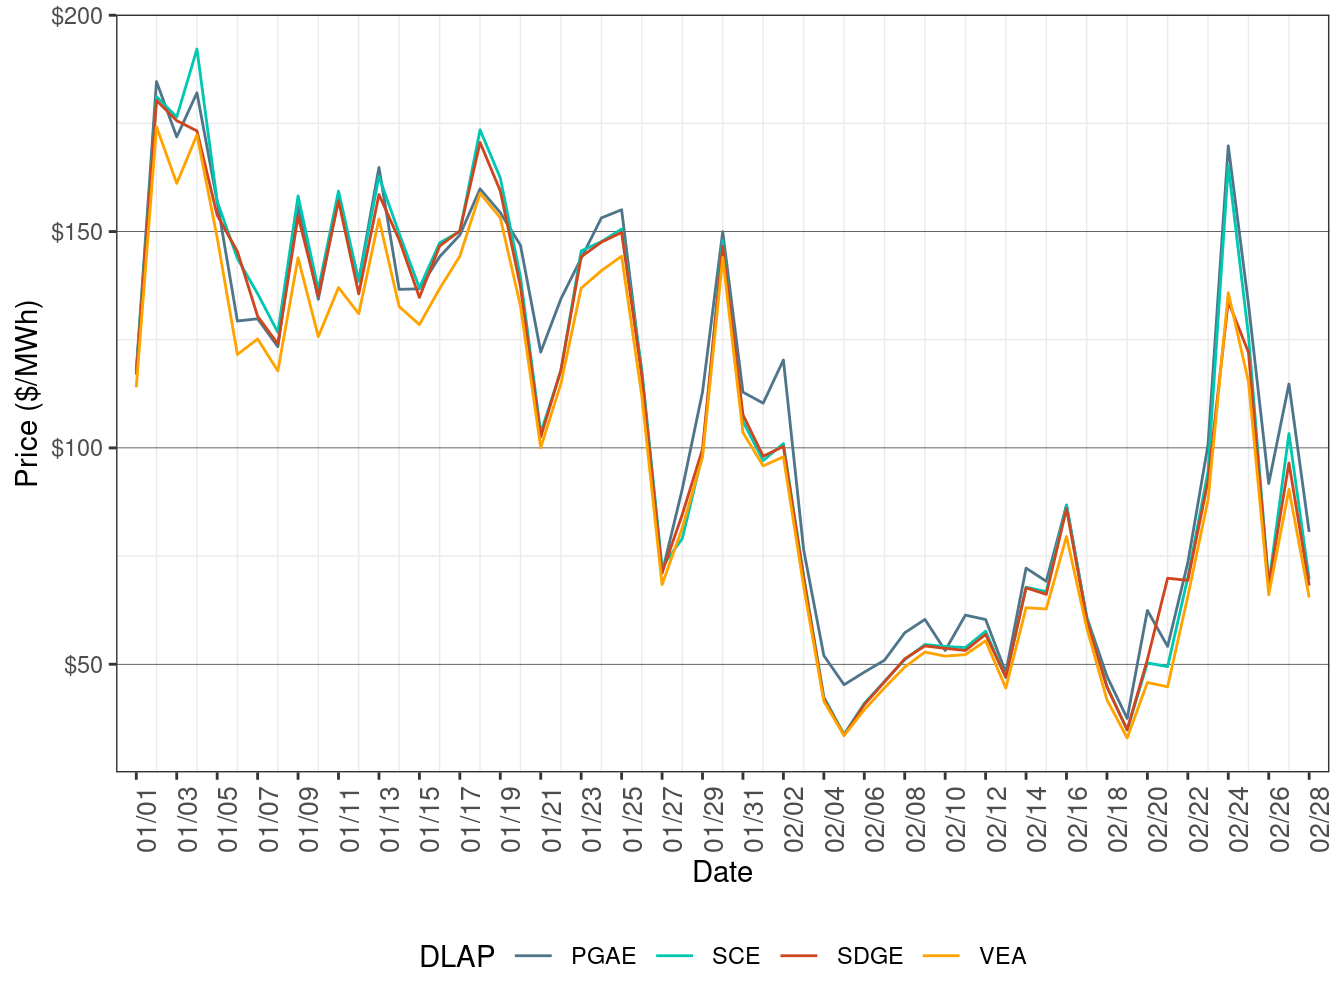
Figure 3 shows daily simple average prices for all four DLAPs (PG&E, SCE, SDG&E, and VEA) for all hours respectively in FMM. All four DLAP prices fell further in February due to lower natural gas prices.
TABLE 4 below lists the binding constraints that resulted in relatively high or low DLAP prices on certain dates.
Figure 3: FMM Simple Average DLAP Prices (All Hours)
| DLAP LMPs Affected | Dates | Transmission Constraint |
|---|---|---|
| SCE | February 24 | SANLUSRY-S.ONOFRE-230kV line |
| PGAE | February 26 | PANOCHE-GATES-230kV line |
Figure 4 below shows the daily frequency of positive price spikes and negative prices by price range for the DLAPs in the FMM. The cumulative frequency of prices above $250/MWh decreased to 0.11 percent in February from 1.34 percent in January, while the cumulative frequency of negative prices rose to 2.53 percent in February from 0.09 percent in January, due to falling natural gas prices.
Figure 4: Daily Frequency of FMM DLAP Positive Price Spikes and Negative Prices
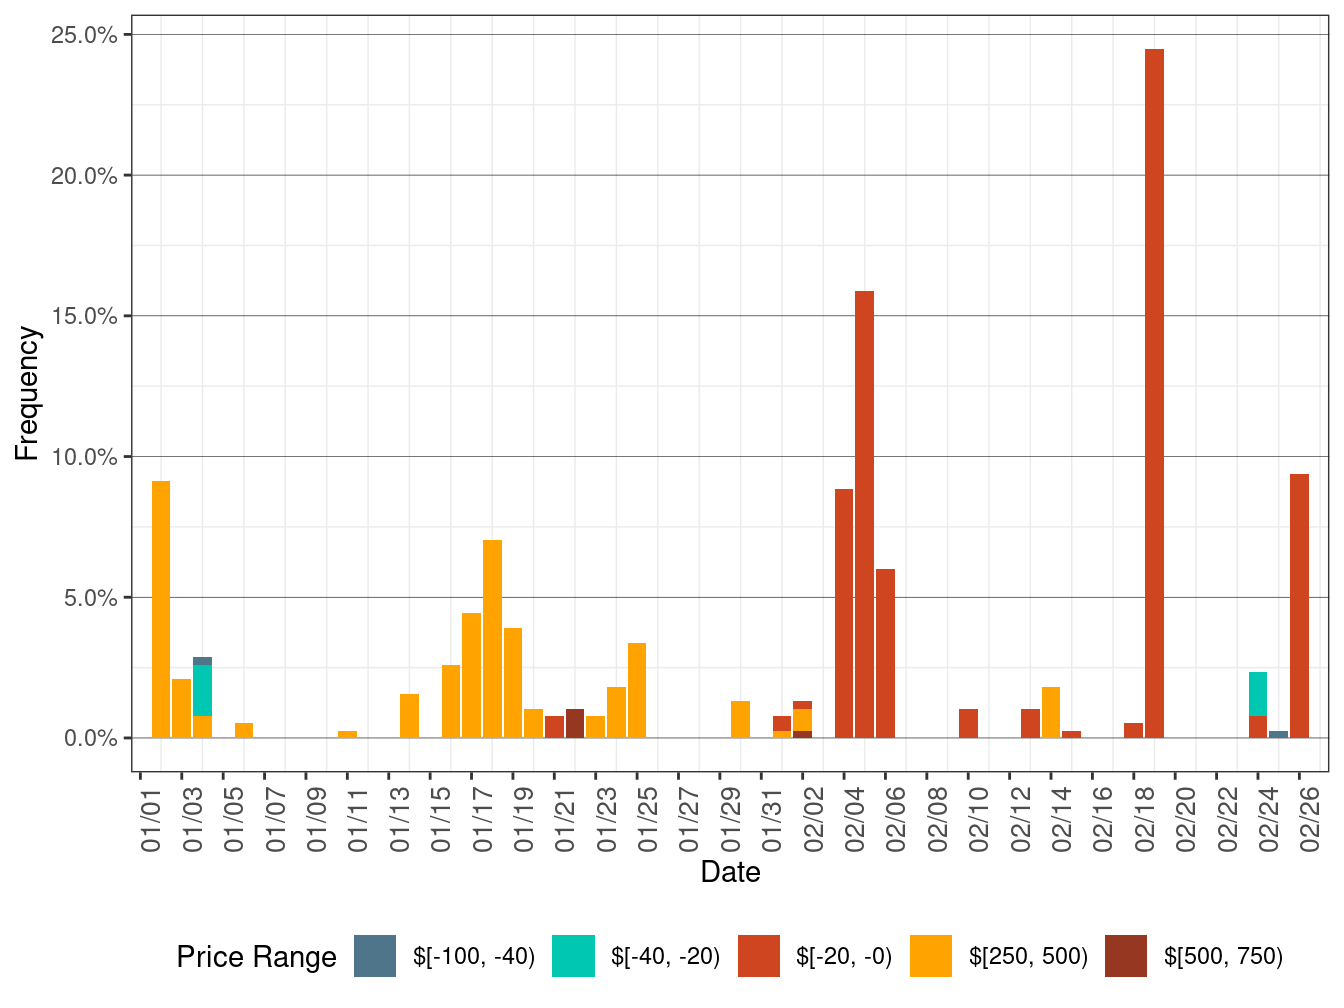
Figure 5 shows daily simple average prices for all the DLAPs (PG&E, SCE, SDG&E, and VEA) for all hours respectively in RTD. In February, all four DLAP prices dropped due to lowered natural gas prices.
TABLE 5 below lists the binding constraints that resulted in relatively high or low DLAP prices on certain dates.
Figure 5: RTD Simple Average DLAP Prices (All Hours)
| DLAP | Dates | Transmission Constraint |
|---|---|---|
| SCE | February 24 | LUGO-VICTORVL-500kV line |
| PGAE | February 26 | PANOCHE-GATES-230kV line |
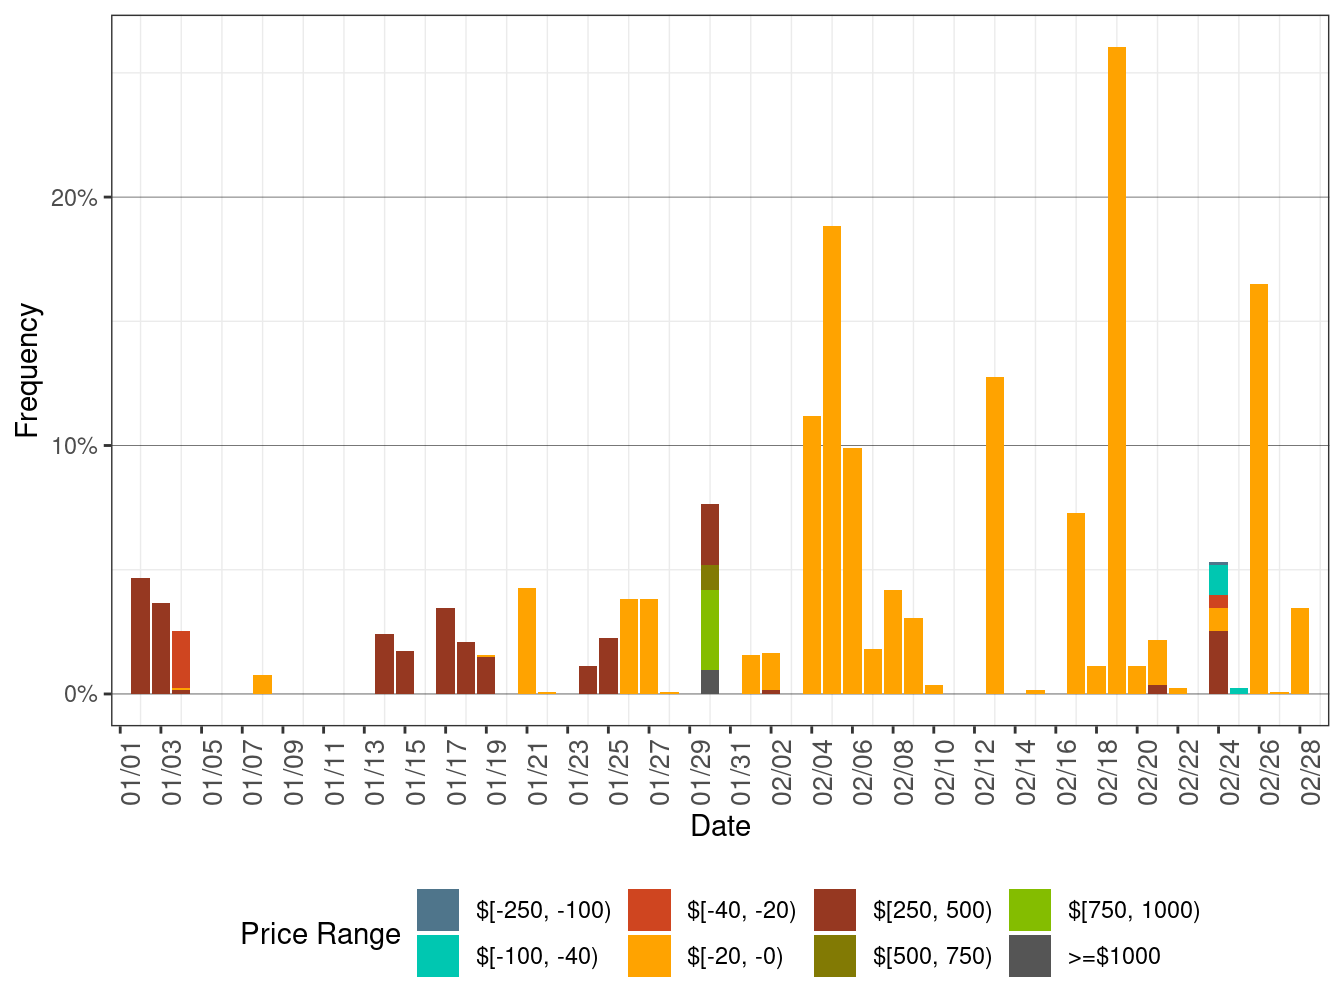
Figure 6 below shows the daily frequency of positive price spikes and negative prices by price range for the DLAPs in RTD. The cumulative frequency of prices above $250/MWh fell to 0.11 percent in February from 0.99 percent in January, while the cumulative frequency of negative prices rose to 4.50 percent in February from 0.49 percent in January, due to falling natural gas prices.
Figure 6: Daily Frequency of RTD DLAP Positive Price Spikes and Negative Prices