Section 5 Congestion Revenue Rights
Congestion Revenue Rights are a financial tool developed for the purpose of allowing load and exports to hedge against congestion charges paid when congestion occurs on a transmission line (aka congestion rents as was described in the previous section). If the congestion occurs in the same direction the CRR is held for the CRR holder is paid, but the CRR holder may have an obligation to pay if congestion occurs in the opposite direction.
Congestion revenue rights auction efficiency 1B became effective on January 1, 2019. It includes key changes related to the congestion revenue rights settlements process:
- Targeted reduction of congestion revenue rights payouts on a constraint by constraint basis.
- Distribute congestion revenues to the extent that CAISO collected the requisite revenue on the constraint over the month. That is, implement a pro-rata funding for CRRs.
- Allow surpluses on one constraint in one hour to offset deficits on the same constraint in another hour over the course of the month.
- Only distribute surpluses to congestion revenue rights if the surplus is collected on a constraint that the congestion revenue right accrued a deficit, and only up to the full target payment value of the congestion revenue right.
- Distribute remaining surplus revenue at the end of the month, which are associated with constraints that collect more surplus over the month than deficits, to measured demand.
Monthly CRR Revenue
Figure 5.1 illustrates the daily CRR notional value in the corresponding month for the various transmission elements that experienced congestion during the month. CRR notional value is calculated as the product of CRR implied flow (MW) and constraint shadow price ($/MWh) in each hour per constraint and CRR.
Figure 5.1: Daily CRR Notional Value by Transmission Element
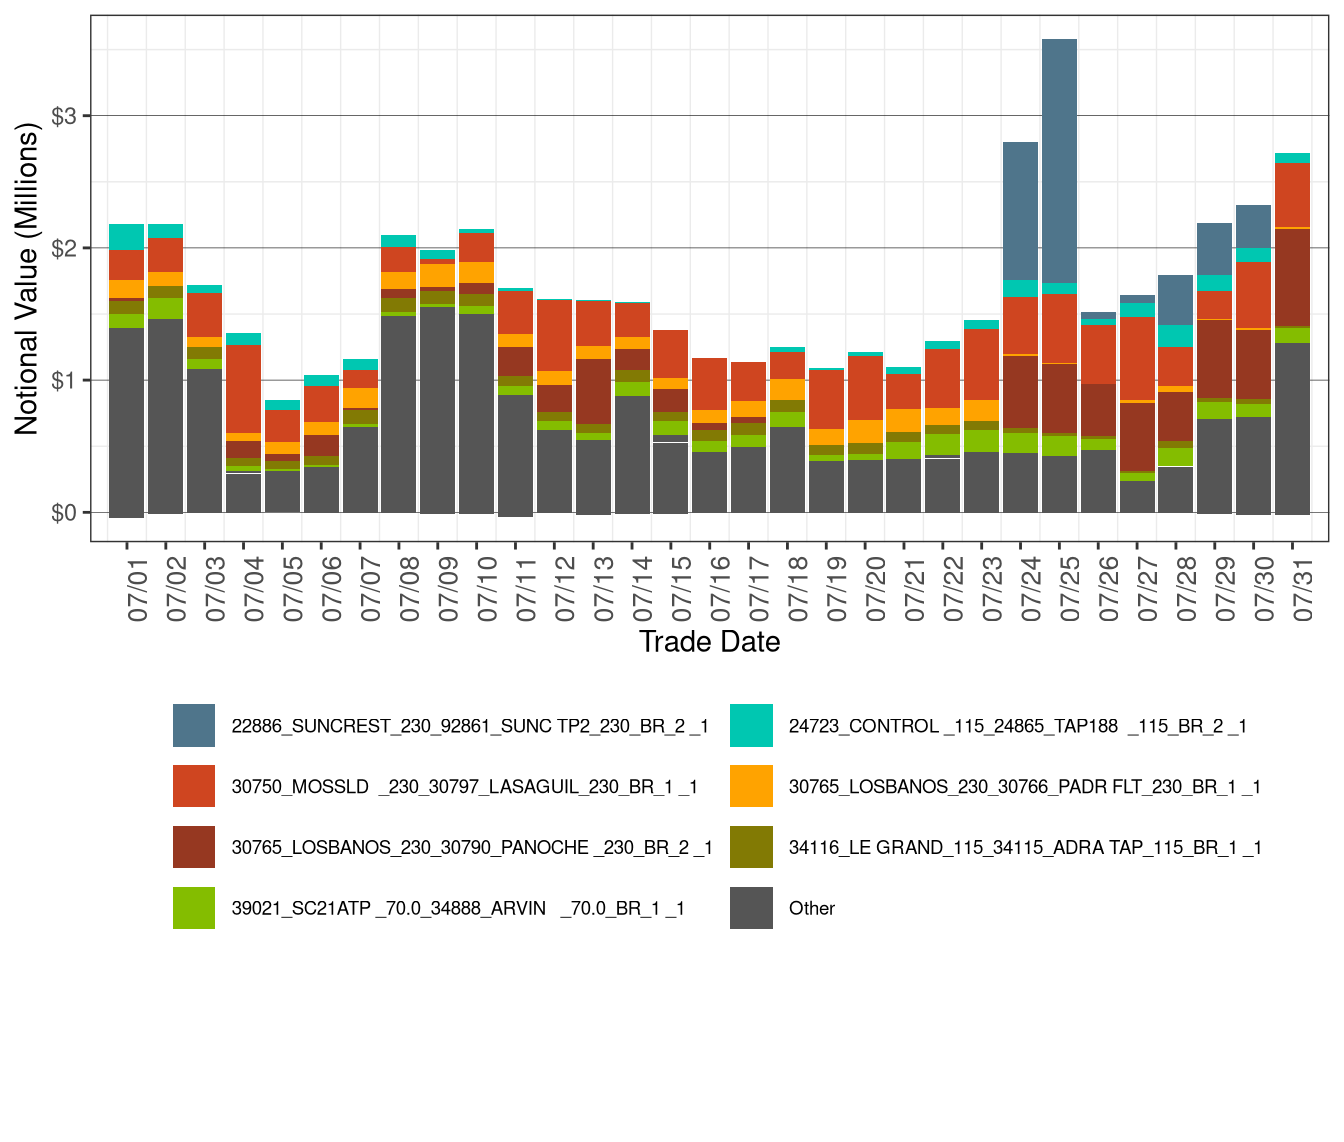
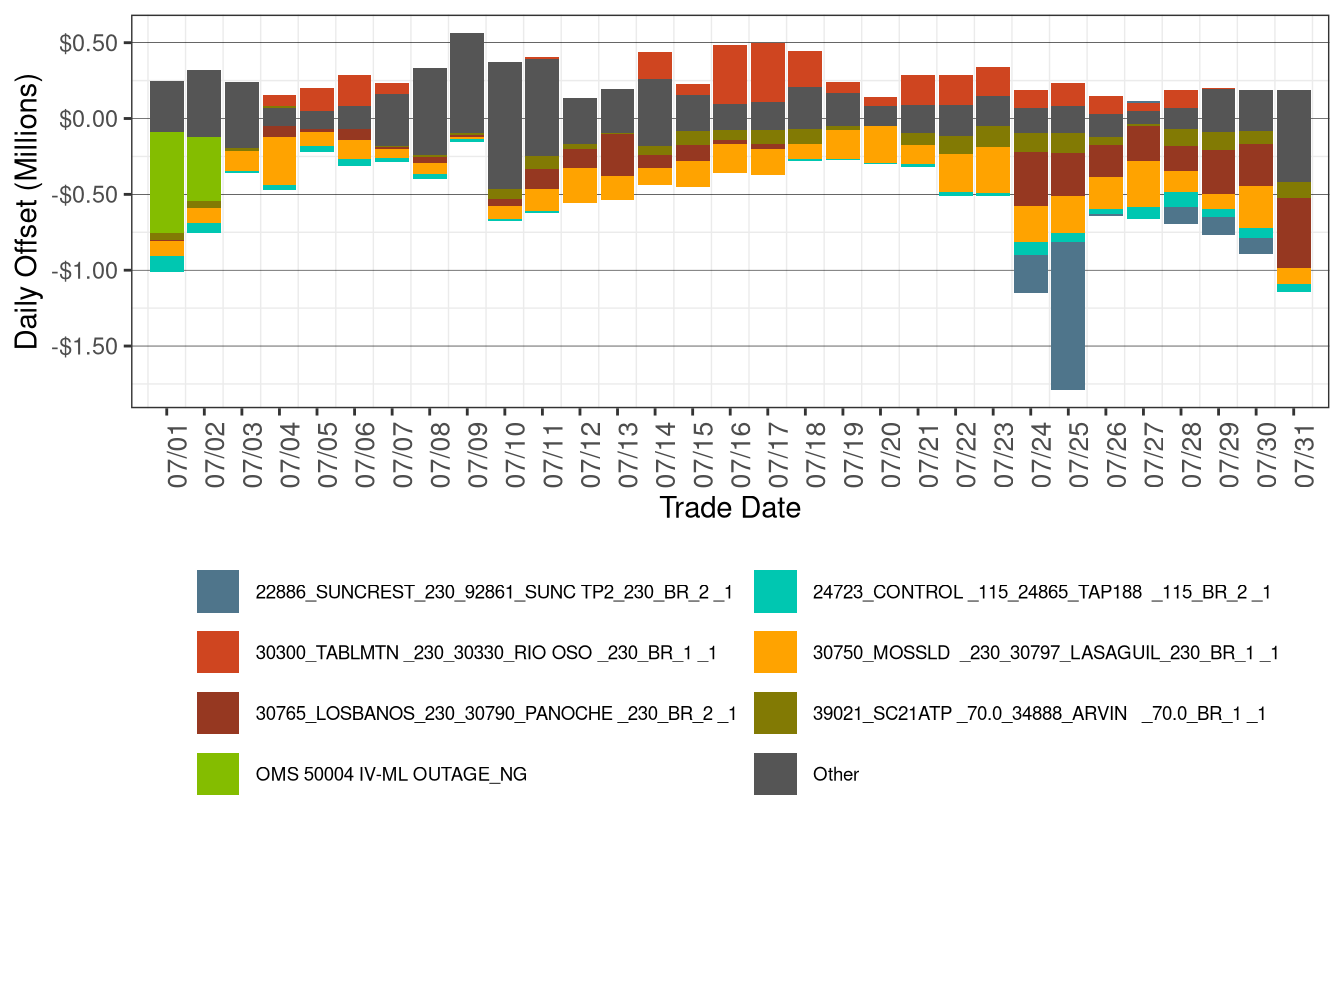
Figure 5.2 illustrates the daily CRR offset value in the corresponding month for the transmission elements that experienced congestion during the month. CRR offset value is the difference between the revenue collected from the congestion and the CRR notional value. A positive CRR offset value represents surplus and a negative CRR offset value represents shortfall.
As shown below, table 5.1 shows the percentage of monthly CRR deficit by transmission element and Table 5.2 shows the percentage of monthly CRR surplus by transmission element.
Figure 5.2: Daily CRR Offset Value by Transmission Element
| Constraint | Percent |
|---|---|
| 30750_MOSSLD _230_30797_LASAGUIL_230_BR_1 _1 | 28.48 |
| 30765_LOSBANOS_230_30790_PANOCHE _230_BR_2 _1 | 18.67 |
| Other | 12.65 |
| 39021_SC21ATP _70.0_34888_ARVIN _70.0_BR_1 _1 | 11.00 |
| 22886_SUNCREST_230_92861_SUNC TP2_230_BR_2 _1 | 8.78 |
| OMS 50004 IV-ML OUTAGE_NG | 6.07 |
| 24723_CONTROL _115_24865_TAP188 _115_BR_2 _1 | 5.78 |
| 7820_TL23040_IV_SPS_NG | 3.50 |
| 7430_KTTLM_GATES_70_1 | 2.05 |
| 35618_SN JSE A_115_35616_SNJOSEB _115_BR_1 _1 | 1.67 |
| 92321_SYCA TP2_230_22832_SYCAMORE_230_BR_2 _1 | 1.35 |
| Constraint | Percent |
|---|---|
| 30300_TABLMTN _230_30330_RIO OSO _230_BR_1 _1 | 35.82 |
| Other | 29.81 |
| NOB_ITC | 8.75 |
| 24602_VICTOR _115_24607_ROADWAY _115_BR_1 _1 | 7.34 |
| 30765_LOSBANOS_230_30766_PADR FLT_230_BR_1 _1 | 5.97 |
| 24091_MESA CAL_230_24076_LAGUBELL_230_BR_2_1 | 3.21 |
| 30060_MIDWAY _500_24156_VINCENT _500_BR_2 _3 | 2.75 |
| 31336_HPLND JT_60.0_31370_CLVRDLJT_60.0_BR_1 _1 | 1.90 |
| 35107_DUMBARTN_115_35120_NEWARK D_115_BR_1 _1 | 1.64 |
| 34214_LOS BANS_70.0_34272_WRGHT PP_70.0_BR_1 _1 | 1.43 |
| 31486_CARIBOU 115_30255_CARBOU M 1.0_XF_11 | 1.38 |
The main reasons for CRR offset shortfall were
- The line 30750_MOSSLD _230_30797_LASAGUIL_230_BR_1 _1 was binding on 31 days of this month, resulting in offset shortfall of $5.1 million.
- The line 30765_LOSBANOS_230_30790_PANOCHE _230_BR_2 _1 was binding on 23 days of this month, resulting in offset shortfall of $3.35 million.
The main reasons for CRR offset surplus were
- *The line 30300_TABLMTN _230_30330_RIO _230_BR_1 _1 was binding on 22 days of this month, resulting in offset surplus of $3.04 million.*
Table 5.3 shows the percentage of monthly CRR payment by transmission element.
| Constraint | Percent |
|---|---|
| Other | 34.20 |
| 30750_MOSSLD _230_30797_LASAGUIL_230_BR_1 _1 | 16.99 |
| 30765_LOSBANOS_230_30766_PADR FLT_230_BR_1 _1 | 8.40 |
| 30765_LOSBANOS_230_30790_PANOCHE _230_BR_2 _1 | 7.94 |
| 22886_SUNCREST_230_92861_SUNC TP2_230_BR_2 _1 | 7.31 |
| 34116_LE GRAND_115_34115_ADRA TAP_115_BR_1 _1 | 5.63 |
| 24091_MESA CAL_230_24076_LAGUBELL_230_BR_2_1 | 5.32 |
| 7430_CP6_NG | 4.13 |
| 24602_VICTOR _115_24607_ROADWAY _115_BR_1 _1 | 4.03 |
| 30060_MIDWAY _500_24156_VINCENT _500_BR_2 _3 | 3.17 |
| 24723_CONTROL _115_24865_TAP188 _115_BR_2 _1 | 2.90 |
Table 5.4 shows the monthly CRR statistics. The Net Monthly Balancing Surplus calculates as CRR Surplus plus CRR Daily Balancing Account minus total auction revenue. The total auction revenue is the sum of Monthly Auction Revenue and Annual Auction Revenue. The Allocation to Measured demand is calculated as sum of total auction revenue and Net Monthly Balancing Surplus.
Net Monthly Balancing Surplus in July was $6.4 million. The auction revenues credited to the balancing account for July were $5.76 million. As a result, the balancing account had a surplus of approximately $12.16 million compared to $9.79 million in the previous month, which was allocated to measured demand.
| Description | JULY -2025 | JUNE -2025 |
|---|---|---|
| CRR Notional Value | $52,599,354 | $46,074,654 |
| CRR Deficit | -$17,894,572 | -$12,283,615 |
| CRR Settlement Rule | -$2,627 | -$958 |
| CRR Adjusted Payment | $34,702,155 | $33,790,082 |
| CRR Surplus | $8,496,918 | $6,988,424 |
| Monthly Auction Revenue | $3,536,335 | $1,844,939 |
| Annual Auction Revenue | $2,257,622 | $4,464,235 |
| CRR Daily Balancing Account | $3,664,918 | $2,799,798 |
| Net Monthly Balancing Surplus | $6,367,880 | $3,479,047 |
| Allocation to Measured Demand | $12,161,837 | $9,788,221 |