5 Congestion Revenue Rights
Congestion revenue rights auction efficiency 1B became effective on January 1, 2019. It includes key changes related to the congestion revenue rights settlements process:
- Targeted reduction of congestion revenue rights payouts on a constraint by constraint basis.
- Distribute congestion revenues to the extent that CAISO collected the requisite revenue on the constraint over the month. That is, implement a pro-rata funding for CRRs.
- Allow surpluses on one constraint in one hour to offset deficits on the same constraint in another hour over the course of the month.
- Only distribute surpluses to congestion revenue rights if the surplus is collected on a constraint that the congestion revenue right accrued a deficit, and only up to the full target payment value of the congestion revenue right.
- Distribute remaining surplus revenue at the end of the month, which are associated with constraints that collect more surplus over the month than deficits, to measured demand.
Monthly CRR Revenue
Figure 11 illustrates the daily CRR notional value in the corresponding month for the various transmission elements that experienced congestion during the month. CRR notional value is calculated as the product of CRR implied flow (MW) and constraint shadow price ($/MWh) in each hour per constraint and CRR.
Figure 11: Daily CRR Notional Value by Transmission Element
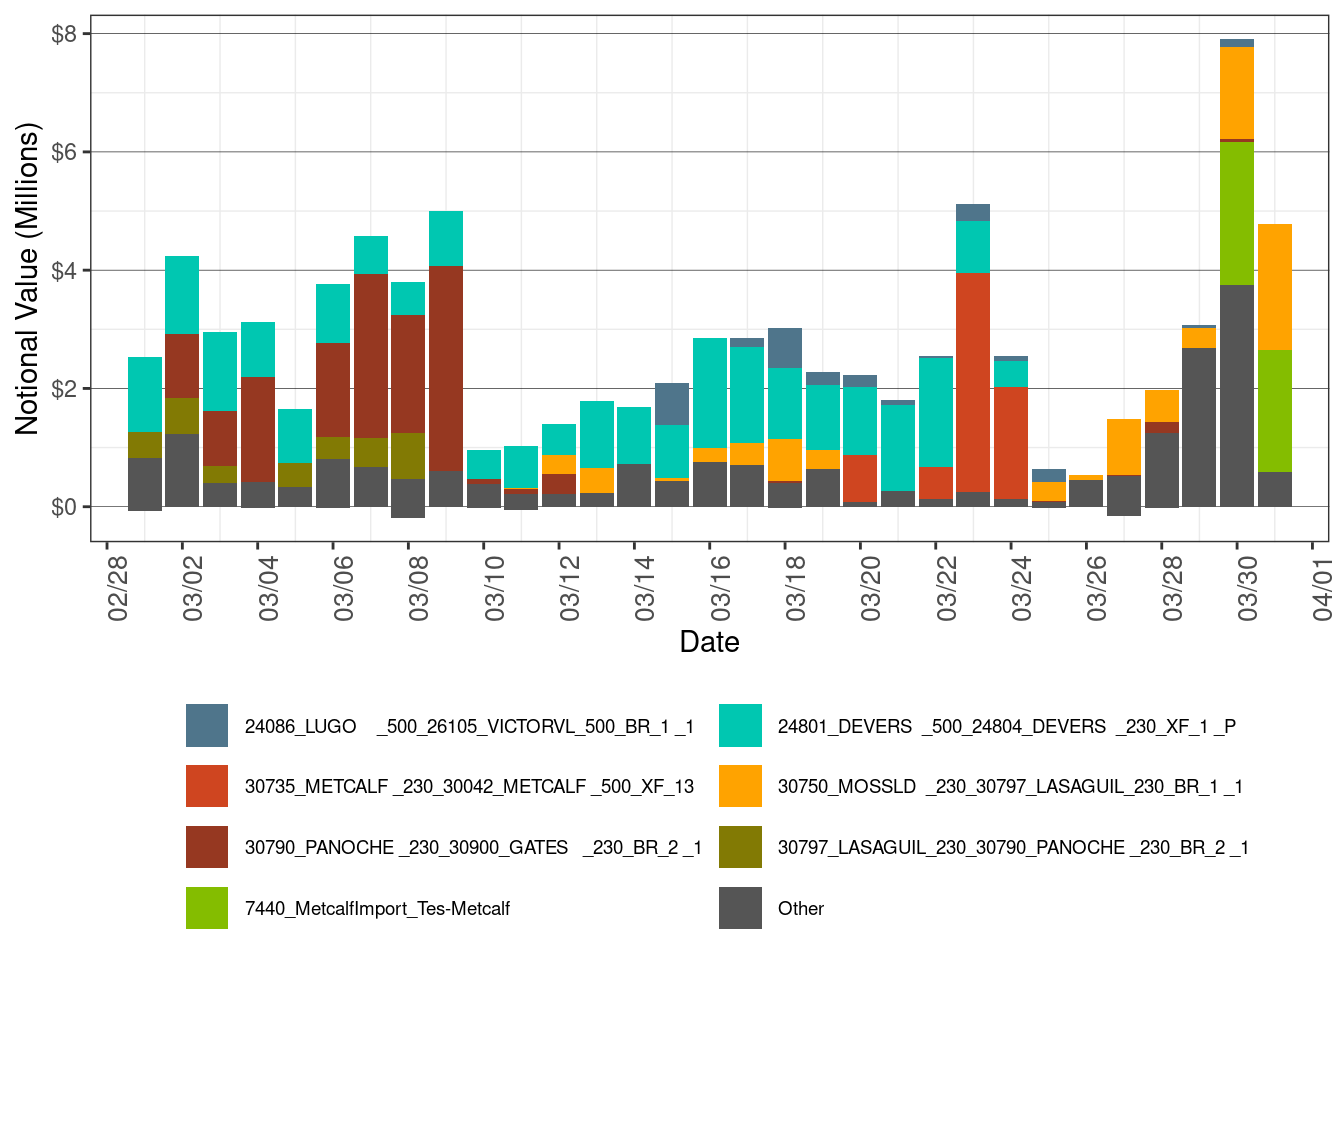
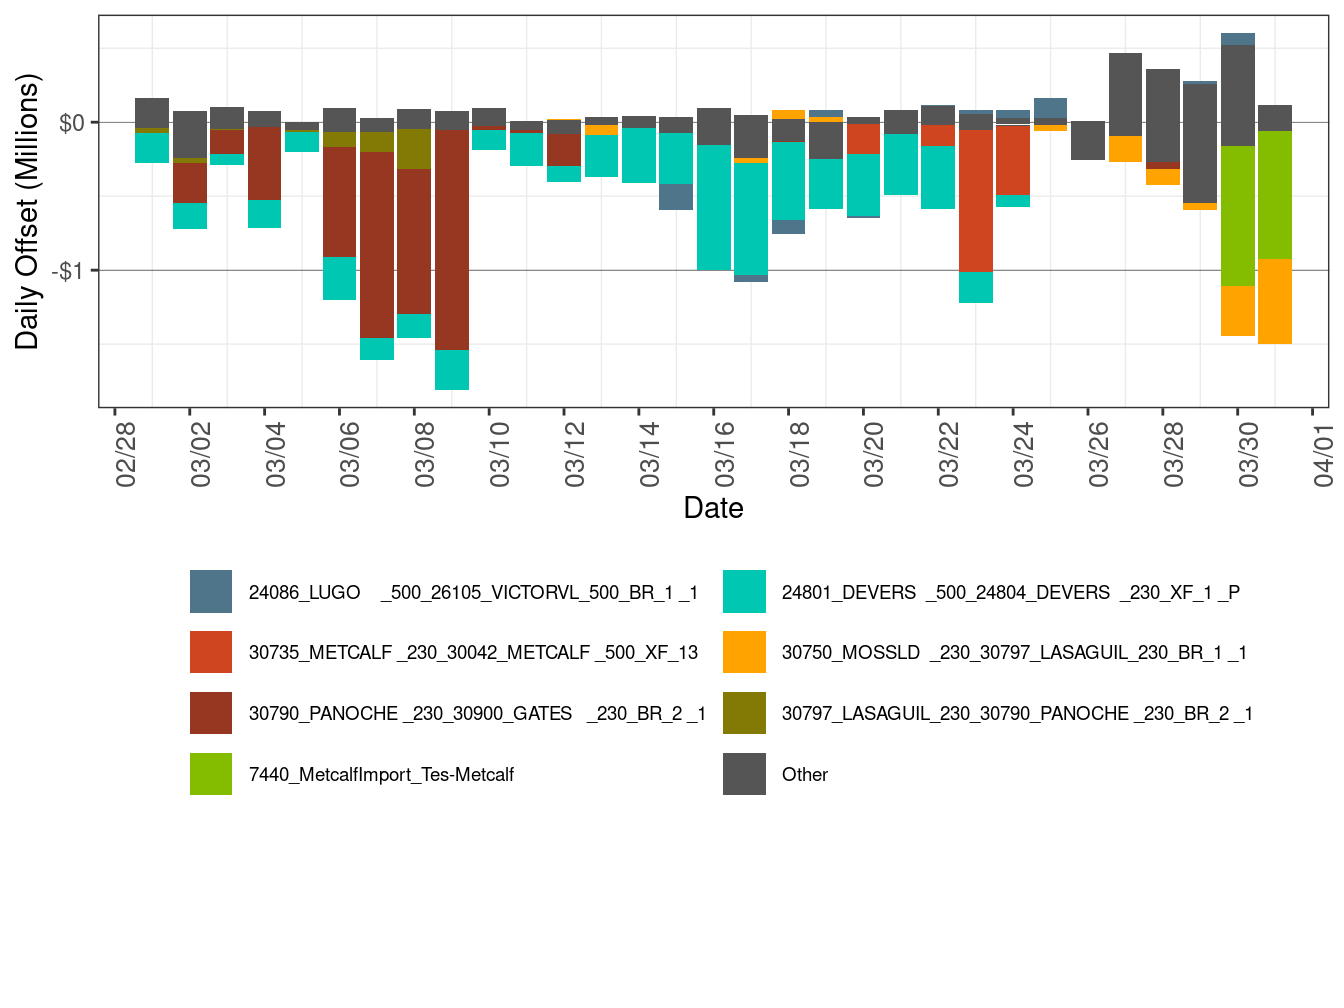
Figure 12 illustrates the daily CRR offset value in the corresponding month for the transmission elements that experienced congestion during the month. CRR offset value is the difference between the revenue collected from the congestion and the CRR notional value. A positive CRR offset value represents surplus and a negative CRR offset value represents shortfall.
As shown below, table 6 shows the percentage of monthly CRR deficit by transmission element and Table 7 shows the percentage of monthly CRR surplus by transmission element.
Figure 12: Daily CRR Offset Value by Transmission Element
| Constraint | Percent |
|---|---|
| 24801_DEVERS _500_24804_DEVERS _230_XF_1 _P | 33.11 |
| 30790_PANOCHE _230_30900_GATES _230_BR_2 _1 | 25.94 |
| Other | 8.80 |
| 7440_MetcalfImport_Tes-Metcalf | 8.42 |
| 30735_METCALF _230_30042_METCALF _500_XF_13 | 8.15 |
| 30750_MOSSLD _230_30797_LASAGUIL_230_BR_1 _1 | 6.02 |
| 30797_LASAGUIL_230_30790_PANOCHE _230_BR_2 _1 | 2.68 |
| 33020_MORAGA _115_32780_CLARMNT _115_BR_2 _1 | 2.43 |
| PALOVRDE_ITC | 2.21 |
| 34150_NEWHALL _115_34154_DAIRYLND_115_BR_1 _1 | 1.13 |
| 36851_NORTHERN_115_36852_SCOTT _115_BR_2 _1 | 1.11 |
| Constraint | Percent |
|---|---|
| Other | 37.03 |
| SYLMAR-AC_BG_NG | 13.25 |
| MALIN500_ISL | 10.13 |
| 24086_LUGO _500_26105_VICTORVL_500_BR_1 _1 | 7.12 |
| 64229_SUMMIT 2_115_32218_DRUM _115_BR_1_1 | 5.66 |
| 33543_AEC_TP2 _115_33540_TESLA _115_BR_1 _1 | 5.33 |
| 30622_EIGHT MI_230_30624_TESLA E _230_BR_1 _1 | 5.10 |
| 34214_LOS BANS_70.0_30765_LOSBANOS_230_XF_3 | 4.84 |
| 32314_SMRTSVLE_60.0_32316_YUBAGOLD_60.0_BR_1 _1 | 4.29 |
| HUMBOLDT_EXP_NG_50 | 3.90 |
| 30056_GATES2 _500_30060_MIDWAY _500_BR_2 _1 | 3.35 |
The main reasons for CRR offset shortfall were
- The transmission element 24801_DEVERS _500_24804_DEVERS _230_XF_1 _P was binding on 24 days of this month, resulting in offset shortfall of $7.01 million.
- The line 30790_PANOCHE _230_30900_GATES _230_BR_2 _1 was binding on 15 days of this month, resulting in offset shortfall of $5.56 million.
The main reasons for CRR offset surplus were
- The nomogram SYLMAR-AC_BG_NG was binding on two days of this month, resulting in offset surplus of $0.44 million.
- The intertie MALIN500_ISL was binding on five days of this month, resulting in offset surplus of $0.34 million.
Table 8 shows the percentage of monthly CRR payment by transmission element.
| Constraint | Percent |
|---|---|
| 24801_DEVERS _500_24804_DEVERS _230_XF_1 _P | 28.21 |
| Other | 16.31 |
| 30790_PANOCHE _230_30900_GATES _230_BR_2 _1 | 13.79 |
| 30750_MOSSLD _230_30797_LASAGUIL_230_BR_1 _1 | 11.03 |
| 30735_METCALF _230_30042_METCALF _500_XF_13 | 8.10 |
| 30797_LASAGUIL_230_30790_PANOCHE _230_BR_2 _1 | 4.38 |
| 24086_LUGO _500_26105_VICTORVL_500_BR_1 _1 | 4.18 |
| 7440_MetcalfImport_Tes-Metcalf | 4.16 |
| OMS OUTAGE JHINDS-MIRAGE_NG | 3.81 |
| OMS_13175630_SUNCREST BK81_NG | 3.71 |
| OMS_13175637_SUNCREST BK80_NG | 2.32 |
Table 9 shows the monthly CRR statistics. The Net Monthly Balancing Surplus calculates as CRR Surplus plus CRR Daily Balancing Account minus total auction revenue. The total auction revenue is the sum of Monthly Auction Revenue and Annual Auction Revenue. The Allocation to Measured demand is calculated as sum of total auction revenue and Net Monthly Balancing Surplus.
Net Monthly Balancing Surplus in March was -$0.43 million. The auction revenues credited to the balancing account for March were $7.96 million. As a result, the balancing account for March had a surplus of approximately $7.53 million, which was allocated to measured demand.
| Description | FEBRUARY -2023 | MARCH -2023 |
|---|---|---|
| CRR Notional Value | $44,945,578 | $85,591,777 |
| CRR Deficit | -$12,126,346 | -$21,444,389 |
| CRR Settlement Rule | -$6,397 | -$43,055 |
| CRR Adjusted Payment | $32,812,835 | $64,104,334 |
| CRR Surplus | $3,193,753 | $3,338,315 |
| Monthly Auction Revenue | $4,337,697 | $3,007,177 |
| Annual Auction Revenue | $4,441,272 | $4,949,802 |
| CRR Daily Balancing Account | $6,913,521 | $4,187,910 |
| Net Monthly Balancing Surplus | $1,328,305 | -$430,754 |
| Allocation to Measured Demand | $10,107,274 | $7,526,225 |