3 Market Performance Metrics
Day-Ahead Prices
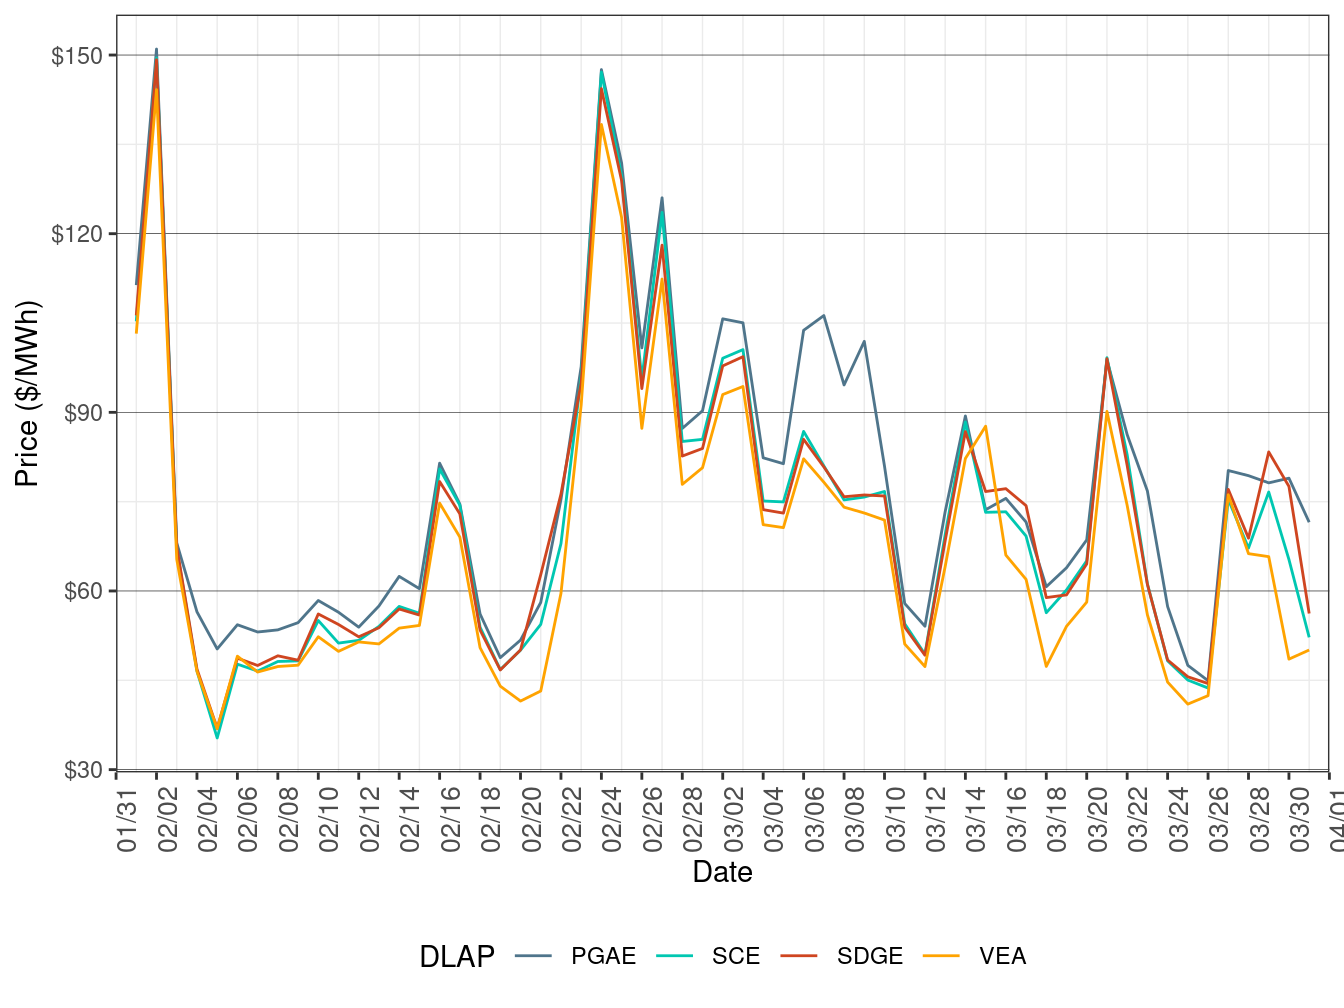
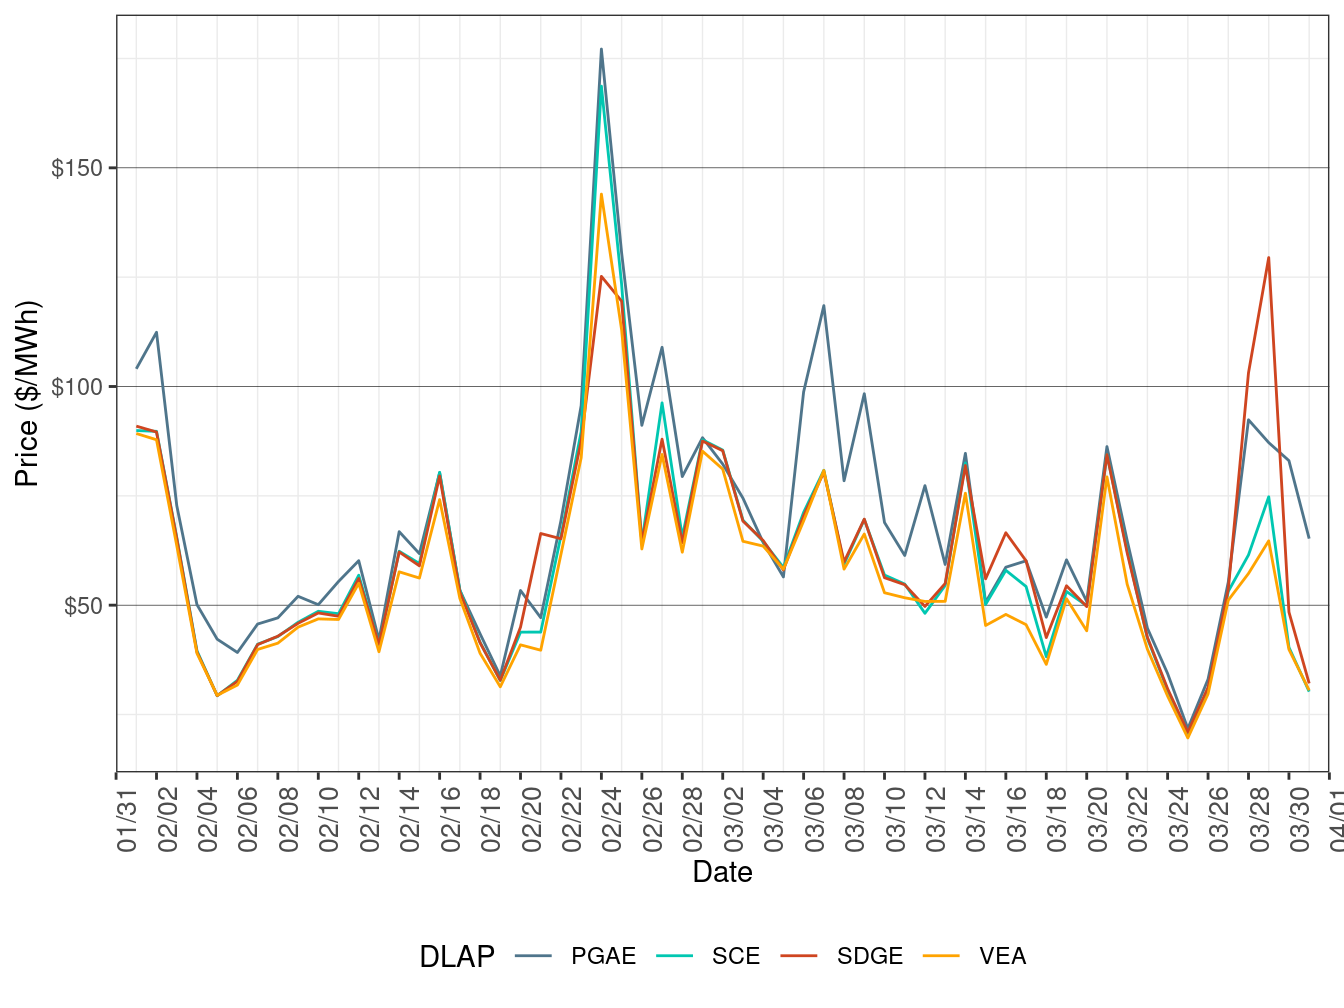
Figure 2 shows the daily simple average prices for each of the four default load-aggregation points (DLAP): PG&E, SCE, SDG&E, and VEA. DLAP prices spiked at the end of February but fell back in March, correlated with the fluctuation in natural gas prices.
TABLE 3 below lists the binding constraints that resulted in relatively high or low DLAP prices on certain dates.
Figure 2: Day-Ahead Simple Average DLAP Prices (All Hours)
| DLAP LMPs Affected | Dates | Transmission Constraint |
|---|---|---|
| PGAE | March 6-9 | PANOCHE-GATES-230kV line |
| All | March 21 | LUGO-VICTORVL-500kV line; DEVERS-DEVERS-500 XFMR |
Real-Time Price
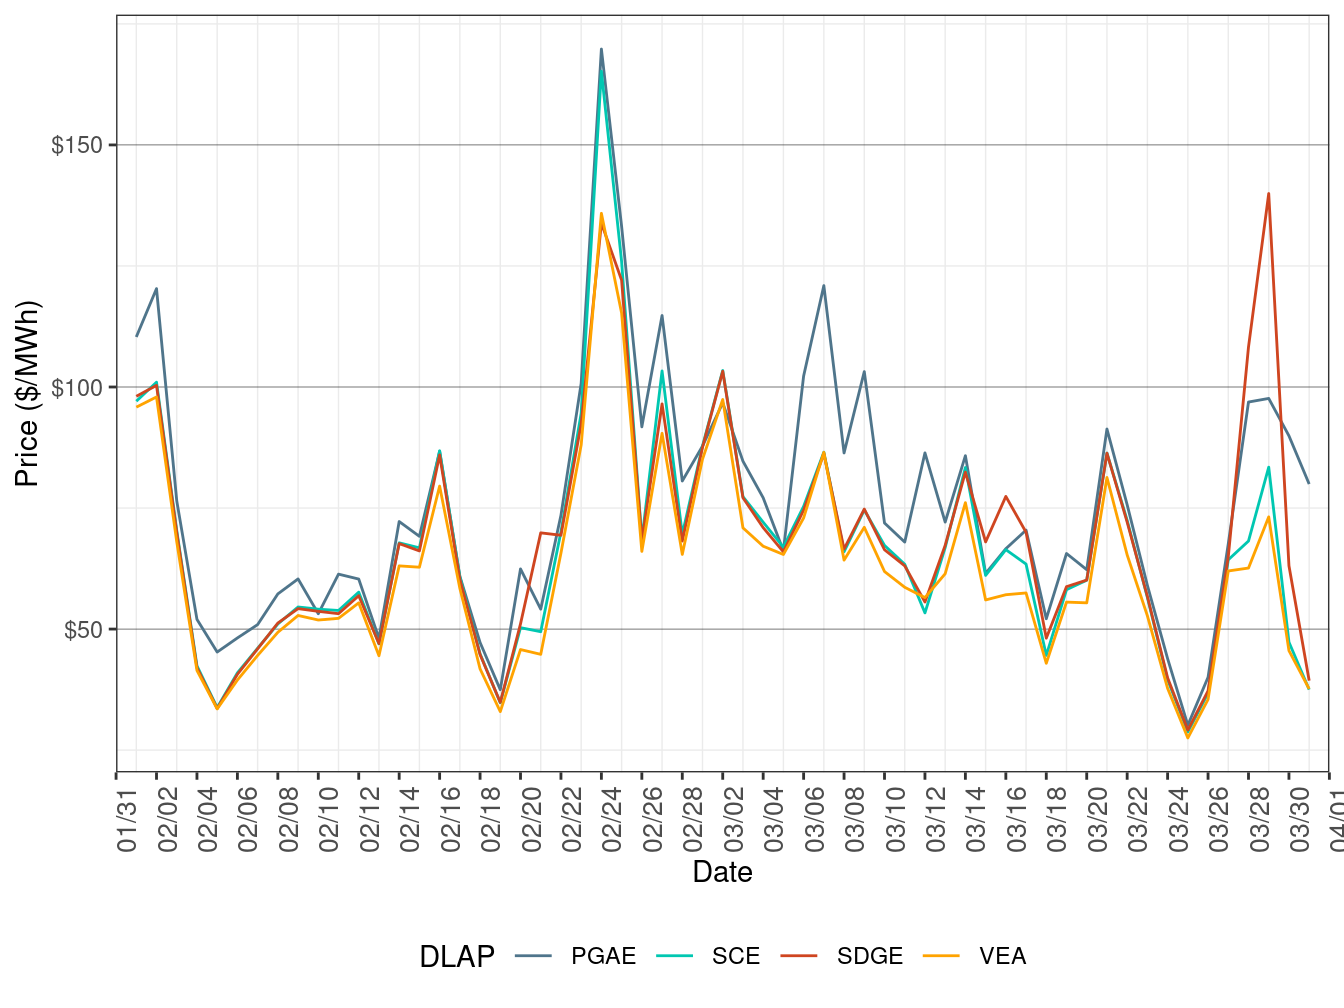
Figure 3 shows daily simple average prices for all four DLAPs (PG&E, SCE, SDG&E, and VEA) for all hours respectively in FMM. DLAP prices spiked at the end of February but fell back in March, correlated with the fluctuation in natural gas prices.
TABLE 4 below lists the binding constraints that resulted in relatively high or low DLAP prices on certain dates.
Figure 3: FMM Simple Average DLAP Prices (All Hours)
| DLAP LMPs Affected | Dates | Transmission Constraint |
|---|---|---|
| PGAE | March 6-9 | PANOCHE-GATES-230kV line; LOSBANOS-GATES1-500kV line |
| SDGE | March 29 | OMS_13175637_SUNCREST-BK80_NG nomogram |
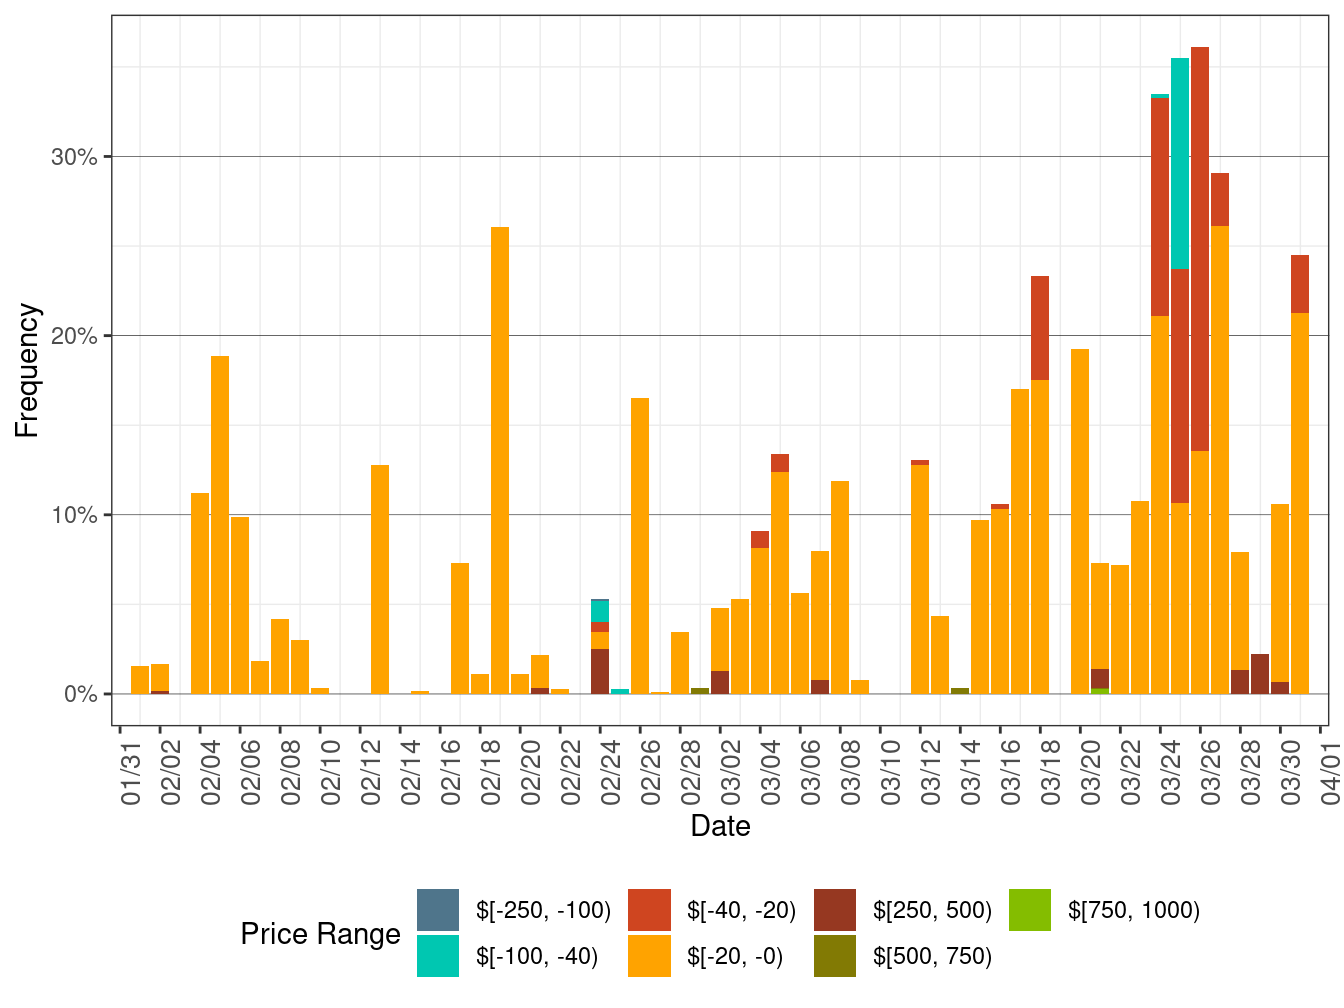
Figure 4 below shows the daily frequency of positive price spikes and negative prices by price range for the DLAPs in the FMM. The cumulative frequency of prices above $250/MWh rose to 0.36 percent in March from 0.11 percent in February, while the cumulative frequency of negative prices jumped to 7.53 percent in March from 2.53 percent in February, correlated with the fall in natural gas prices.
Figure 4: Daily Frequency of FMM DLAP Positive Price Spikes and Negative Prices
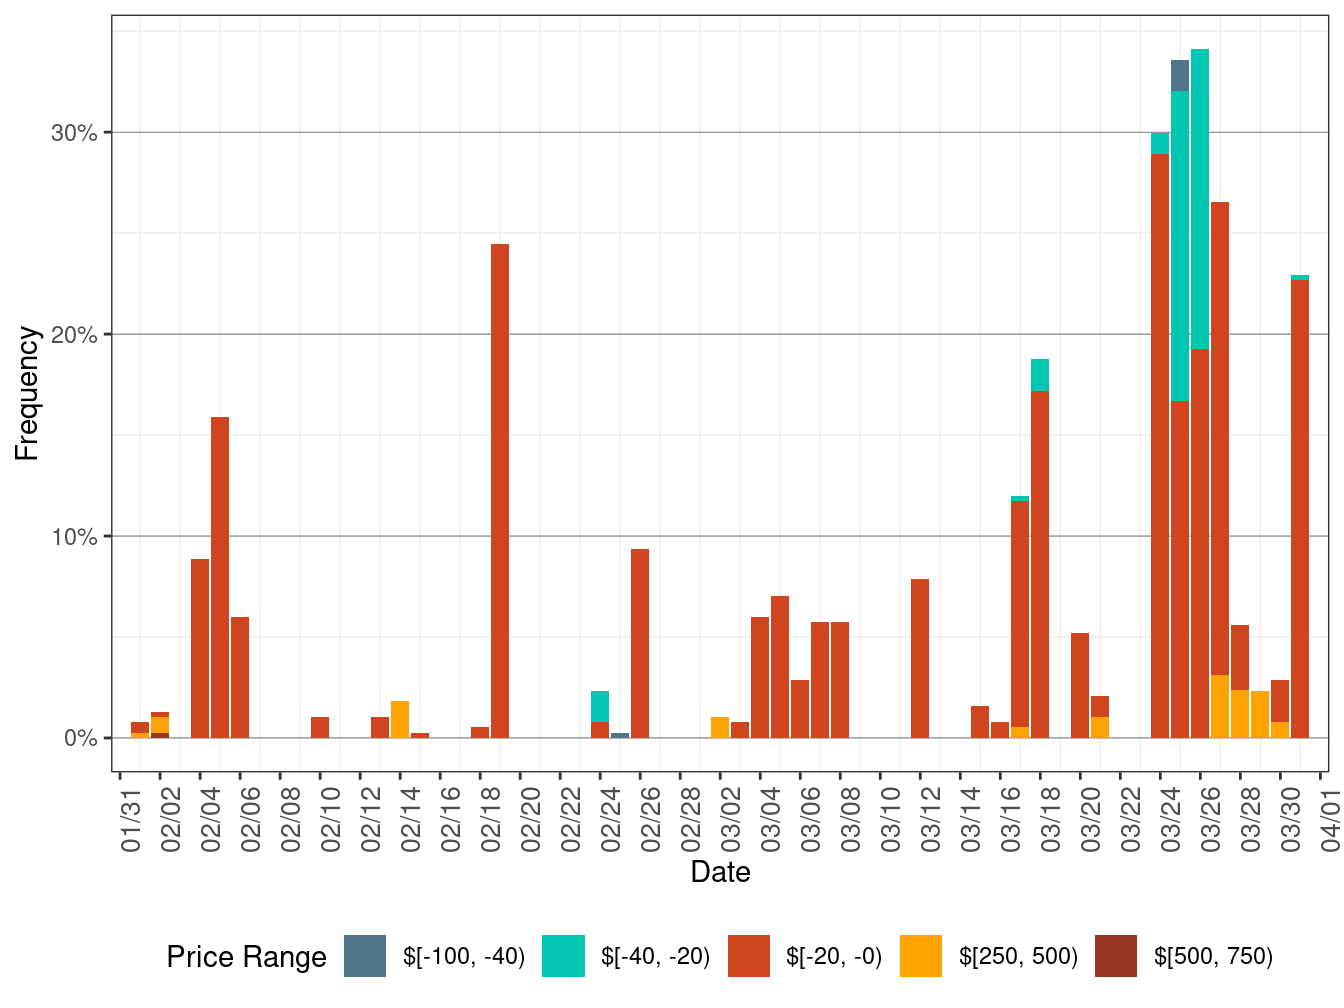
Figure 5 shows daily simple average prices for all the DLAPs (PG&E, SCE, SDG&E, and VEA) for all hours respectively in RTD. DLAP prices spiked at the end of February but fell back in March, correlated with the fluctuation in natural gas prices.
TABLE 5 below lists the binding constraints that resulted in relatively high or low DLAP prices on certain dates.
Figure 5: RTD Simple Average DLAP Prices (All Hours)
| DLAP | Dates | Transmission Constraint |
|---|---|---|
| PGAE | March 6-9 | PANOCHE-GATES-230kV line; LOSBANOS-GATES1-500kV line |
| SDGE | March 29 | OMS_13175637_SUNCREST-BK80_NG nomogram |
Figure 6 below shows the daily frequency of positive price spikes and negative prices by price range for the DLAPs in RTD. The cumulative frequency of prices above $250/MWh rose to 0.27 percent in March from 0.11 percent in February, while the cumulative frequency of negative prices also rose to 11.39 percent in March from 4.50 percent in February, due to falling natural gas prices.
Figure 6: Daily Frequency of RTD DLAP Positive Price Spikes and Negative Prices