Section 5 Congestion Revenue Rights
Congestion revenue rights auction efficiency 1B became in effect on January 1, 2019. It includes key changes related to the congestion revenue rights settlements process:
- Targeted reduction of congestion revenue rights payouts on a constraint by constraint basis.
- Distribute congestion revenues to the extent that CAISO collected the requisite revenue on the constraint over the month. That is, implement a pro-rata funding for CRRs.
- Allow surpluses on one constraint in one hour to offset deficits on the same constraint in another hour over the course of the month.
- Only distribute surpluses to congestion revenue rights if the surplus is collected on a constraint that the congestion revenue right accrued a deficit, and only up to the full target payment value of the congestion revenue right.
- Distribute remaining surplus revenue at the end of the month, which are associated with constraints that collect more surplus over the month than deficits, to measured demand.
Monthly CRR Revenue
Figure 5.1 illustrates the daily CRR notional value in the corresponding month for the various transmission elements that experienced congestion during the month. CRR notional value is calculated as the product of CRR implied flow and constraint shadow price in each hour per constraint and CRR.
Figure 5.1: Daily CRR Notional Value by Transmission Element
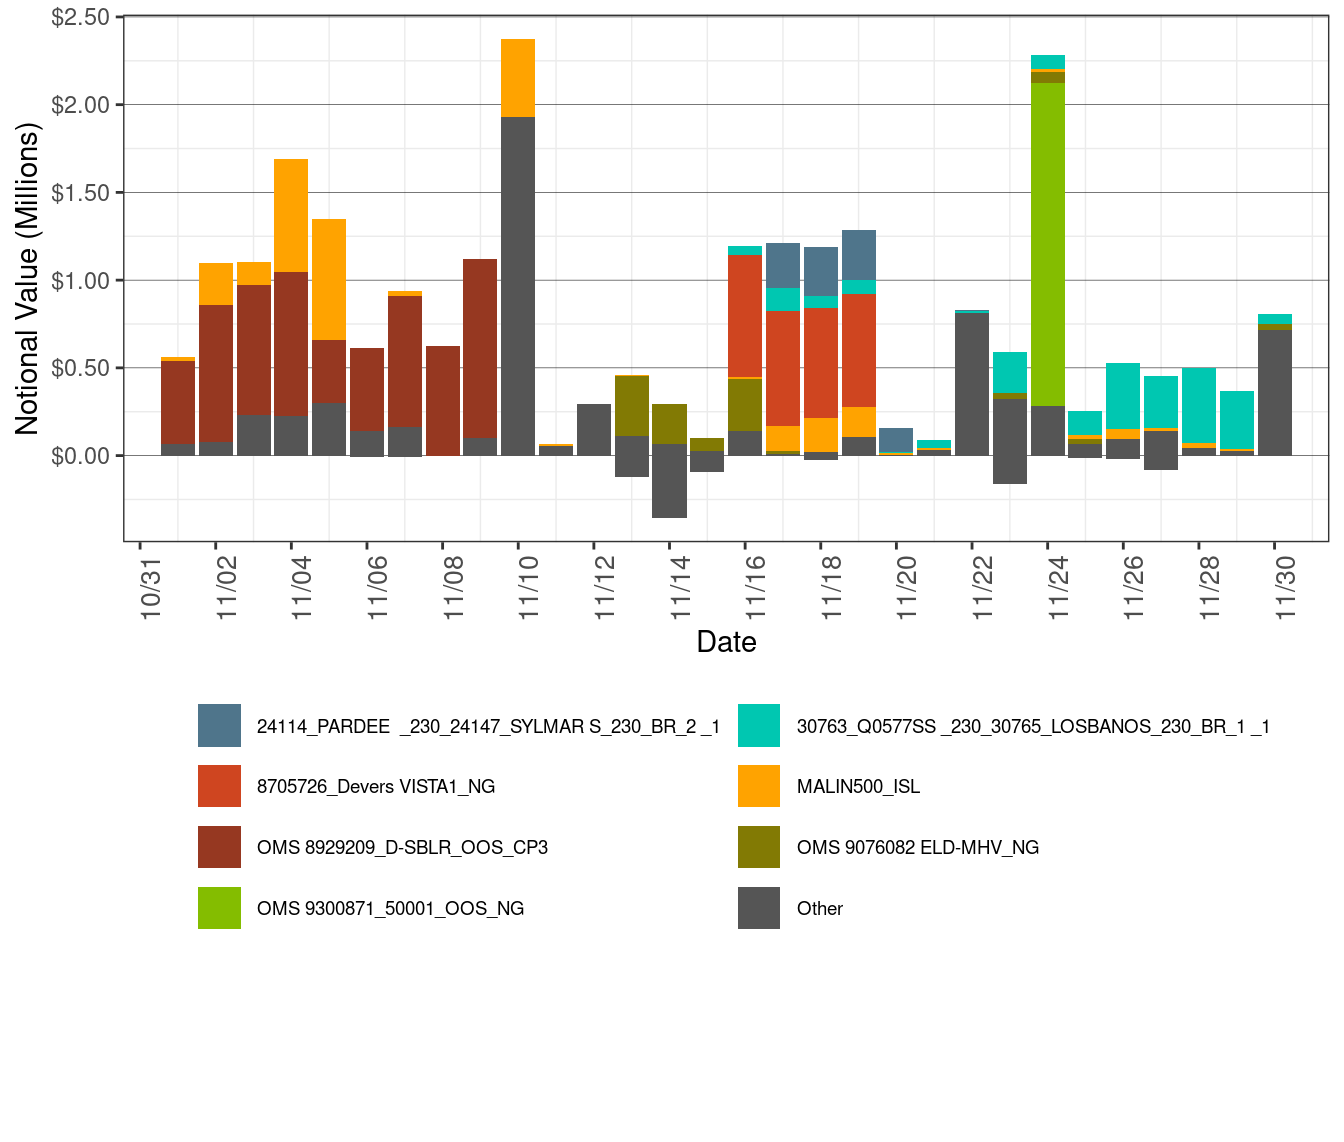
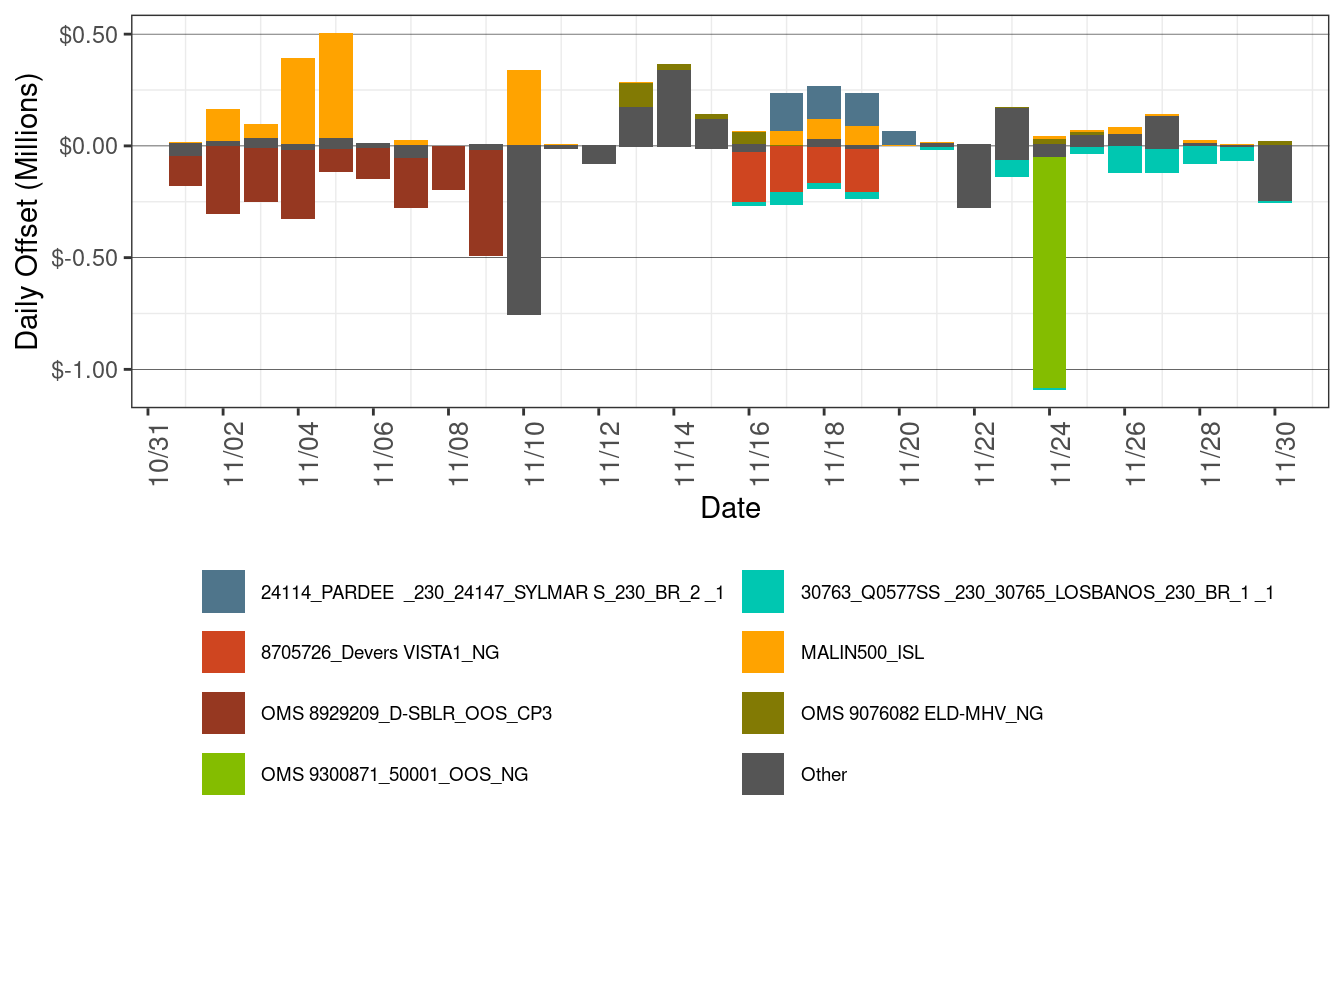
Figure 5.2 illustrates the daily CRR offset value in the corresponding month for the transmission elements that experienced congestion during the month. CRR offset value is the difference between the revenue collected from the congestion CRR. A positive CRR offset value represents surplus and a negative CRR offset value represents shortfall.
The main reasons for CRR offset surplus are
- Malin intertie was binding in 22 days of this month, resulting in offset surplus of $1.77 million. NOB was derated this month for various outages including the outages of Tesla-Tracy 500 kV line, Table Mountain-Vaca Dixon 500kV line, and Malin-Round Mountain 500 kV line.
The main reasons for CRR offset shortfall is
- The nomogram OMS 8929209_D-SBLR_OOS_CP3P was binding in nine days of this month, resulting in offset shortfall of $2.13 million. This nomogram was enforced for the outage of Devers-San Bernardino 220 kV line.
- The nomogram OMS 9300871_50001_OOS_NG was binding in one day of this month, resulting in offset shortfall of $1.04 million. This nomogram was enforced for the outage of East County-Miguel 500 kV line.
Figure 5.2: Daily CRR Offset Value by Transmission Element
Furthermore, Table 5.1 shows the monthly CRR deficit in the month broken out by transmission elements and Table 5.2 shows the monthly CRR surplus in the month broken out by transmission elements.
| Constraint | Percent |
|---|---|
| OMS 8929209_D-SBLR_OOS_CP3 | 36.39 |
| OMS 9300871_50001_OOS_NG | 17.72 |
| 8705726_Devers VISTA1_NG | 13.42 |
| 30763_Q0577SS _230_30765_LOSBANOS_230_BR_1 _1 | 10.86 |
| Other | 5.92 |
| MIGUEL_BKs_MXFLW_NG | 4.58 |
| OMS 9317626_Devers-ElCasco_NG | 3.67 |
| 22192_DOUBLTTP_138_22300_FRIARS _138_BR_1 _1 | 2.99 |
| OMS_9283023_Dervers_Vista1 | 1.96 |
| OMS 8421617_D-VST2_OOS_CP3 | 1.61 |
| 22831_SYCAMORE_138_22124_CHCARITA_138_BR_1 _1 | 0.88 |
| Constraint | Percent |
|---|---|
| MALIN500_ISL | 43.70 |
| 6410_CP10_NG | 25.70 |
| 24114_PARDEE _230_24147_SYLMAR S_230_BR_2 _1 | 14.33 |
| OMS 9076082 ELD-MHV_NG | 7.27 |
| Other | 3.51 |
| NOB_ITC | 2.54 |
| 31336_HPLND JT_60.0_31206_HPLND JT_115_XF_2 | 0.61 |
| 30060_MIDWAY _500_24156_VINCENT _500_BR_1 _3 | 0.60 |
| 24086_LUGO _500_26105_VICTORVL_500_BR_1 _1 | 0.58 |
| 40687_MALIN _500_30005_ROUND MT_500_BR_1 _3 | 0.58 |
| 31227_HGHLNDJ2_115_31950_CORTINA _115_BR_1 _1 | 0.58 |
Table 5.3 shows the monthly CRR payment in the month broken out by transmission elements
| Constraint | Percent |
|---|---|
| OMS 8929209_D-SBLR_OOS_CP3 | 24.17 |
| MALIN500_ISL | 16.67 |
| 8705726_Devers VISTA1_NG | 11.35 |
| 30763_Q0577SS _230_30765_LOSBANOS_230_BR_1 _1 | 10.48 |
| Other | 10.31 |
| OMS 9076082 ELD-MHV_NG | 6.96 |
| 24114_PARDEE _230_24147_SYLMAR S_230_BR_2 _1 | 5.95 |
| OMS 9300871_50001_OOS_NG | 4.97 |
| IPPUTAH_ITC | 3.41 |
| OMS 8421617_D-VST2_OOS_CP3 | 2.94 |
| MIGUEL_BKs_MXFLW_NG | 2.79 |
Table 5.4 shows the monthly CRR payments. Net monthly balancing surplus in November was $0.07 million. The auction revenues credited to the balancing account for November was $7.85 million. As a result, the balancing account for November had a surplus of approximately $7.92 million, which was allocated to measured demand. The Net Monthly Balancing Surplus is calculates as sum of CRR surplus plus CRR daily Balancing account minus total auction revenue. The Total Auction revenue is sum of monthly and annnual auction revenue. The Allocation to Measured demand is calculated as sum of Total Auction revenue plus Net Monthly Balancing Surplus.
| Description | NOVEMBER -2020 | OCTOBER -2020 |
|---|---|---|
| CRR Notional Value | $22,041,802 | $55,639,607 |
| CRR Deficit | $-5,838,517 | $-9,380,055 |
| CRR Settlement Rule | $-4,513 | $-2,881 |
| CRR Adjusted Payment | $16,198,772 | $46,256,671 |
| CRR Surplus | $3,666,056 | $4,102,420 |
| Monthly Auction Revenue | $4,680,247 | $4,510,064 |
| Annual Auction Revenue | $3,168,253 | $3,439,857 |
| CRR Daily Balancing Account | $4,258,385 | $7,990,776 |
| Net Monthly Balancing Surplur | $75,941 | $4,143,275 |
| Allocation to Measured Demand | $7,924,441 | $12,093,196 |