3 Market Performance Metrics
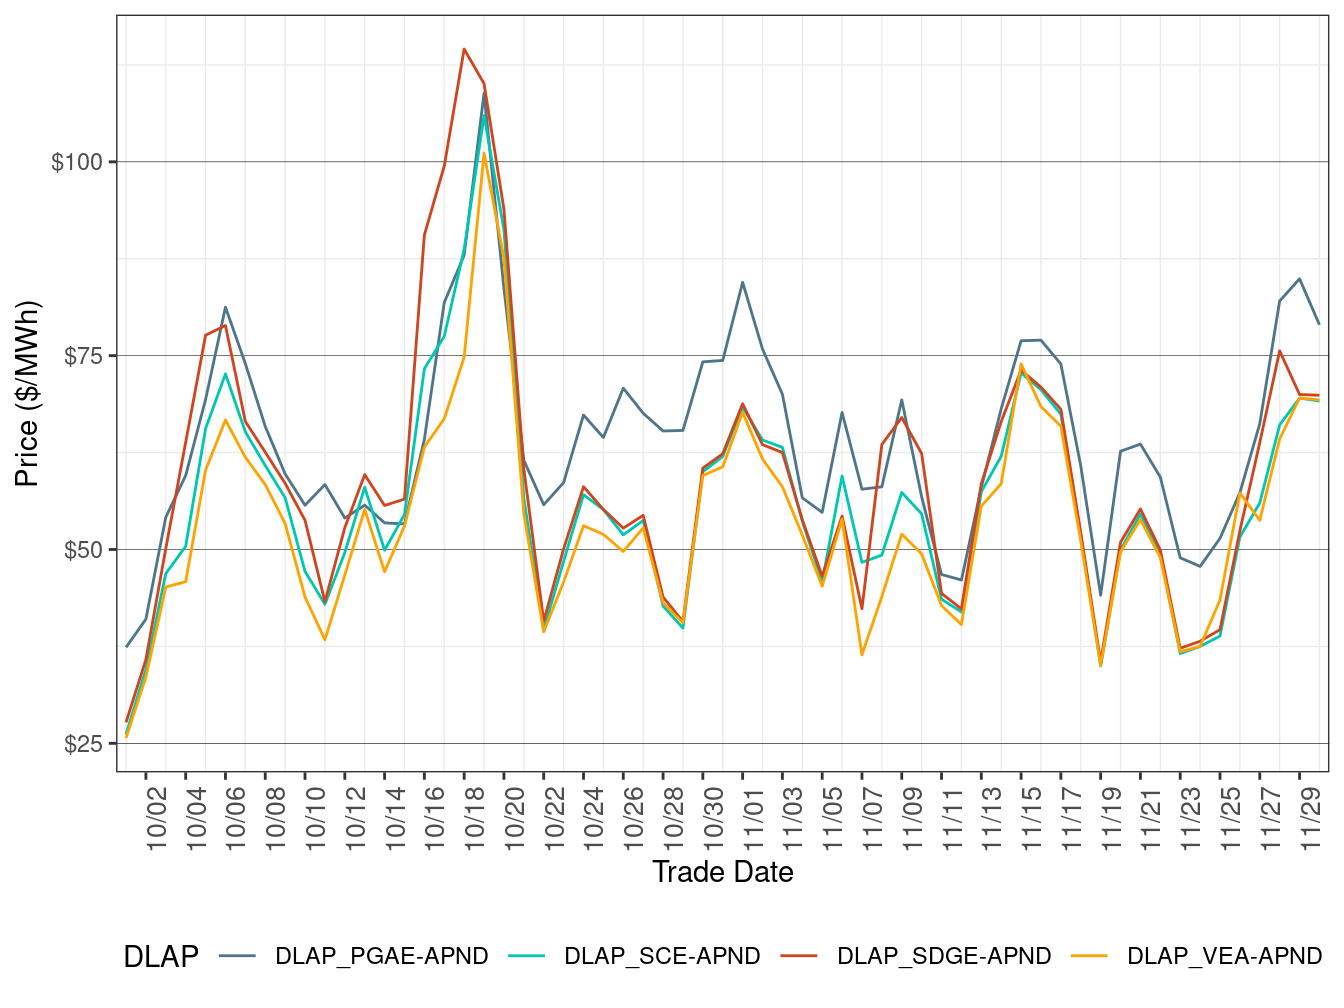
Day-Ahead Prices
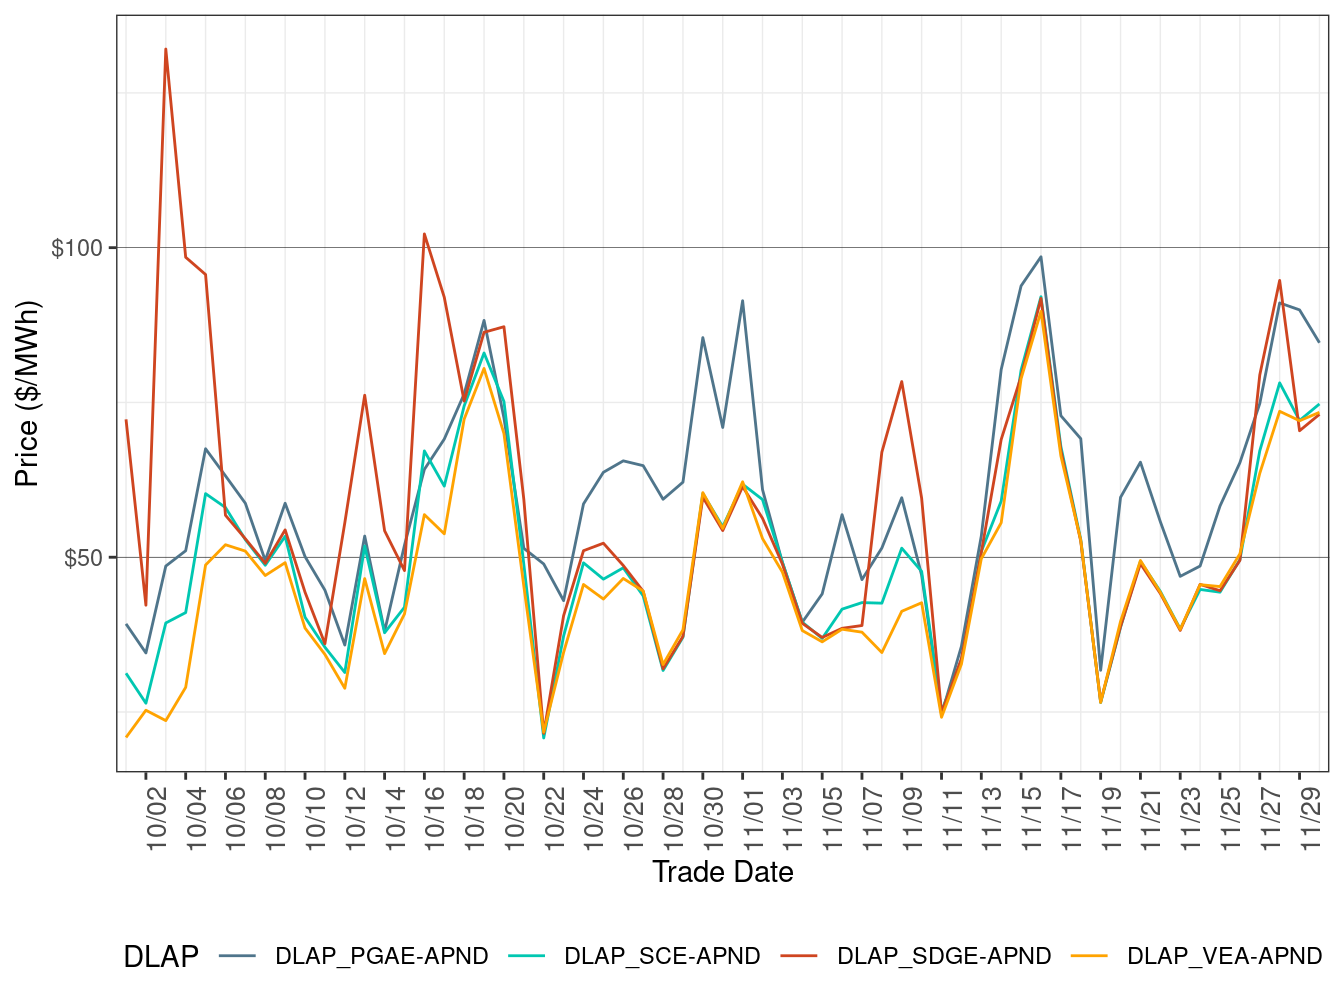
Figure 2 shows the daily simple average prices for all hours in IFM for each of the four default load-aggregation points (DLAP): PG&E, SCE, SDG&E, and VEA.
Day-Ahead DLAP prices on average decreased compared to the previous month except PGAE DLAP prices which increased slightly, correlated with falling natural gas prices. PGAE DLAP prices increased slightly compared to the previous month.
TABLE 3 below lists the binding constraints that resulted in relatively high or low DLAP prices on certain dates.
Figure 2: IFM (Day-Ahead) Simple Average DLAP Prices (All Hours)
| DLAP LMPs Affected | Dates | Transmission Constraint |
|---|---|---|
| All | November 1 | TESLA-LOSBANOS-500kV line |
| All | November 6 | GATES1-MIDWAY-500kV line |
| All | November 8-10 | GATES1-MIDWAY-500kV line; OMS_14369435_Miguel_BK80 nomogram; DEVERS-DEVERS-500 XFMR transmission element |
| All | November 13-17 | MORAGA-MORAGA-115 XFMR transmission element; PANOCHE-GATES-230kV line; OMS_14291578_SUNCREST-BK80_NG nomogram; GATES1-MIDWAY-500kV line; TESLA-LOSBANOS-500kV line; CORTINA-CRTNA M-60 XFMR; MORAGA-CLARMNT-115kV line |
| All | November 20-22 | GATES1-MIDWAY-500kV line; TESLA-LOSBANOS-500kV line |
| All | November 26-30 | TESLA-LOSBANOS-500kV line; SUNCREST-SUNCREST-230 XFMR transmission element |
Real-Time Price
Figure 3 shows daily simple average prices for all four DLAPs (PG&E, SCE, SDG&E, and VEA) for all hours respectively in FMM.
Compared to the previous month FMM DLAP prices on average increased for SCE and VEA and decreased for SDG&E and PG&E. Prices remained volatile.
TABLE 4 below lists the binding constraints that resulted in relatively high or low DLAP prices on certain dates.
Figure 3: FMM Simple Average DLAP Prices (All Hours)
| DLAP LMPs Affected | Dates | Transmission Constraint |
|---|---|---|
| PGAE | November 1 | TESLA-LOSBANOS-500kV line; LOSBANOS-GATES1-500kV line |
| SDGE | November 9-10 | OMS_14369435_Miguel_BK80 nomogram; GATES1-MIDWAY-500kV line |
| All | November 13-18 | MORAGA-MORAGA-115 XFMR transmission element; OMS_14291578_SUNCREST-BK80_NG nomogram; TESLA-LOSBANOS-500kV line; GATES1-MIDWAY-500kV line; OMS_14476942_IVALLY_NG nomogram |
| PGAE | November 20-22 | TESLA-LOSBANOS-500kV line |
| All | November 26-30 | TESLA-LOSBANOS-500kV line; OMS 14384679_50001_OOS_NG nomogram; SUNCREST-SUNCREST-230 XFMR transmission element |
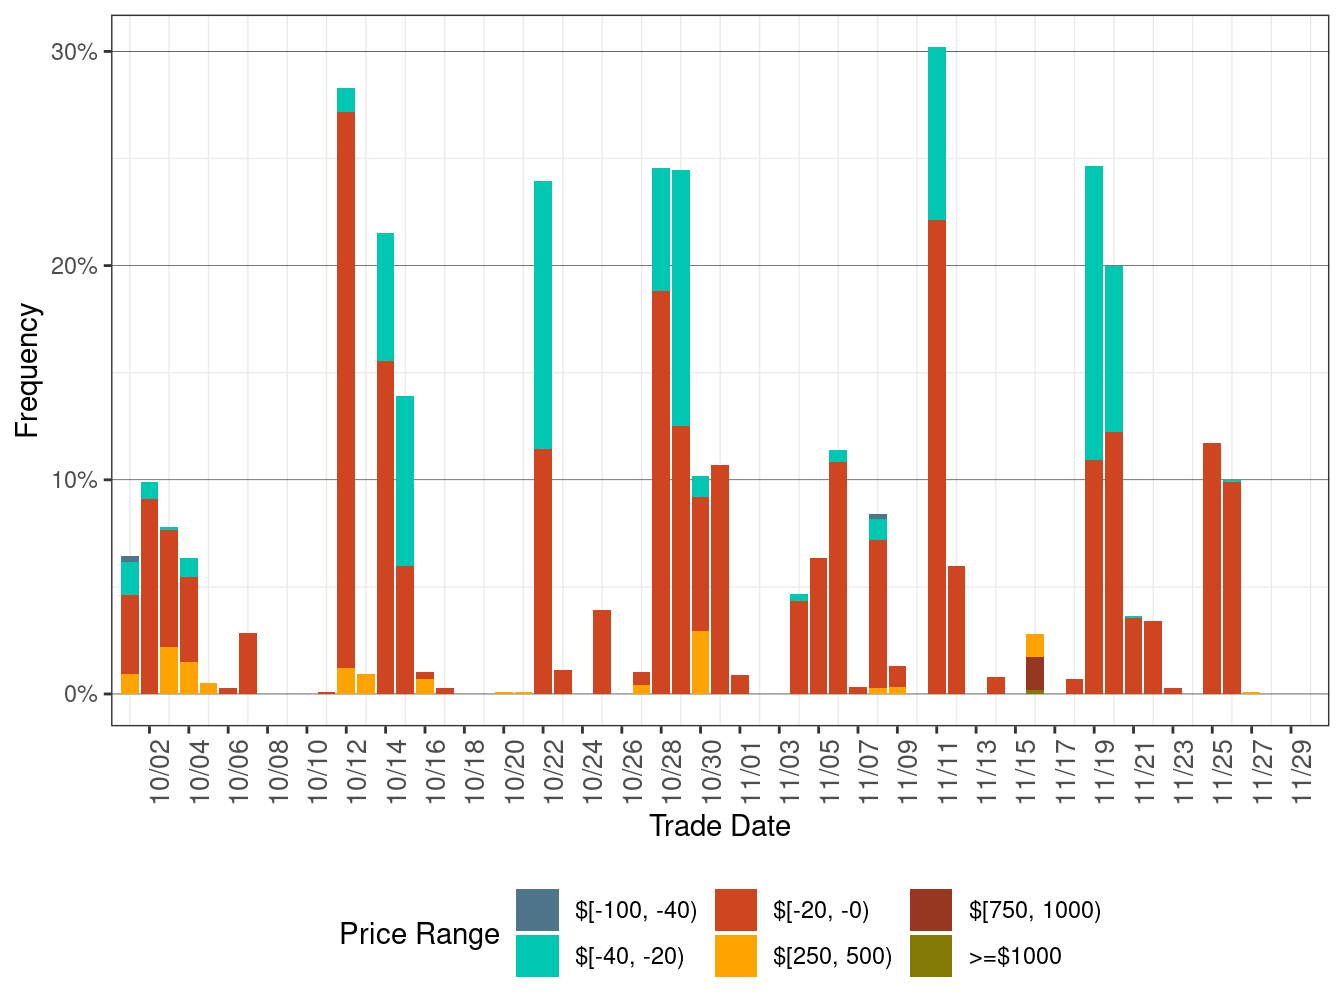
Figure 4 below shows the daily frequency of positive price spikes and negative prices by price range for the DLAPs in the FMM.
The cumulative frequency of prices in FMM above $250/MWh decreased to 0.03 percent in November from 0.55 percent in the previous month, while the cumulative frequency of negative prices decreased to 4.21 percent in November from 4.92 percent in the previous month.
Figure 4: Daily Frequency of FMM DLAP Positive Price Spikes and Negative Prices
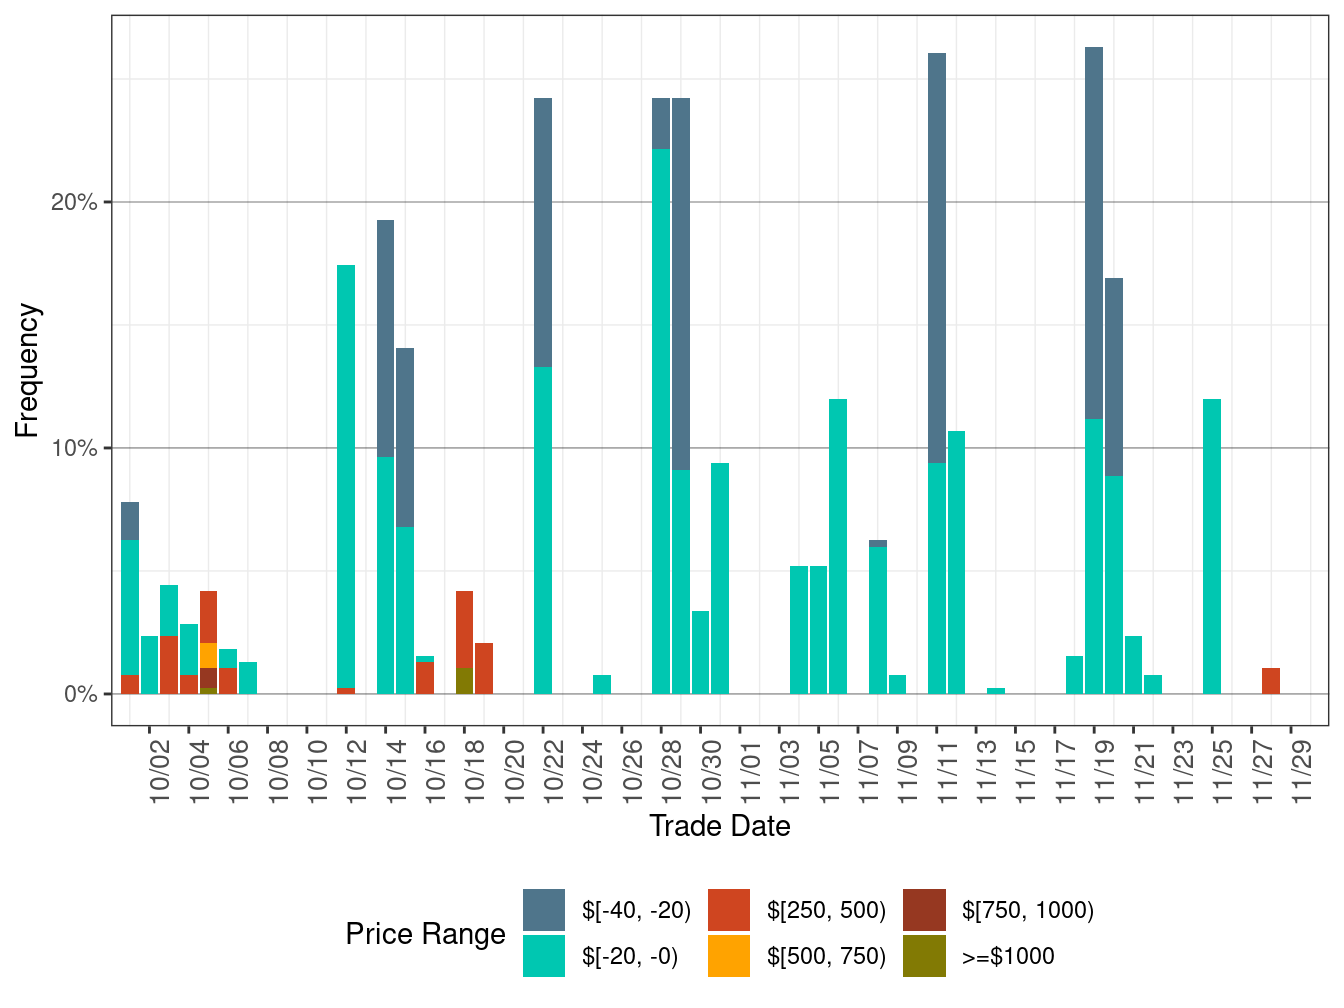
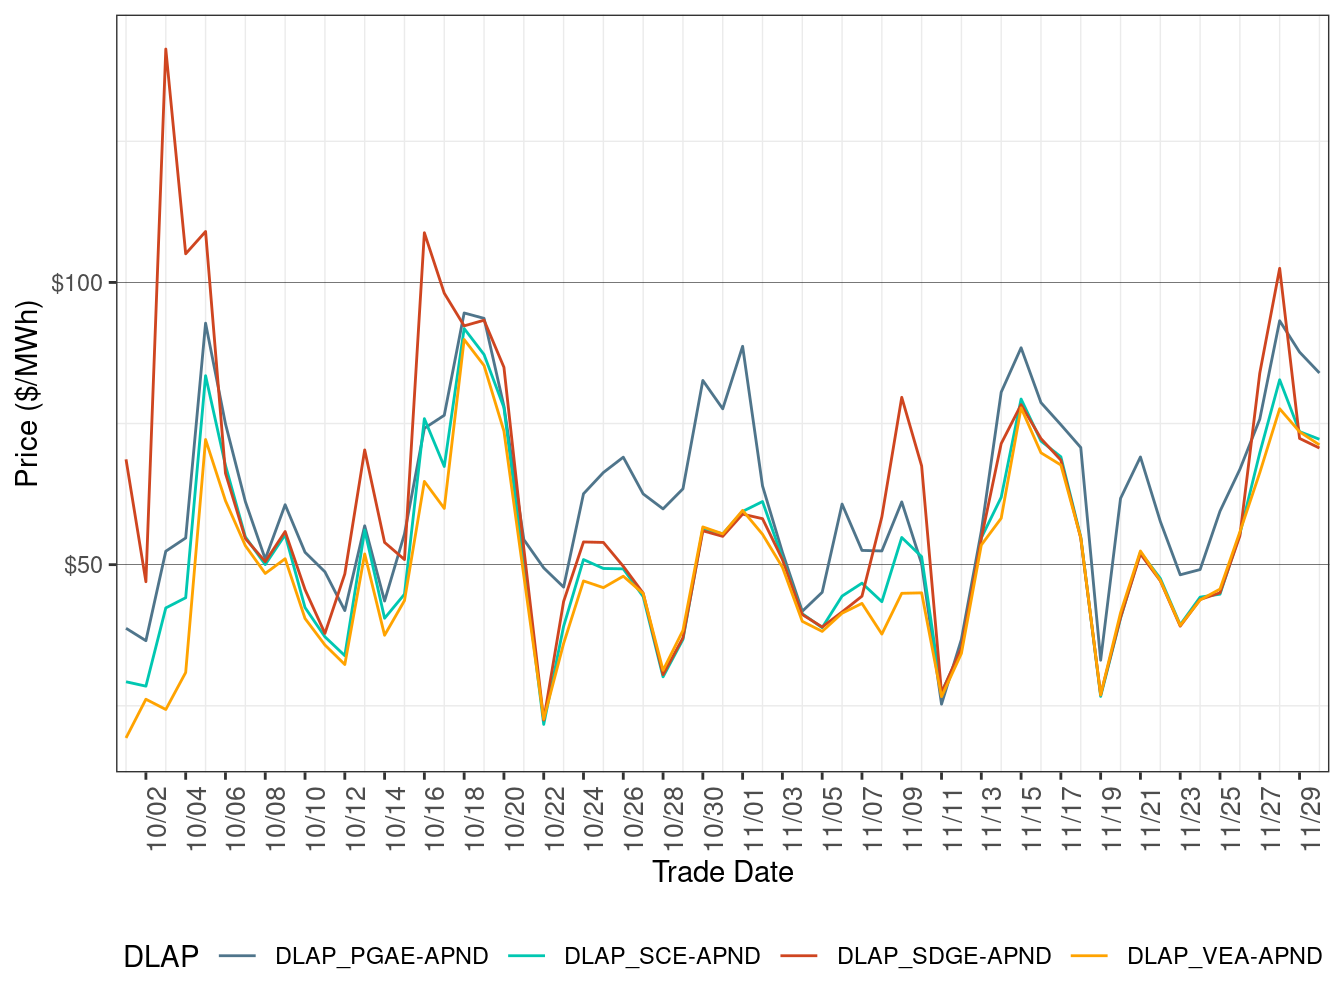
Figure 5 shows daily simple average prices for all the DLAPs (PG&E, SCE, SDG&E, and VEA) for all hours respectively in RTD.
Compared to the previous month RTD DLAP prices on average increased for PG&E, SCE and VEA and decreased for SDG&E.
TABLE 5 below lists the binding constraints that resulted in relatively high or low DLAP prices on certain dates.
Figure 5: RTD Simple Average DLAP Prices (All Hours)
| DLAP LMPs Affected | Dates | Transmission Constraint |
|---|---|---|
| PGAE | November 1 | TESLA-LOSBANOS-500kV line; LOSBANOS-GATES1-500kV line |
| SDGE | November 8-10 | OMS_14369435_Miguel_BK80 nomogram; GATES1-MIDWAY-500kV line |
| All | November 14-17 | OMS_14291578_SUNCREST-BK80_NG nomogram; TESLA-LOSBANOS-500kV line; GATES1-MIDWAY-500kV line; OMS_14476942_IVALLY_NG nomogram |
| PGAE | November 20-21 | TESLA-LOSBANOS-500kV line |
| All | November 27-30 | OMS 14384679_50001_OOS_NG nomogram; SUNCREST-SUNCREST-230 XFMR transmission element; TESLA-LOSBANOS-500kV line; GATES1-MIDWAY-500kV line |
Figure 6 below shows the daily frequency of positive price spikes and negative prices by price range for the DLAPs in RTD.
The cumulative frequency of prices in RTD above $250/MWh decreased to 0.12 percent in November from 0.37 percent in the previous month, while the cumulative frequency of negative prices decreased to 4.80 percent in November from 6.09 percent in the previous month, correlated with the decrease in renewable generation curtailment.
Figure 6: Daily Frequency of RTD DLAP Positive Price Spikes and Negative Prices