5 Congestion Revenue Rights
Congestion revenue rights auction efficiency 1B became effective on January 1, 2019. It includes key changes related to the congestion revenue rights settlements process:
- Targeted reduction of congestion revenue rights payouts on a constraint by constraint basis.
- Distribute congestion revenues to the extent that CAISO collected the requisite revenue on the constraint over the month. That is, implement a pro-rata funding for CRRs.
- Allow surpluses on one constraint in one hour to offset deficits on the same constraint in another hour over the course of the month.
- Only distribute surpluses to congestion revenue rights if the surplus is collected on a constraint that the congestion revenue right accrued a deficit, and only up to the full target payment value of the congestion revenue right.
- Distribute remaining surplus revenue at the end of the month, which are associated with constraints that collect more surplus over the month than deficits, to measured demand.
Monthly CRR Revenue
Figure 11 illustrates the daily CRR notional value in the corresponding month for the various transmission elements that experienced congestion during the month. CRR notional value is calculated as the product of CRR implied flow (MW) and constraint shadow price ($/MWh) in each hour per constraint and CRR.
Figure 11: Daily CRR Notional Value by Transmission Element
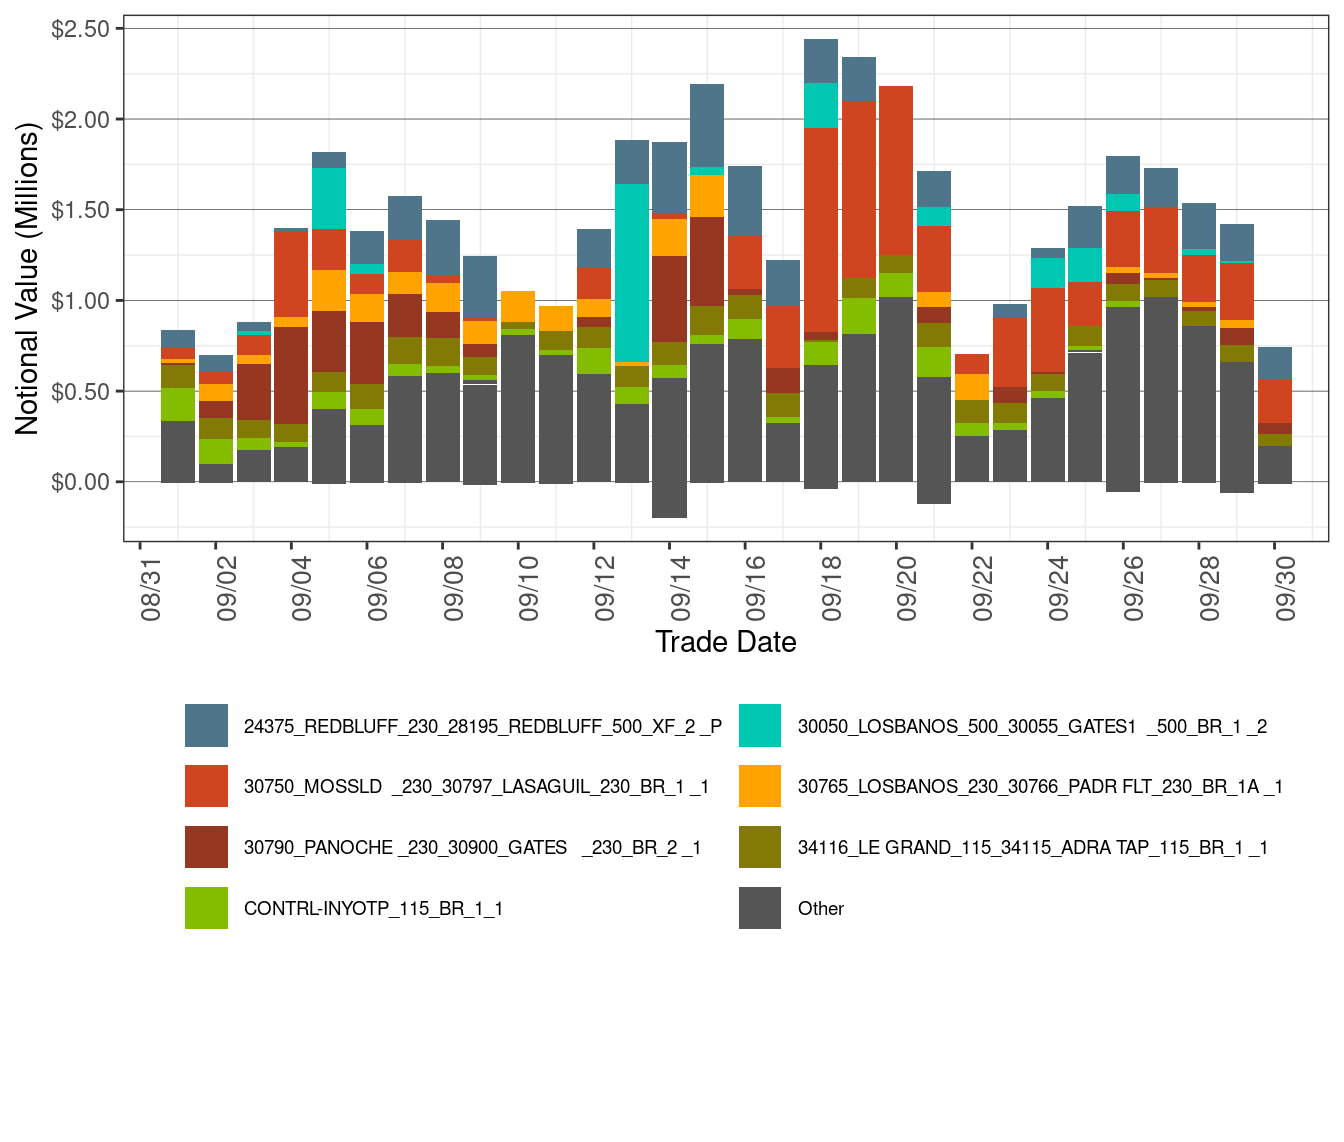
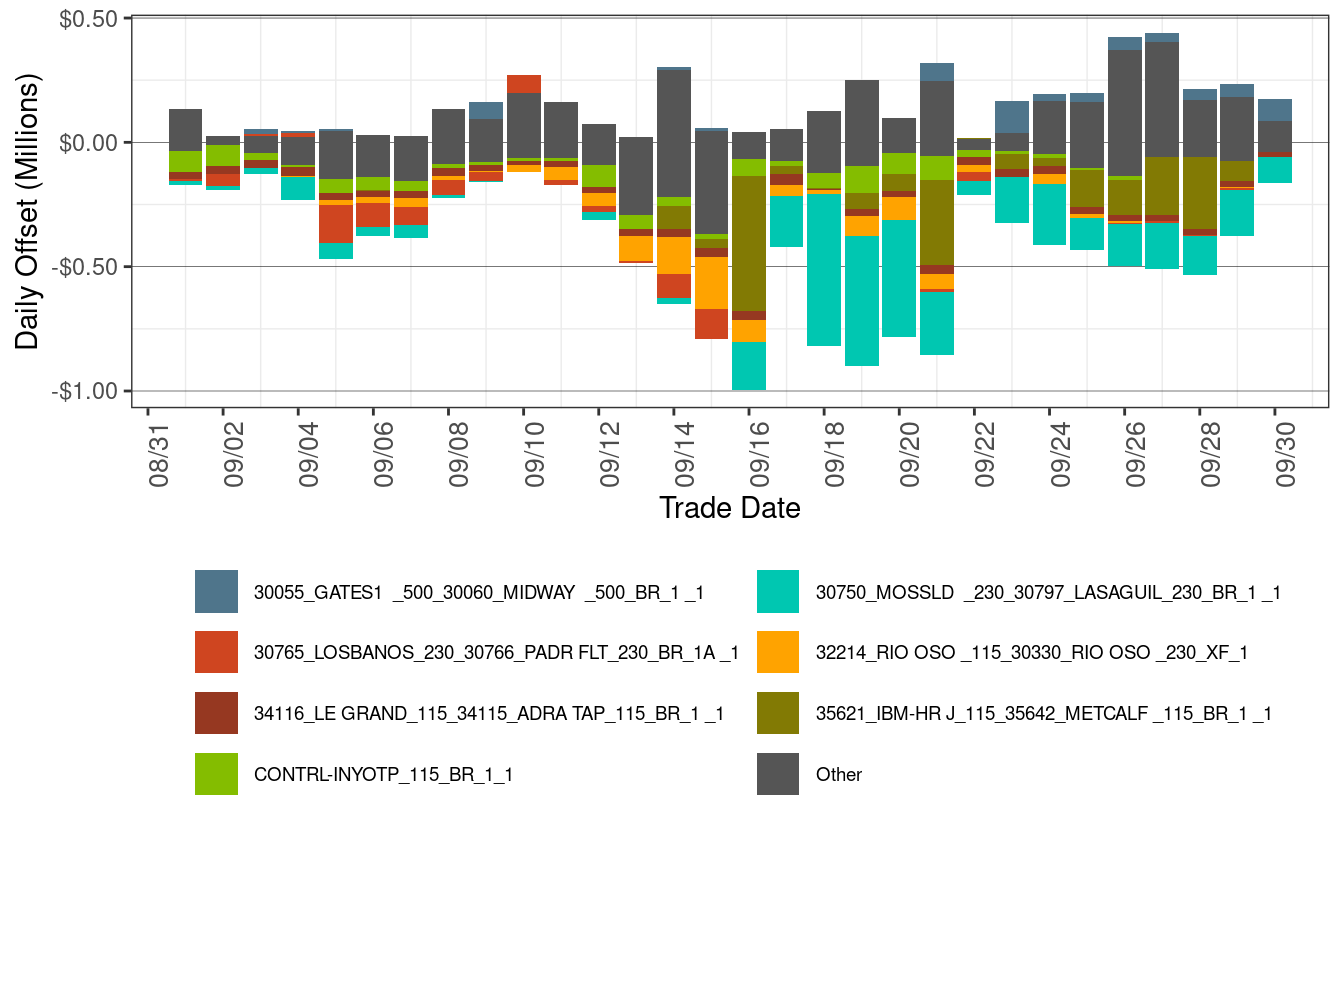
Figure 12 illustrates the daily CRR offset value in the corresponding month for the transmission elements that experienced congestion during the month. CRR offset value is the difference between the revenue collected from the congestion and the CRR notional value. A positive CRR offset value represents surplus and a negative CRR offset value represents shortfall.
As shown below, table 6 shows the percentage of monthly CRR deficit by transmission element and Table 7 shows the percentage of monthly CRR surplus by transmission element.
Figure 12: Daily CRR Offset Value by Transmission Element
| Constraint | Percent |
|---|---|
| 30750_MOSSLD _230_30797_LASAGUIL_230_BR_1 _1 | 31.50 |
| 35621_IBM-HR J_115_35642_METCALF _115_BR_1 _1 | 16.92 |
| Other | 10.66 |
| 32214_RIO OSO _115_30330_RIO OSO _230_XF_1 | 9.18 |
| CONTRL-INYOTP_115_BR_1_1 | 8.82 |
| 34116_LE GRAND_115_34115_ADRA TAP_115_BR_1 _1 | 6.65 |
| 30765_LOSBANOS_230_30766_PADR FLT_230_BR_1A _1 | 5.90 |
| 30790_PANOCHE _230_30900_GATES _230_BR_2 _1 | 3.63 |
| 24375_REDBLUFF_230_28195_REDBLUFF_500_XF_2 _P | 2.97 |
| 34115_ADRA TAP_115_34154_DAIRYLND_115_BR_1 _1 | 2.02 |
| 30050_LOSBANOS_500_30055_GATES1 _500_BR_1 _2 | 1.74 |
| Constraint | Percent |
|---|---|
| Other | 20.09 |
| 30055_GATES1 _500_30060_MIDWAY _500_BR_1 _1 | 15.59 |
| MALIN500_ISL | 15.34 |
| NOB_ITC | 13.37 |
| 6410_CP1_NG | 8.59 |
| 31486_CARIBOU 115_30255_CARBOU M 1.0_XF_11 | 6.81 |
| 30050_LOSBANOS_500_30055_GATES1 _500_BR_1 _2 | 6.23 |
| 32214_RIO OSO _115_32225_BRNSWKT1_115_BR_1 _1 | 5.91 |
| 30580_ALTM MDW_230_30625_TESLA D _230_BR_1 _1 | 3.81 |
| 33315_RAVENSWD_115_38028_PLO ALTO_115_BR_1 _1 | 2.63 |
| 30040_TESLA _500_30050_LOSBANOS_500_BR_1 _1 | 1.63 |
The main reasons for CRR offset shortfall were
- The line 30750_MOSSLD _230_30797_LASAGUIL_230_BR_1 _1 was binding on 27 days of this month, resulting in offset shortfall of $4.04 million.
- The line 35621_IBM-HR J_115_35642_METCALF _115_BR_1 _1 was binding on 18 days of this month, resulting in offset shortfall of $2.16 million.
The main reasons for CRR offset surplus were
- The nomogram 30055_GATES1 _500_30060_MIDWAY _500_BR_1 _1 line was binding on 18 days of this month, resulting in offset surplus of $0.66 million.
- The intertie MALIN500_ISL was binding on 5 days of this month, resulting in offset surplus of $0.65 million.
- The intertie NOB_ITC was binding on 5 days of this month, resulting in offset surplus of $0.57 million.
Table 8 shows the percentage of monthly CRR payment by transmission element.
| Constraint | Percent |
|---|---|
| Other | 27.75 |
| 24375_REDBLUFF_230_28195_REDBLUFF_500_XF_2 _P | 16.66 |
| 30750_MOSSLD _230_30797_LASAGUIL_230_BR_1 _1 | 13.65 |
| 30790_PANOCHE _230_30900_GATES _230_BR_2 _1 | 10.75 |
| 34116_LE GRAND_115_34115_ADRA TAP_115_BR_1 _1 | 7.77 |
| 30050_LOSBANOS_500_30055_GATES1 _500_BR_1 _2 | 6.74 |
| 30765_LOSBANOS_230_30766_PADR FLT_230_BR_1A _1 | 4.78 |
| CONTRL-INYOTP_115_BR_1_1 | 3.27 |
| 6410_CP1_NG | 3.02 |
| 7430_KTTLM_GATES_70_1 | 2.82 |
| 31486_CARIBOU 115_30255_CARBOU M 1.0_XF_11 | 2.79 |
Table 9 shows the monthly CRR statistics. The Net Monthly Balancing Surplus calculates as CRR Surplus plus CRR Daily Balancing Account minus total auction revenue. The total auction revenue is the sum of Monthly Auction Revenue and Annual Auction Revenue. The Allocation to Measured demand is calculated as sum of total auction revenue and Net Monthly Balancing Surplus.
Net Monthly Balancing Surplus in September was -$7.56 million. The auction revenues credited to the balancing account for September were $19.86 million. As a result, the balancing account had a surplus of approximately $12.31 million compared to $16.34 million in the previous month, which was allocated to measured demand.
| Description | AUGUST -2023 | SEPTEMBER-2023 |
|---|---|---|
| CRR Notional Value | $70,166,586 | $43,395,556 |
| CRR Deficit | -$23,544,781 | -$12,811,496 |
| CRR Settlement Rule | -$15,375 | -$19,635 |
| CRR Adjusted Payment | $46,606,430 | $30,564,425 |
| CRR Surplus | $10,394,485 | $4,242,097 |
| Monthly Auction Revenue | $4,276,425 | $5,265,782 |
| Annual Auction Revenue | $5,099,568 | $4,801,303 |
| CRR Daily Balancing Account | $5,949,973 | $8,064,932 |
| Net Monthly Balancing Surplus | $6,968,465 | $2,239,945 |
| Allocation to Measured Demand | $16,344,458 | $12,307,029 |