3 Market Performance Metrics
Day-Ahead Prices
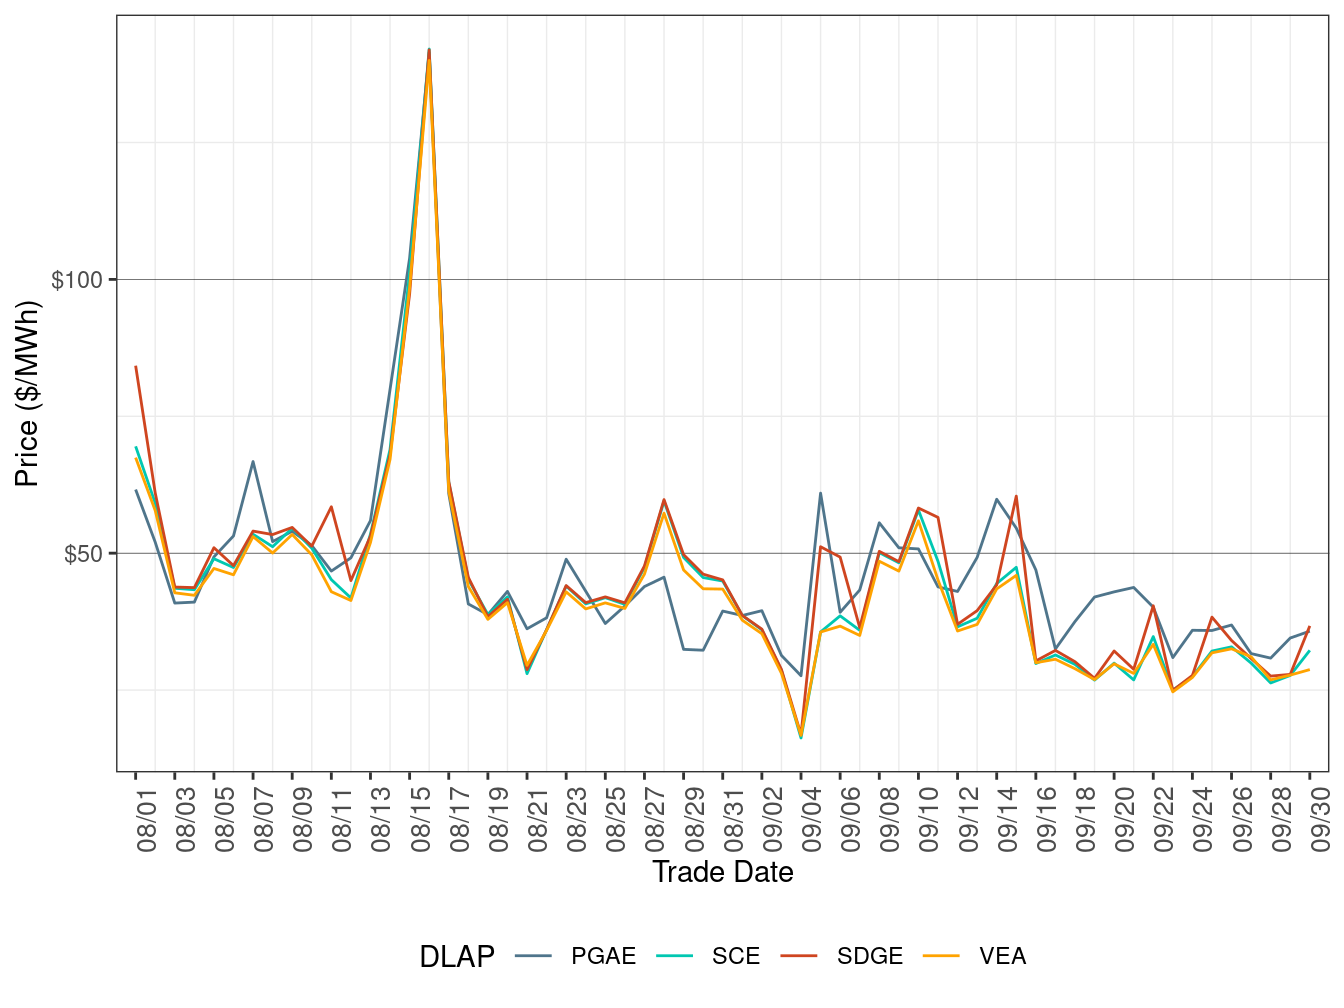
Figure 2 shows the daily simple average prices for all hours in IFM for each of the four default load-aggregation points (DLAP): PG&E, SCE, SDG&E, and VEA.
Day-Ahead DLAP prices on average decreased compared to the previous month and were more stable, correlated with falling natural gas prices.
TABLE 3 below lists the binding constraints that resulted in relatively high or low DLAP prices on certain dates.
Figure 2: IFM (Day-Ahead) Simple Average DLAP Prices (All Hours)
| DLAP LMPs Affected | Dates | Transmission Constraint |
|---|---|---|
| All | September 8 | 6410_CP1_NG nomogram; PANOCHE-GATES-230kV line |
| All | September 11 | 6410_CP1_NG nomogram |
| All | September 15 | PANOCHE-GATES-230kV line |
| All | September 22 | OMS_13982569_13810A_NG nomogram |
| All | September 25 | 6410_CP1_NG nomogram; LOSBANOS-GATES1-500kV line |
Real-Time Price
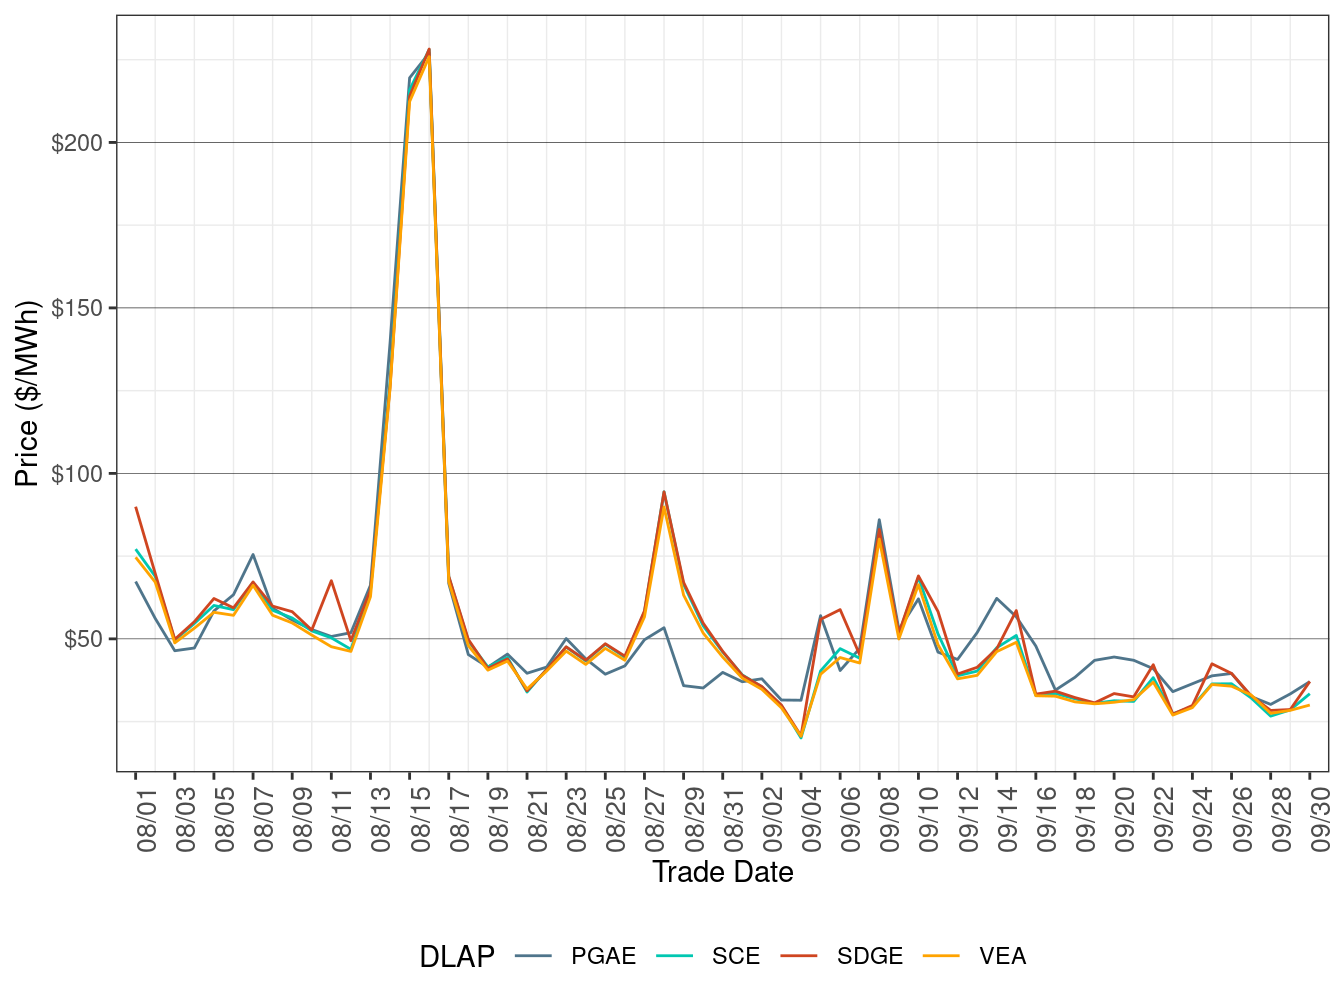
Figure 3 shows daily simple average prices for all four DLAPs (PG&E, SCE, SDG&E, and VEA) for all hours respectively in FMM.
FMM DLAP prices on average decreased compared to the previous month, correlated with falling natural gas prices.
TABLE 4 below lists the binding constraints that resulted in relatively high or low DLAP prices on certain dates.
Figure 3: FMM Simple Average DLAP Prices (All Hours)
| DLAP LMPs Affected | Dates | Transmission Constraint |
|---|---|---|
| SDGE | September 6 | MIGUEL-MIGUELMP-500 XFMR transmission element; GATES1-MIDWAY-500kV line |
| All | September 8 | LOSBANOS-GATES1-500kV line |
| All | September 10 | 6410_CP1_NG nomogram |
| PGAE | September 14 | LOSBANOS-GATES1-500kV line |
| SDGE | September 15 | 7820_TL 230S_OVERLOAD_NG nomogram |
Figure 4 below shows the daily frequency of positive price spikes and negative prices by price range for the DLAPs in the FMM.
The cumulative frequency of prices in FMM above $250/MWh decreased to 0.24 percent in September from 1.54 percent in the previous month, while the cumulative frequency of negative prices increased to 1.42 percent in September from 0.09 percent in the previous month, correlated with the increase in renewable curtailment.
Figure 4: Daily Frequency of FMM DLAP Positive Price Spikes and Negative Prices
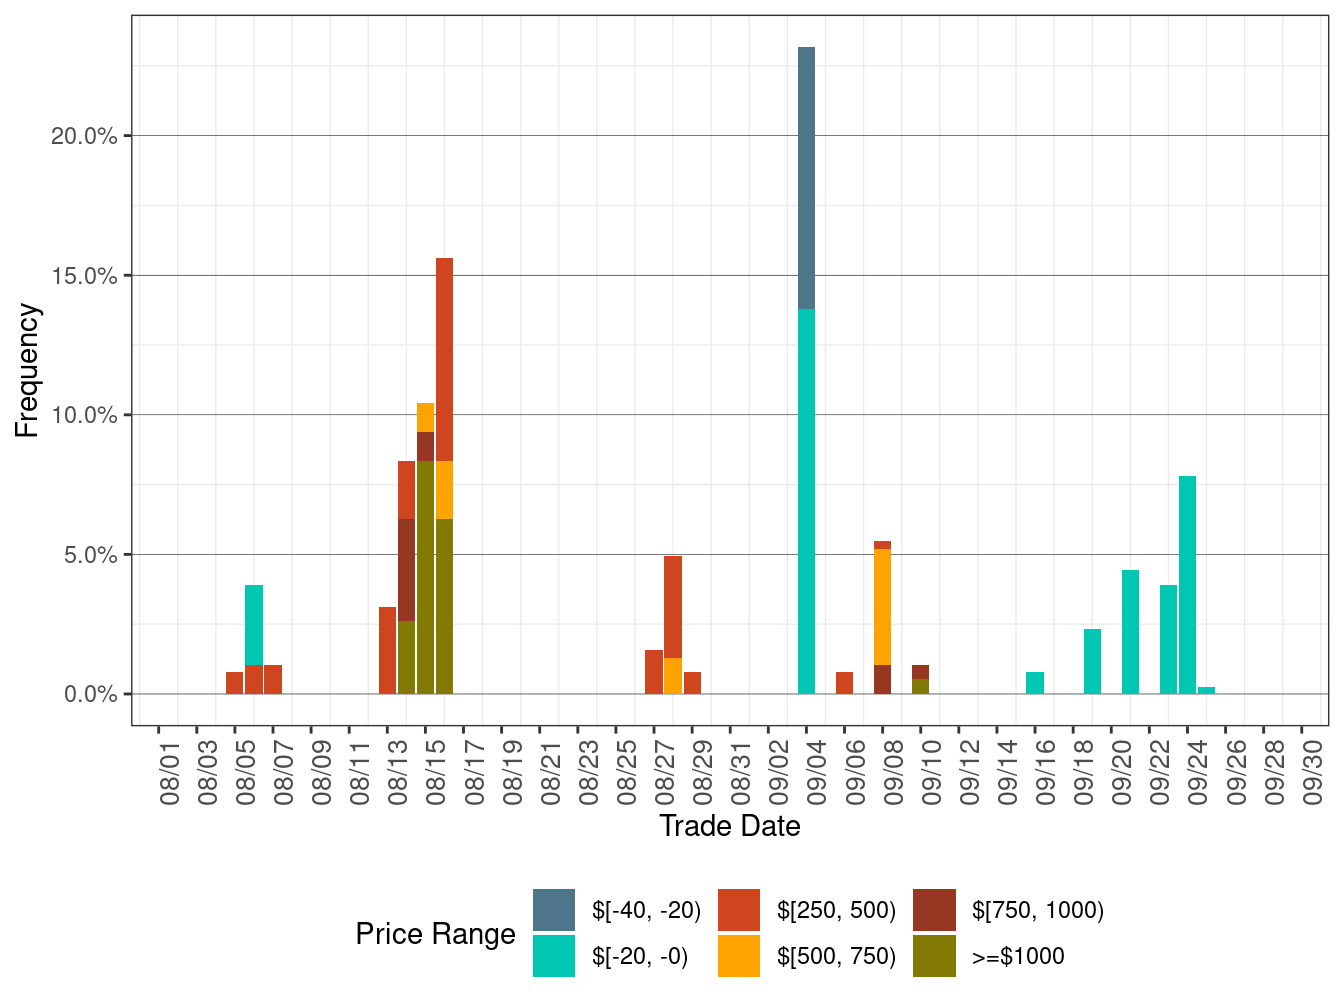
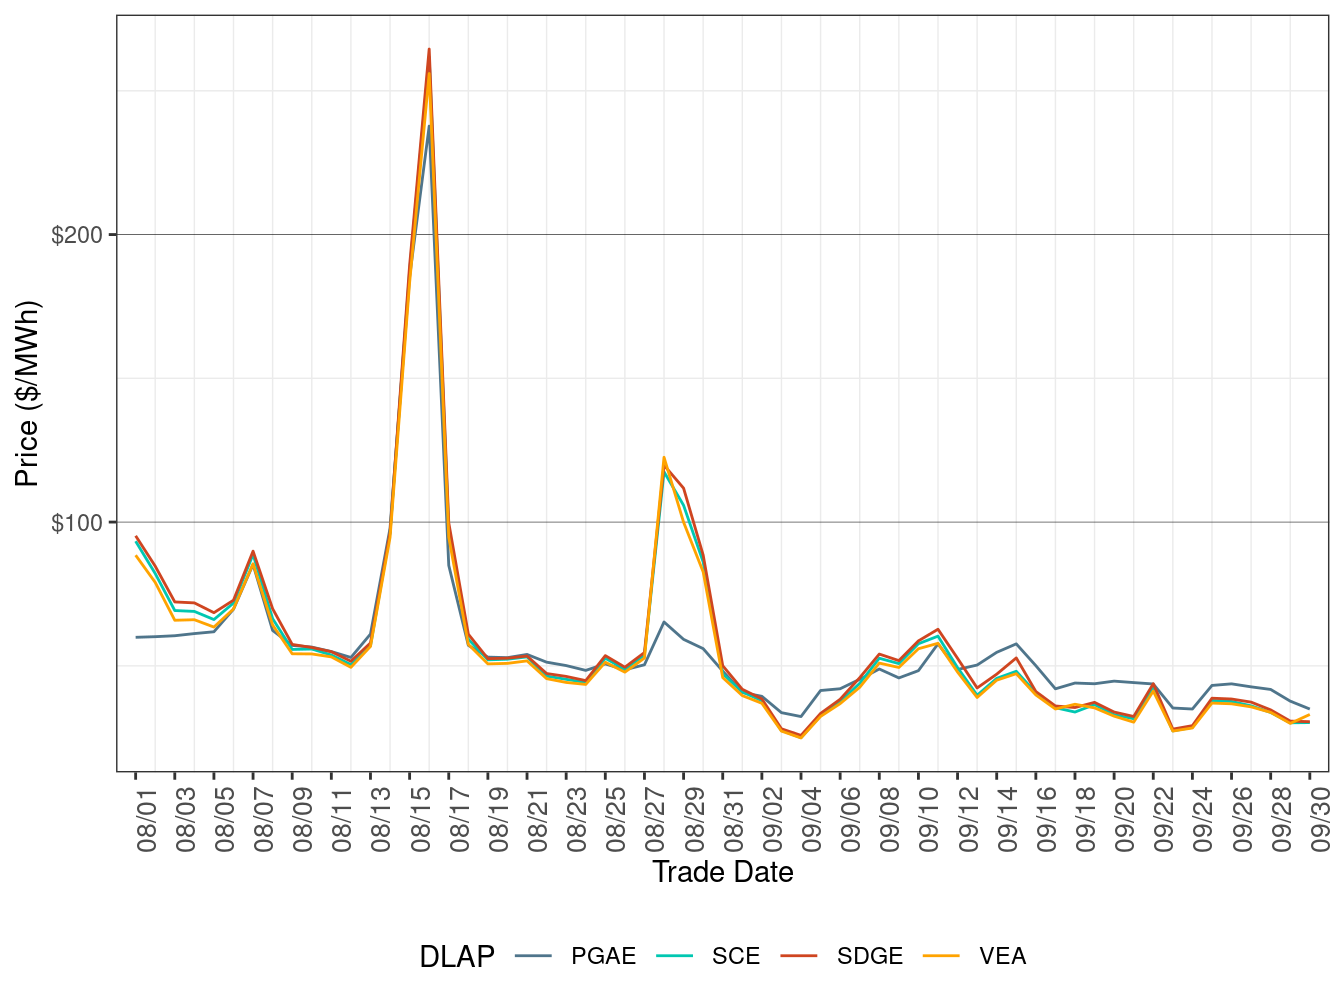
Figure 5 shows daily simple average prices for all the DLAPs (PG&E, SCE, SDG&E, and VEA) for all hours respectively in RTD.
RTD DLAP prices on average decreased compared to the previous month and were more stable, correlated with falling natural gas prices.
TABLE 5 below lists the binding constraints that resulted in relatively high or low DLAP prices on certain dates.
Figure 5: RTD Simple Average DLAP Prices (All Hours)
| DLAP | Dates | Transmission Constraint |
|---|---|---|
| PGAE | September 5 | GATES1-MIDWAY-500kV line; MIGUEL-MIGUELMP-500 XFMR transmission element |
| PGAE | September 8 | LOSBANOS-GATES1-500kV line |
| SCE; SDGE; VEA | September 10 | 6410_CP1_NG nomogram |
| SDGE | September 11 | 6410_CP1_NG nomogram; 7820_TL 230S_OVERLOAD_NG nomogram |
| PGAE | September 14 | LOSBANOS-GATES1-500kV line |
| SDGE | September 15 | 7820_TL 230S_OVERLOAD_NG nomogram |
| PGAE | September 18-21 | GATES1-MIDWAY-500kV line; 7820_TL 230S_OVERLOAD_NG nomogram; MIGUEL-MIGUELMP-500 XFMR transmission element; LOSBANOS-GATES1-500kV line |
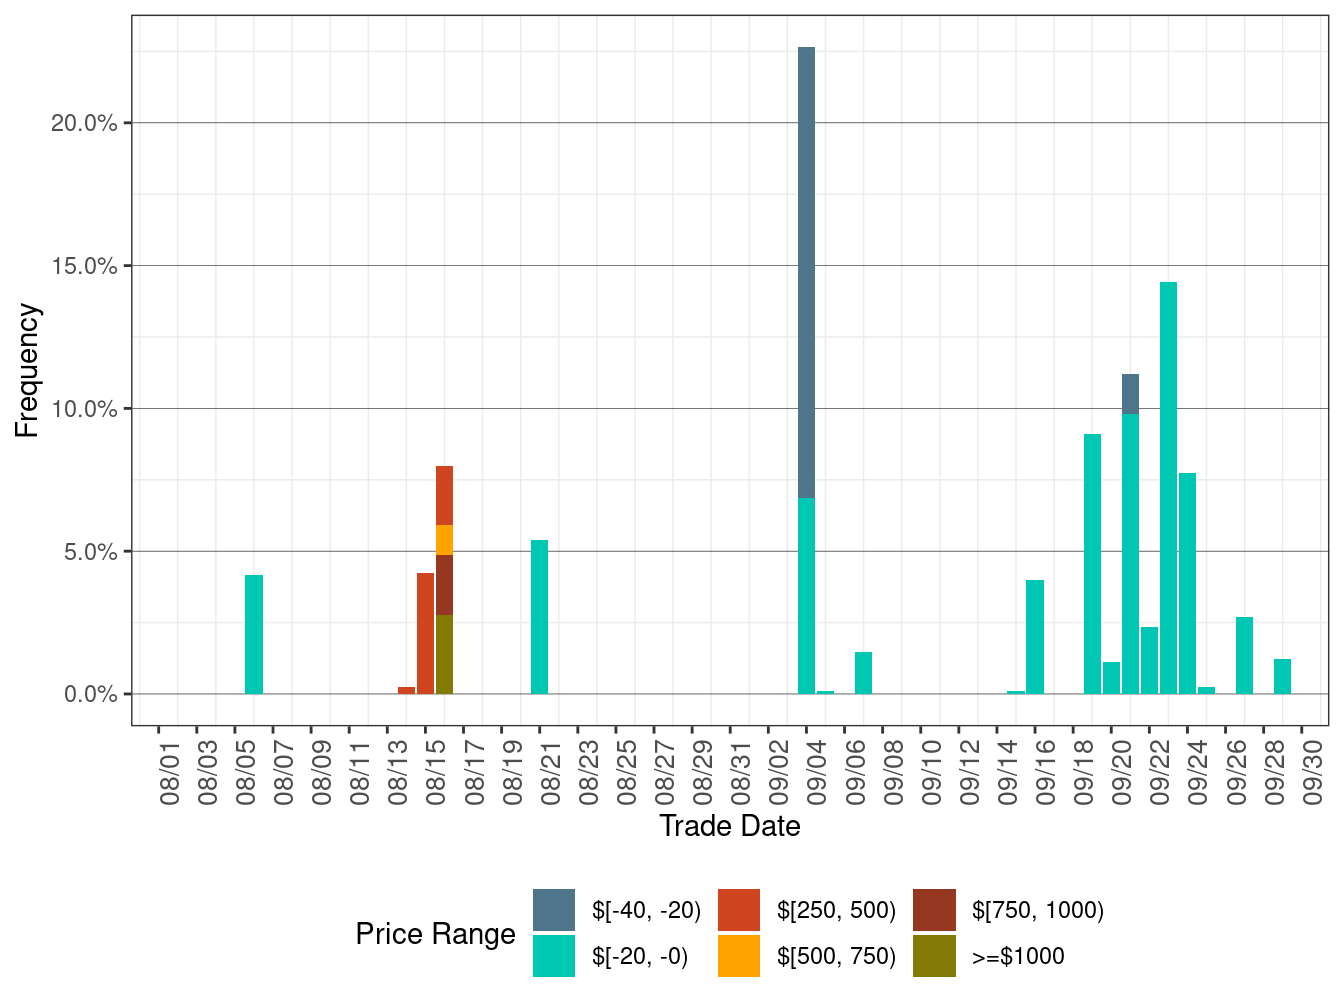
Figure 6 below shows the daily frequency of positive price spikes and negative prices by price range for the DLAPs in RTD.
The cumulative frequency of prices in RTD above $250/MWh decreased to 0.00 percent in September from 0.40 percent in the previous month, while the cumulative frequency of negative prices increased to 2.61 percent in September from 0.31 percent in the previous month, correlated with the increase in renewable generation curtailment.
Figure 6: Daily Frequency of RTD DLAP Positive Price Spikes and Negative Prices