Section 6 Ancillary Services
IFM Procurement and Prices
Table 6.1 hows the monthly IFM average ancillary service procurements and Table 6.2 the monthly average prices. In October the monthly average procurement decreased for regulation down, spinning and non-spinning reserves.
| Month | Oct-2020 | Sep-2020 | Percent Change |
|---|---|---|---|
| Regulation_Up | 414 | 414 | 0.0% |
| Regulation_Down | 591 | 637 | -7.2% |
| Spin | 842 | 985 | -14.5% |
| Non-Spin | 830 | 948 | -12.4% |
| Month | Oct-2020 | Sep-2020 | Percent Change |
|---|---|---|---|
| Non-Spin | $5.05 | $7.76 | -34.9% |
| Regulation_Down | $10.94 | $9.80 | 11.6% |
| Regulation_Up | $12.39 | $15.30 | -19.1% |
| Spin | $8.59 | $11.01 | -21.9% |
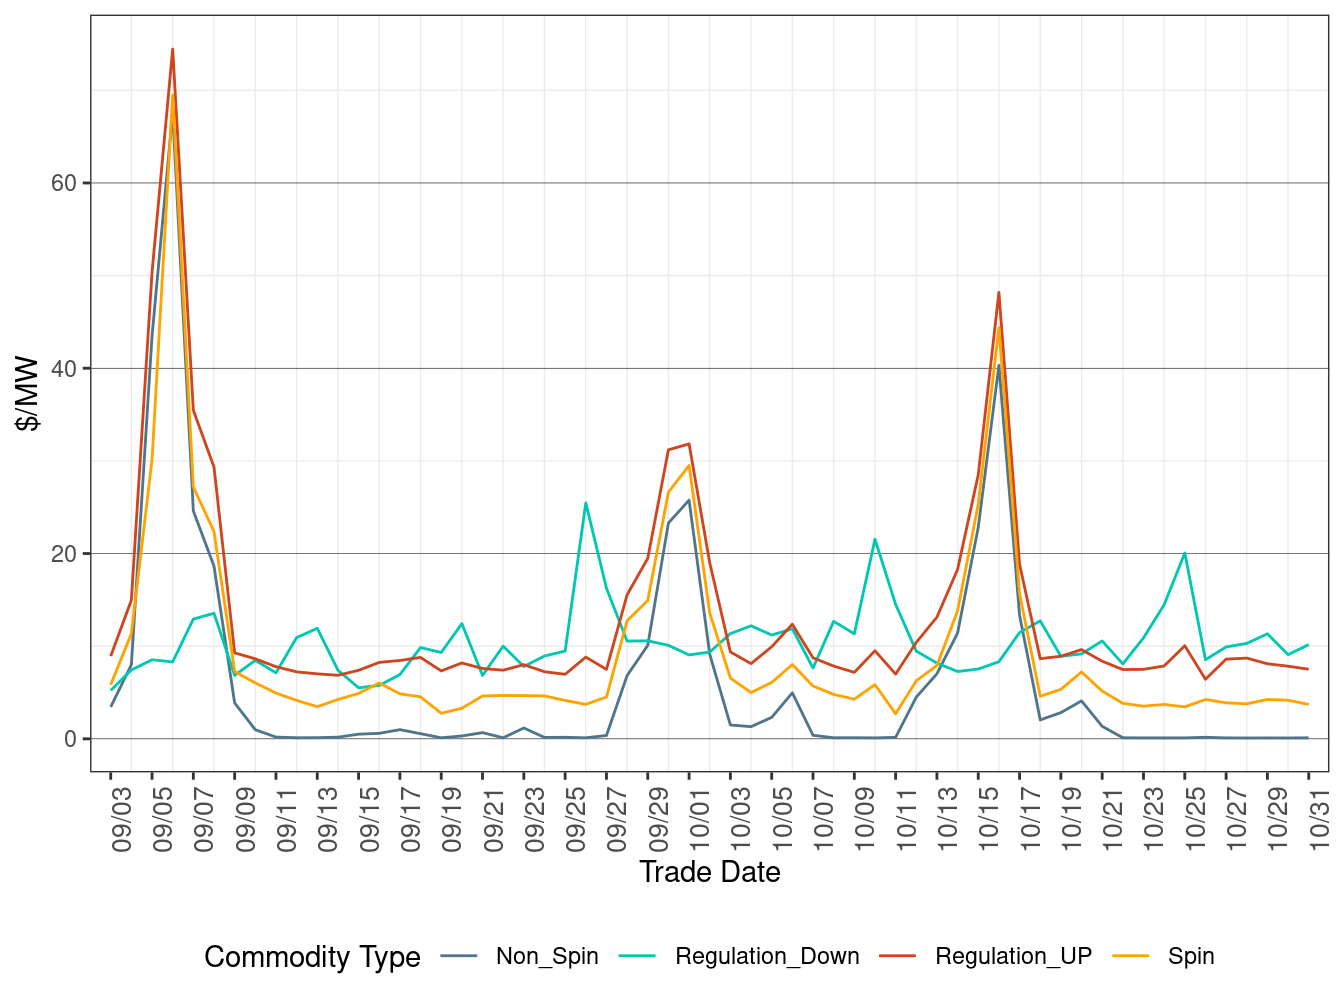
Figure 6.1 shows the daily IFM average ancillary service prices. The average prices for regulation up, spinning and non-spinning reserves were elevated on October 1 and 15-16 due to high opportunity cost of energy.
Figure 6.1: IFM (Day-Ahead) Ancillary Service Average Price
Scarcity Events
The ancillary services scarcity pricing mechanism is triggered when the ISO is not able to procure the target quantity of one or more ancillary services in the IFM and real-time market runs. The scarcity events in October are shown in the Table 6.3 below, all the scarcity events occured in real-time market.
| Date | Hour Ending | Interval | Ancillary Service | Region | Shortfall | Percentage of requirement |
|---|---|---|---|---|---|---|
| Oct-05 | 19 | 3 | Regulation Up | CAISO_EXP | 2.30 | 1.0% |
| Oct-05 | 19 | 3 | Non-spin | CAISO_EXP | 264.40 | 22.0% |
| Oct-10 | 17 | 1 | Regulation Down | NP26_EXP | 15.40 | 5.0% |
| Oct-20 | 1 | 2 | Regulation Down | SP26_EXP | 0.69 | 0.4% |
| Oct-23 | 7 | 4 | Regulation Down | SP26_EXP | 4.80 | 3.0% |
| Oct-24 | 4 | 2 | Regulation Down | SP26_EXP | 0.47 | 0.3% |
| Oct-24 | 6 | 1 | Regulation Down | SP26_EXP | 2.88 | 2.0% |
| Oct-26 | 4 | 1 | Regulation Up | NP26_EXP | 0.07 | 0.1% |
| Oct-26 | 7 | 2 | Regulation Down | SP26_EXP | 3.98 | 3.0% |
| Oct-27 | 6 | 4 | Regulation Down | SP26_EXP | 3.11 | 2.0% |
| Oct-30 | 9 | 1 | Regulation Down | SP26_EXP | 6.74 | 3.0% |