Section 8 Energy Imbalance Market
On November 1, 2014, the California Independent System Operator Corporation (CAISO) and Portland based PacifiCorp fully activated the Energy Imbalance Market (EIM). This real-time market is the first of its kind in the West. The Energy Imbalance Market allows balancing authorities outside of the CAISO balancing authority area to voluntarily take part in the imbalance energy portion of the CAISO locational marginal price-based real-time market. PacifiCorp, the CAISO, and market participants participated in market simulations prior to the start of the Energy Imbalance Market on November 1, including parallel production from October 1 to November 1.
The EIM uses state-of-the-art software to analyze regional grid needs and make available low-cost generation to meet demand every five minutes. It can bring many benefits to the West such as cost savings, improving the efficiency of dispatching resources, facilitating the renewable integration, more reliability, etc.
On December 1, 2015, NV Energy, the Nevada-based utility successfully began participating in the western Energy Imbalance Market (EIM). With the addition of NV Energy, the EIM expands into Nevada, where the utility serves 2.4 million customers.
On October 1, 2016, Phoenix-based Arizona Public Service (AZPS) and Puget Sound Energy (PSEI) of Washington State successfully began full participation in the western Energy Imbalance Market. With the addition of Arizona Public Service and Puget Sound Energy, The EIM is serving over 5 million consumers in California, Washington, Oregon, Arizona, Idaho, Wyoming, Nevada and Utah.
On October 1, 2017, Portland General Electric Company (PGE) became the fifth western utility to successfully begin full participation in the western Energy Imbalance Market. PGE joins Arizona Public Service, Puget Sound Energy, NV Energy, PacifiCorp and the ISO, together serving over 38 million consumers in eight states: California, Arizona, Oregon, Washington, Utah, Idaho, Wyoming and Nevada.
On April 4, 2018, Boise-based Idaho Power (IPCO) and Powerex of Vancouver (BCHA), British Columbia successfully entered the EIM, allowing the ISO’s real-time power market to serve energy imbalances occurring within about 55 percent of the electric load in the Western Interconnection. The eight western EIM participants serve more than 42 million consumers in the power grid stretching from the border with Canada south to Arizona, and eastward to Wyoming.
On April 3, 2019, Sacramento Municipal Utility District (SMUD), part of the Balancing Authority of Northern California (BANC), successfully began full participation in the Western EIM, becoming the first publicly owned agency to be an EIM entity in the Western EIM.
On April 1, 2020, Seattle City Light (SCL) and Salt River Project (SRP) successfully joined the Western EIM. The two utilities serve about 1.5 million customers in the West’s first real-time energy market. Together with Salt River Project and Seattle City Light, the current EIM participants represent 61 percent of the load in the Western Electric Coordinating Council (WECC).
EIM Prices
Figure 8.1, and Figure 8.2 show daily simple average ELAP prices for PACE, PACW, NEVP, AZPS, PSEI, PGE, IPCO, BCHA, and BANCSMUD for on-peak hours, and, off-peak hours respectively in FMM. Figure 8.3 show daily simple average ELAP prices for PACE, PACW, NEVP, AZPS, PSEI, PGE, IPCO, BCHA, and BANCSMUD for and all hours in FMM. On October 14, the prices for AZPS, BANCSMUD, and SRP spiked due to generation outage, transmission congestion and upward load adjustment. The prices for AZPS, BANCSMUD, and SRP were also elevated on October 15 driven by generation outage, upward load adjustment, and renewable deviation.
Figure 8.1: EIM Simple Average LAP Prices (On-Peak Hours) in FMM
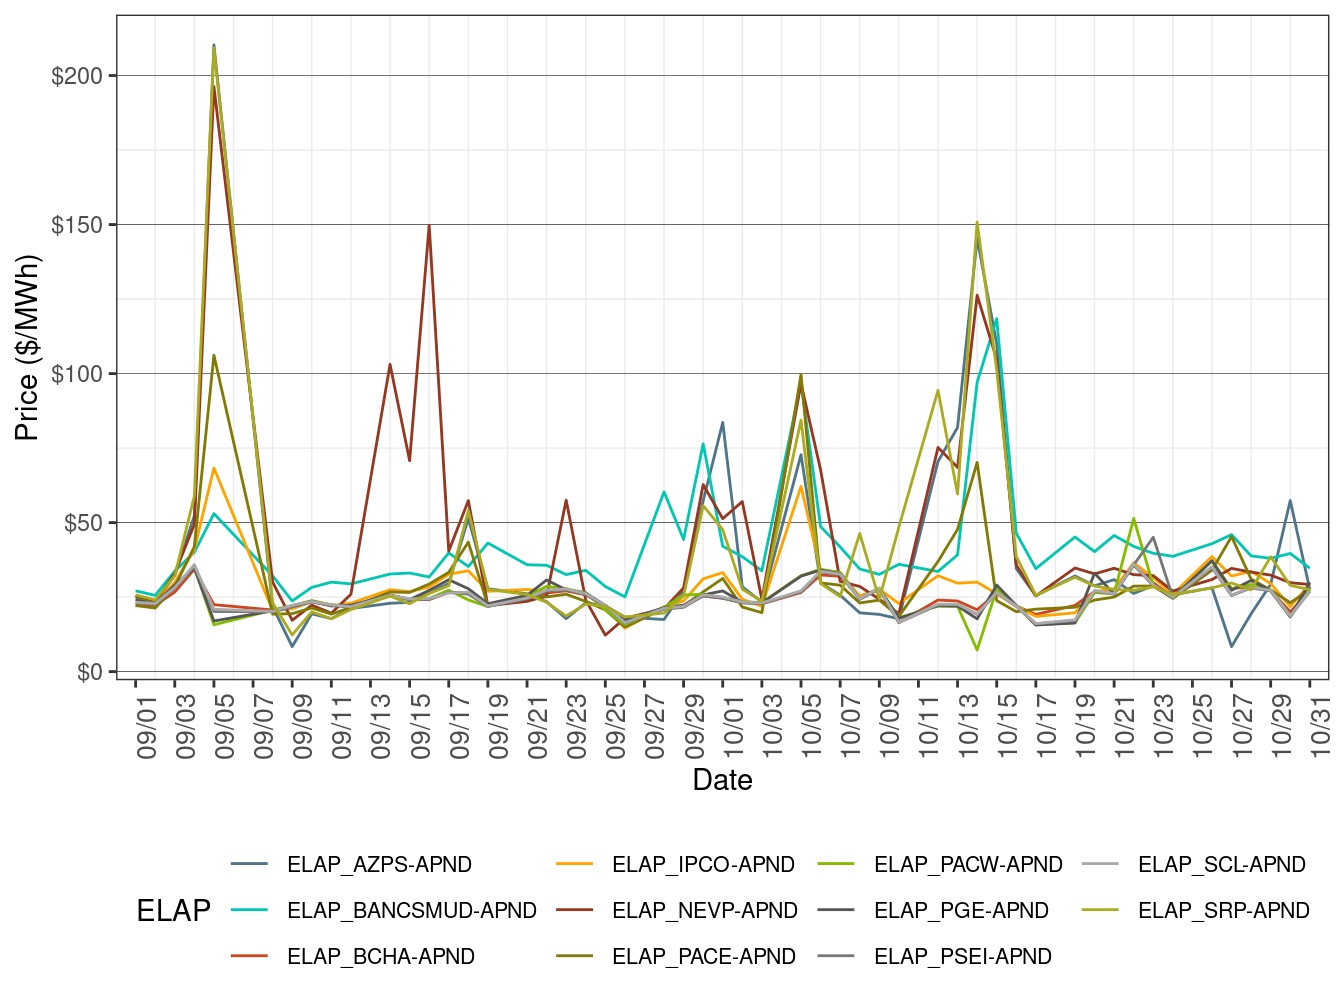
Figure 8.2: EIM Simple Average LAP Prices (Off-Peak Hours) in FMM
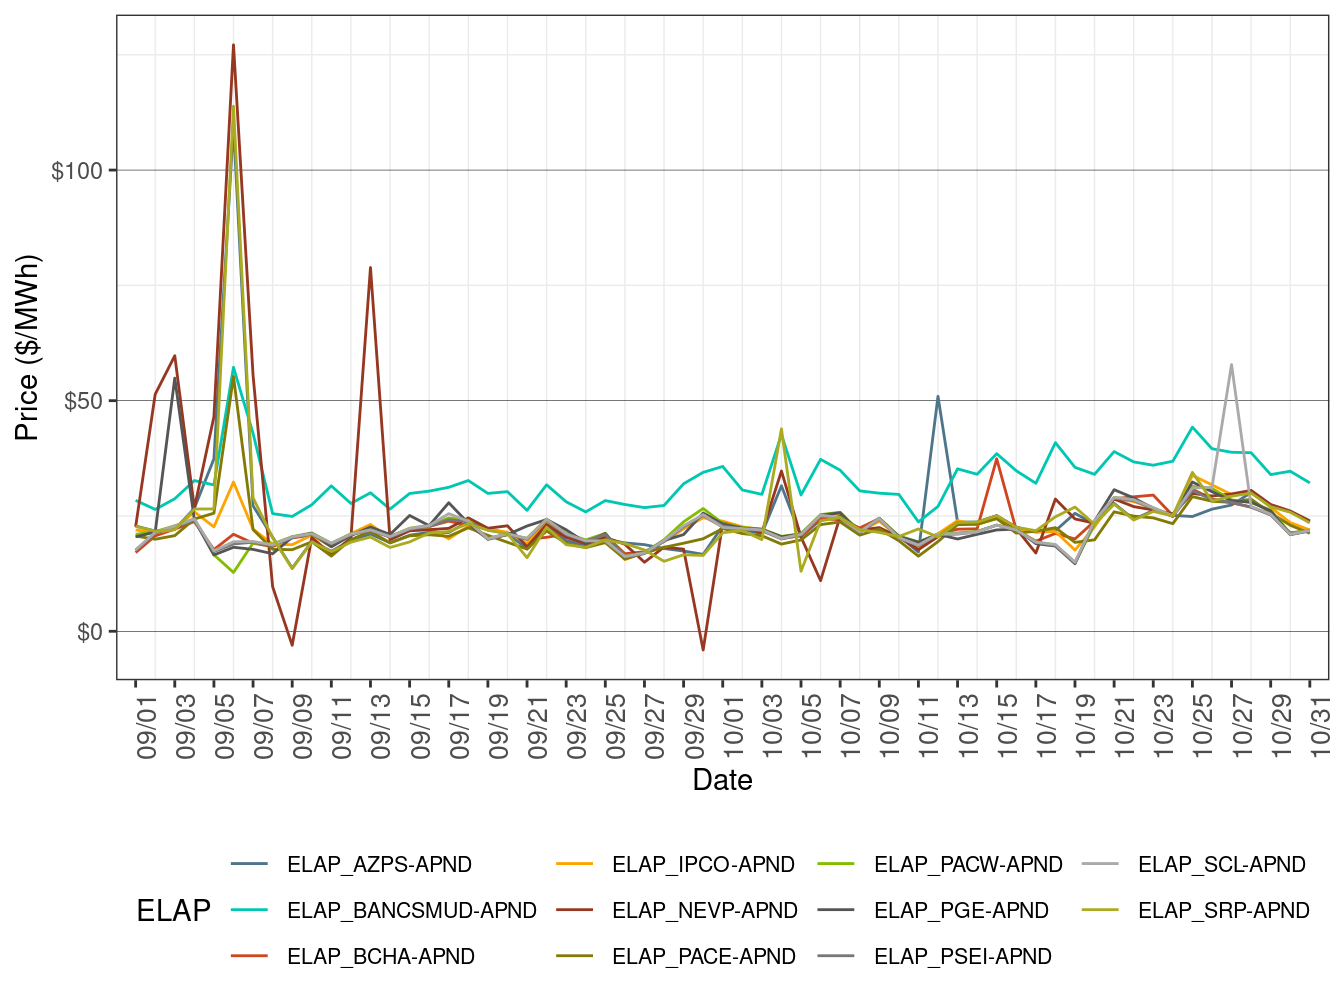
Figure 8.3: EIM Simple Average LAP Prices (All Hours) in FMM
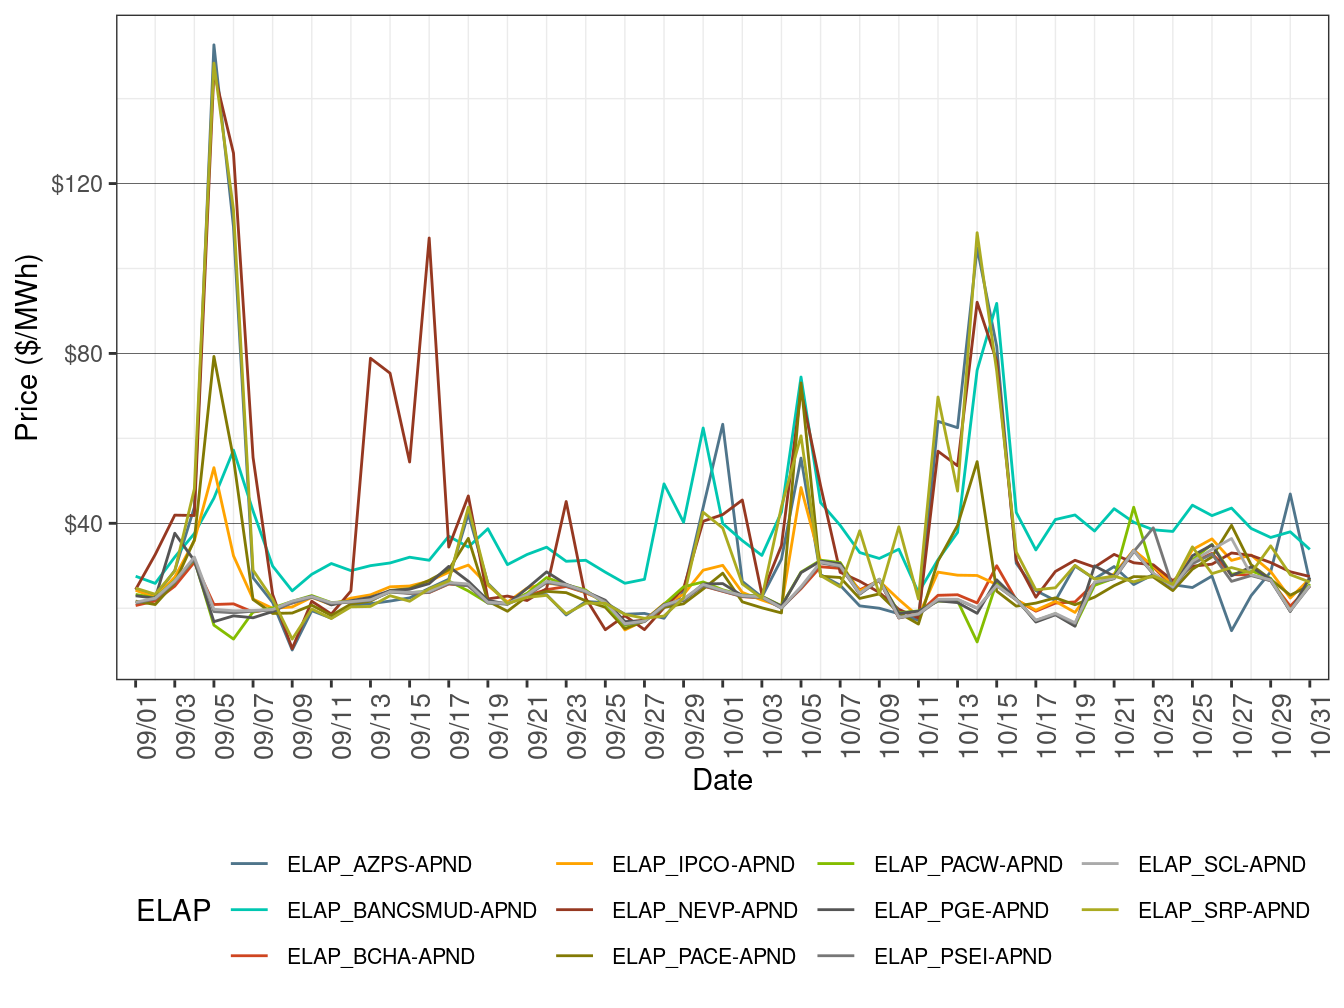
Figure 8.4 shows daily simple average ELAP prices for PACE, PACW, NEVP, AZPS, PSEI, PGE, IPCO, BCHA, BANCSMUD, SCL and SRP for all hours in RTD. October 8 saw elevated price for SRP due to tight supply. AZPS price spiked on October 15 due to import reduction and renewable deviation. Figure 8.5, and Figure 8.6 show daily simple average ELAP prices for PACE, PACW, NEVP, AZPS, PSEI, PGE, IPCO, BCHA, and BANCSMUD for peak hours, and off-peak hours, respectively in RTD.
Figure 8.4: EIM Simple Average LAP Prices (On-Peak Hours) in RTD
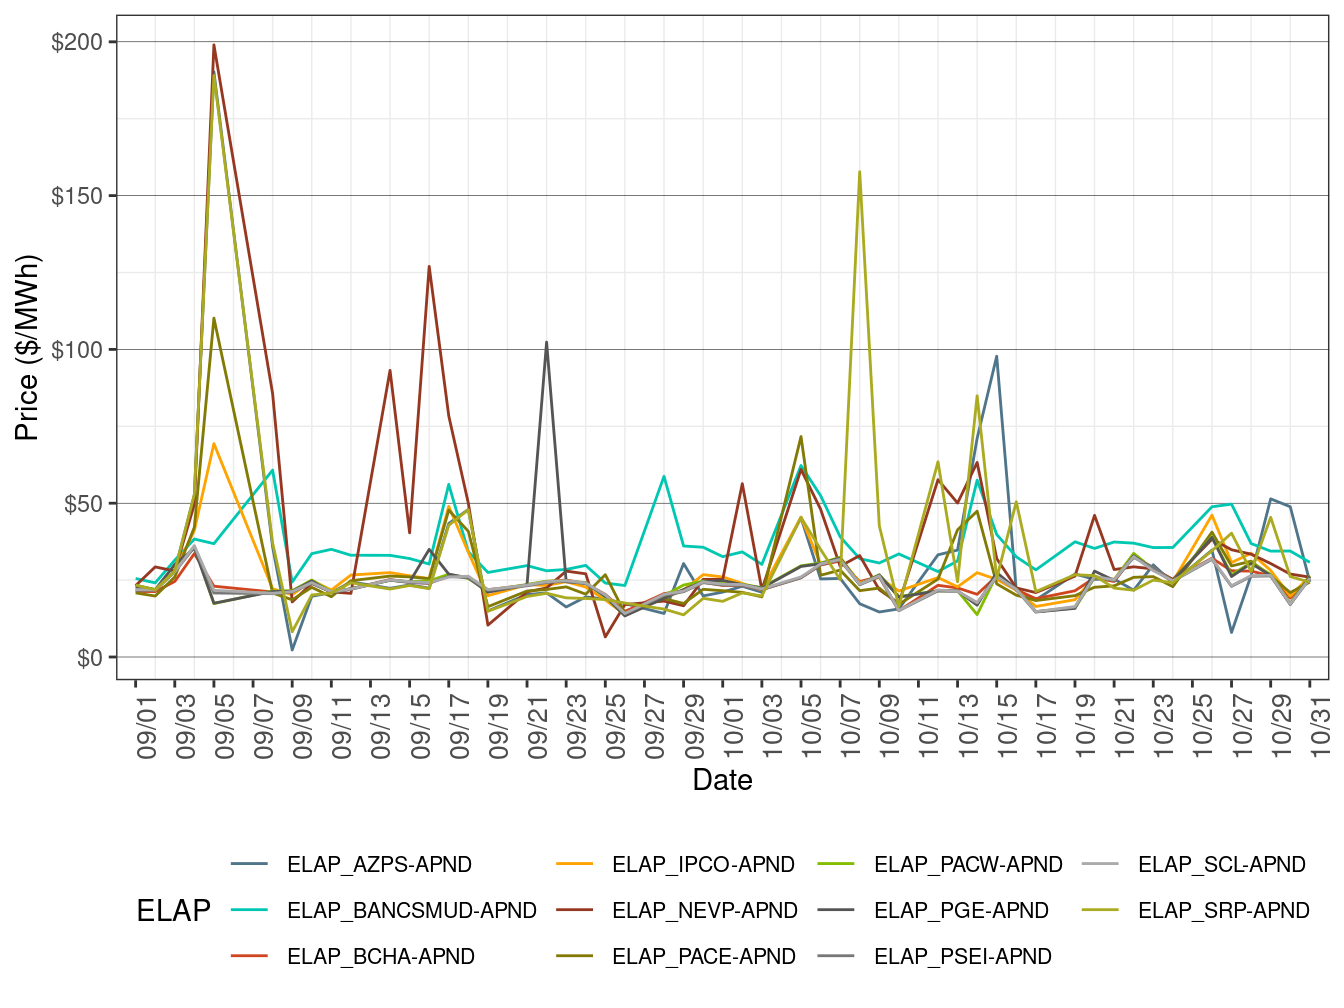
Figure 8.5: EIM Simple Average LAP Prices (Off-Peak Hours) in RTD
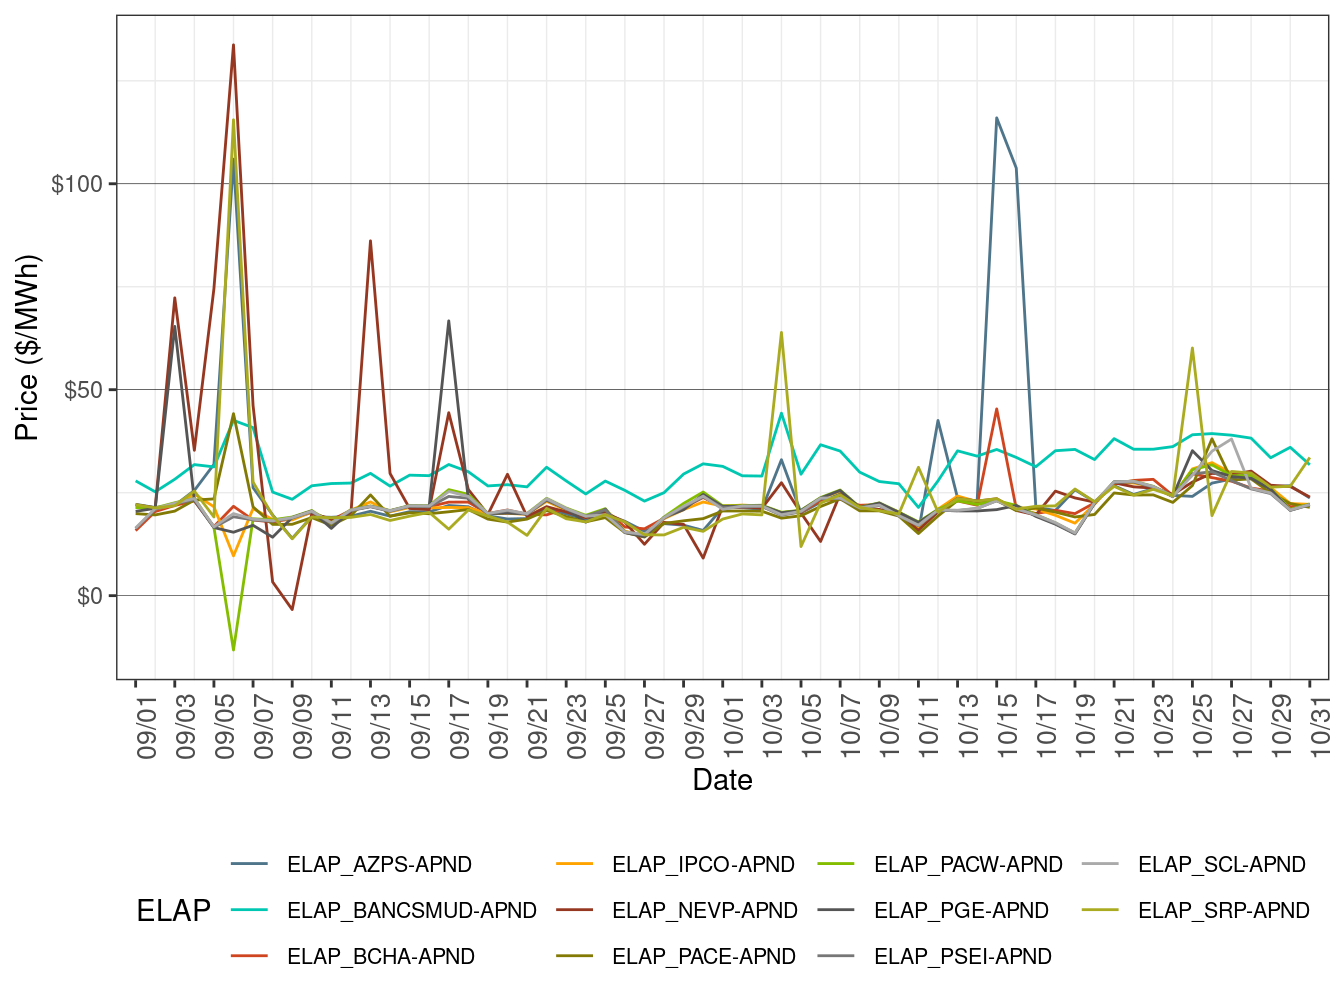
Figure 8.6: EIM Simple Average LAP Prices (All Hours) in RTD
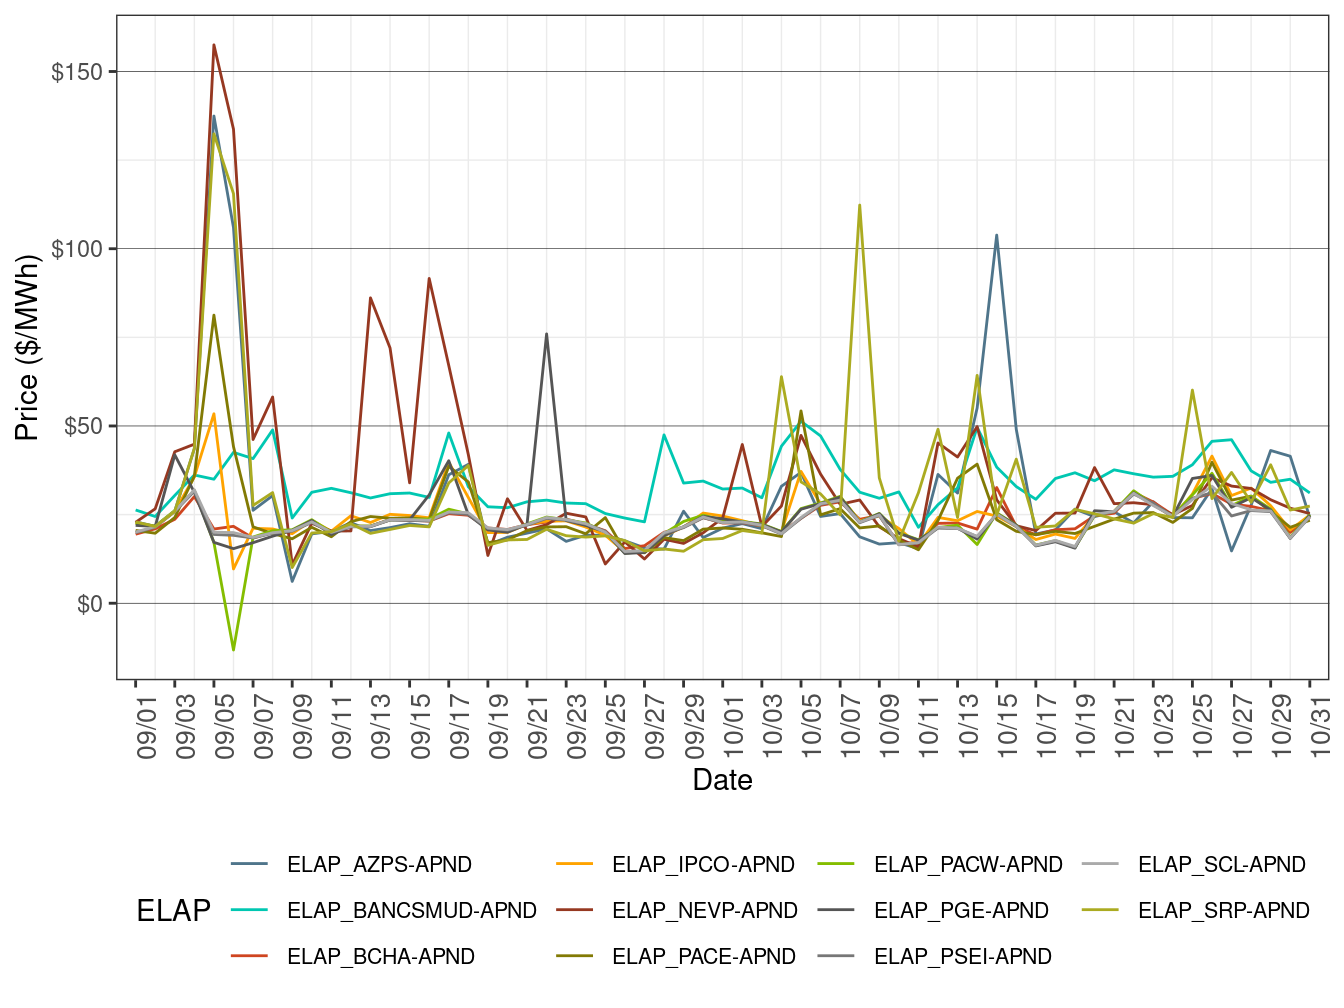
Figure 8.7 shows the daily price frequency for prices above $250/MWh and below $0/MWh in FMM. Prices are for PACE, PACW, NEVP, AZPS, PSEI, PGE, IPCO, BCHA, and BANCSMUD ELAPs. The cumulative frequency of prices above $250/MWh increased to 0.55 percent in October from 0.50 percent in September. The cumulative frequency of negative prices edged up to 0.32 percent in October from 0.30 percent in September.
Figure 8.7: Daily Frequency of EIM LAP Positive Price Spikes and Negative Prices in FMM
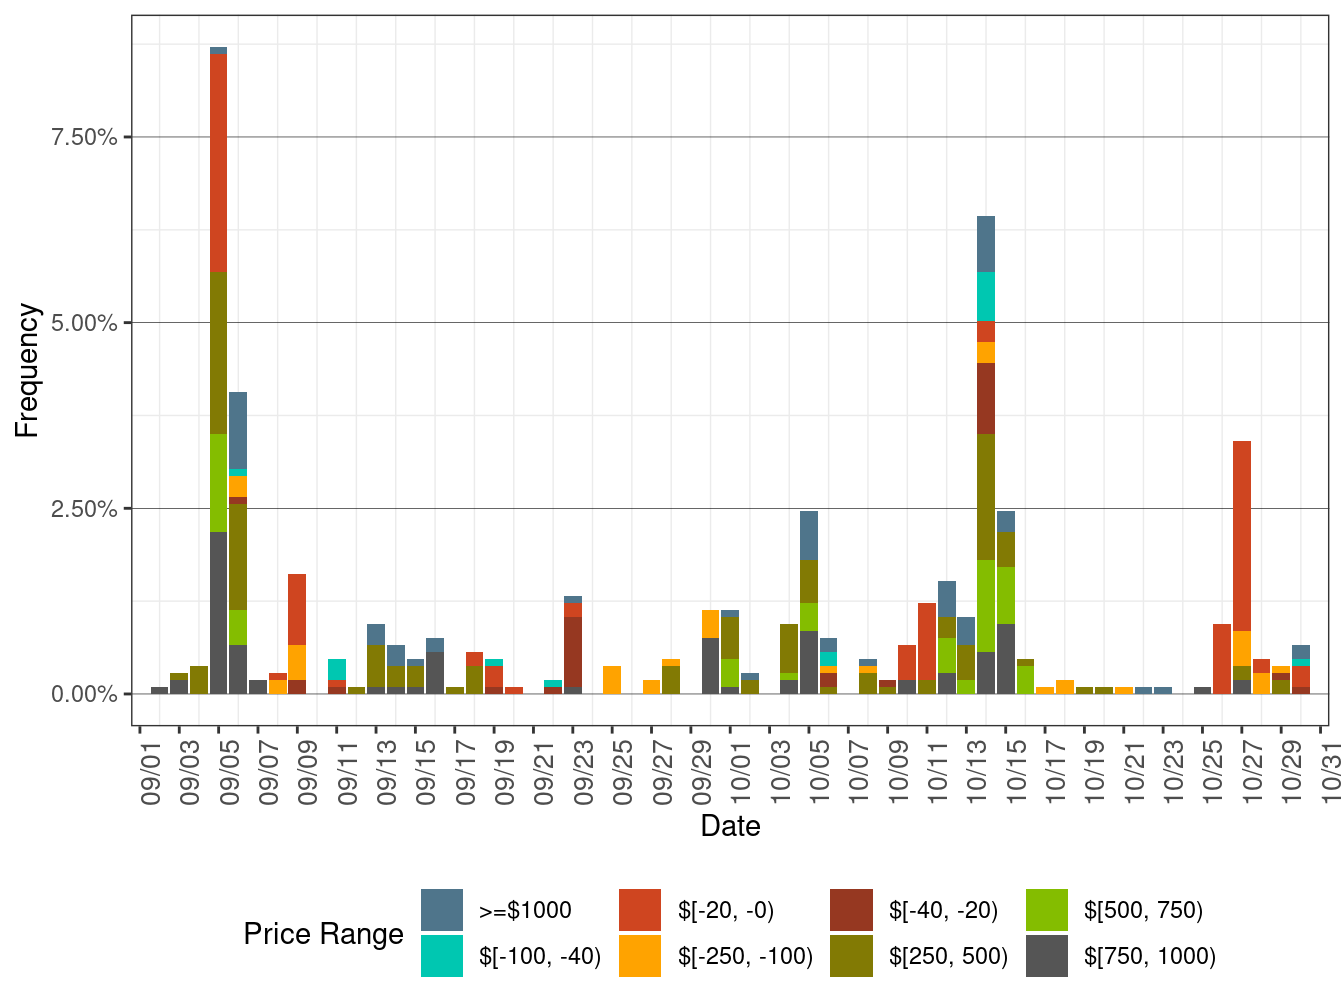
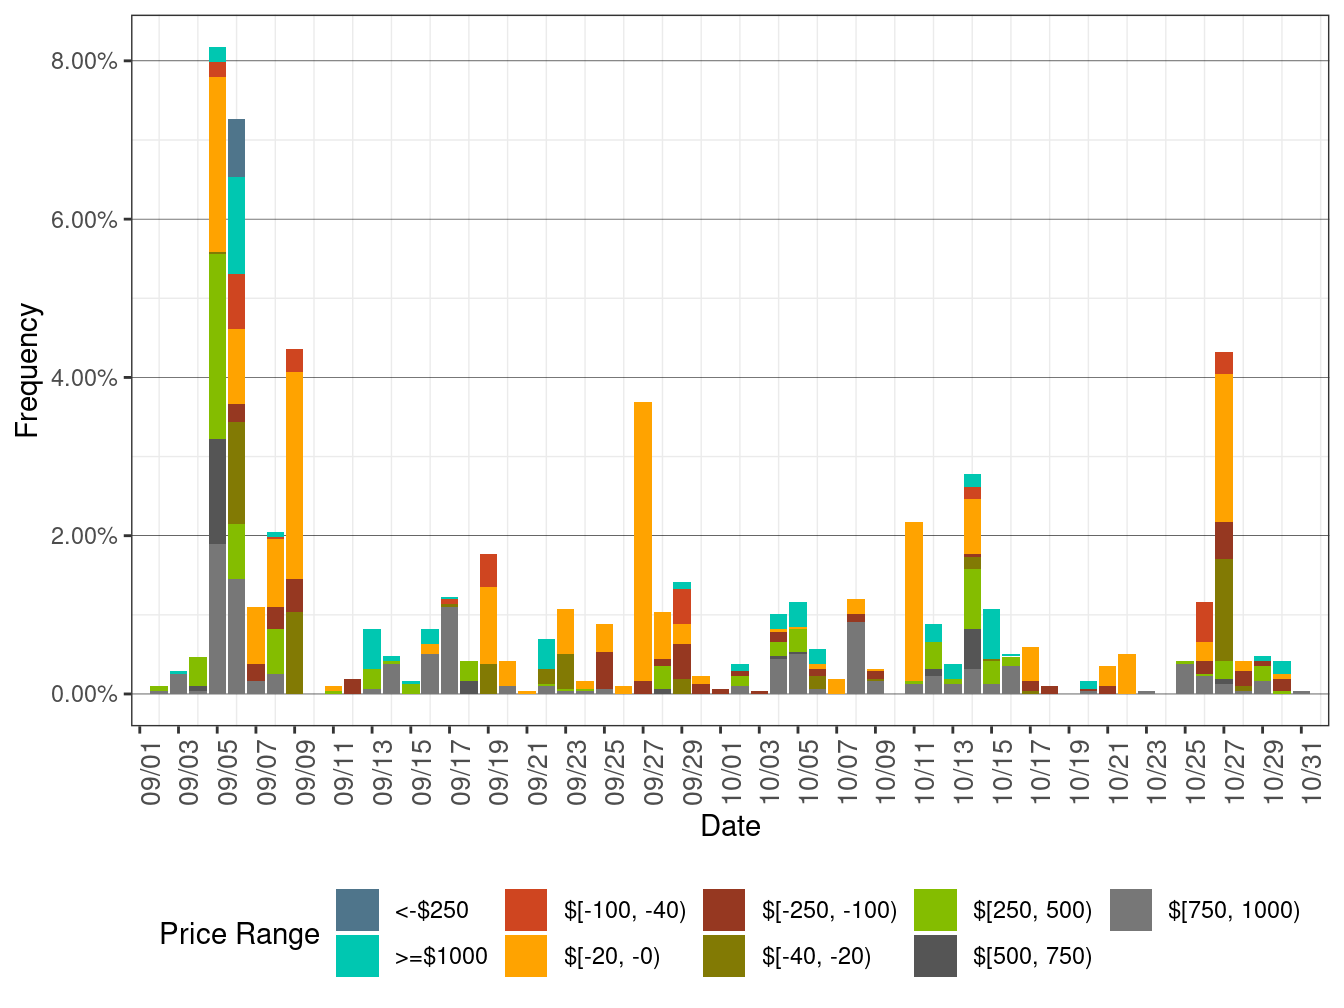
Figure 8.8 shows the daily price frequency for prices above $250/MWh and below $0/MWh in RTD. Prices are for PACE, PACW, NEVP, AZPS, PSEI, PGE, IPCO, BCHA, and BANCSMUD ELAPs. The graph may provide a trend of price spikes over time. The cumulative frequency of prices above $250/MWh fell to 0.33 percent in October from 0.53 in September. The cumulative frequency of negative prices decreased to 0.37 percent in October from 0.78 percent in September.
Figure 8.8: Daily Frequency of EIM LAP Positive Price Spikes and Negative Prices in RTD
EIM Transfers
Figure 8.9 shows the daily volume of EIM transfer for CAISO in FMM. “Import” represents the total EIM transfer from other BAs into CAISO. “Export” represents the total EIM transfer out of CAISO to other BAs in FMM. Figure 8.10 shows the daily volume of EIM transfer for PACE. Figure 8.11 shows the daily volume of EIM transfer for PACW in FMM. Figure 8.12 shows the daily volume of EIM transfer for NEVP in FMM. Figure 8.13 shows the daily volume of EIM transfer for AZPS in FMM. Figure 8.14 shows the daily volume of EIM transfer for PSEI in FMM. Figure 8.15 shows the daily volume of EIM transfer for PGE in FMM. Figure 8.16 shows the daily volume of EIM transfer for BCHA in FMM. Figure 8.17 shows the daily volume of EIM transfer for IPCO in FMM. Figure 8.18 shows the daily volume of EIM transfer for BANCSMUD in FMM.
Figure 8.9: EIM Transfer for CAISO in FMM
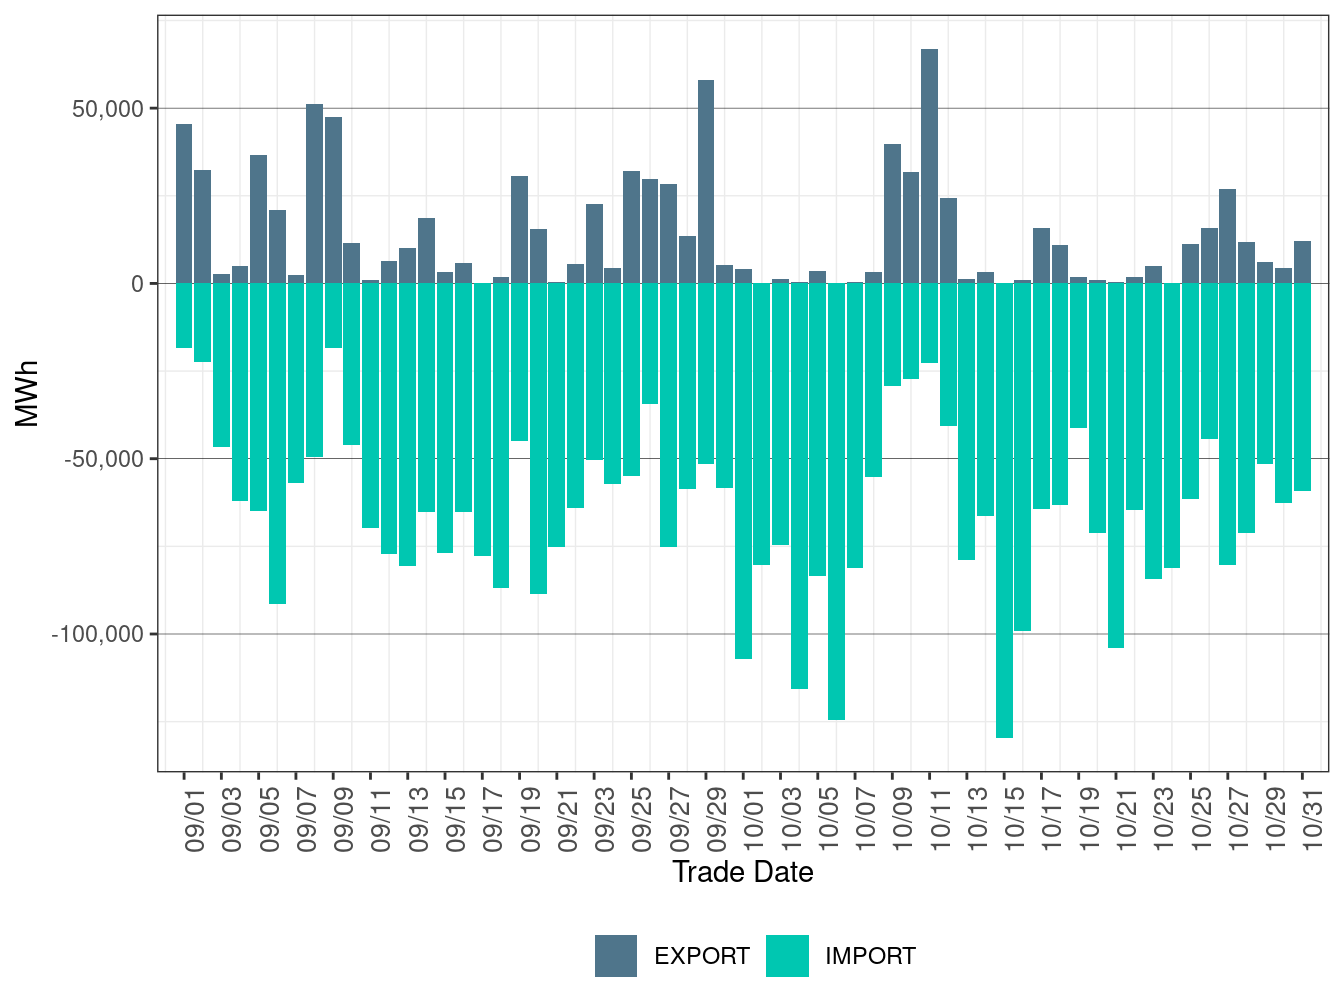
Figure 8.10: EIM Transfer for PACE in FMM
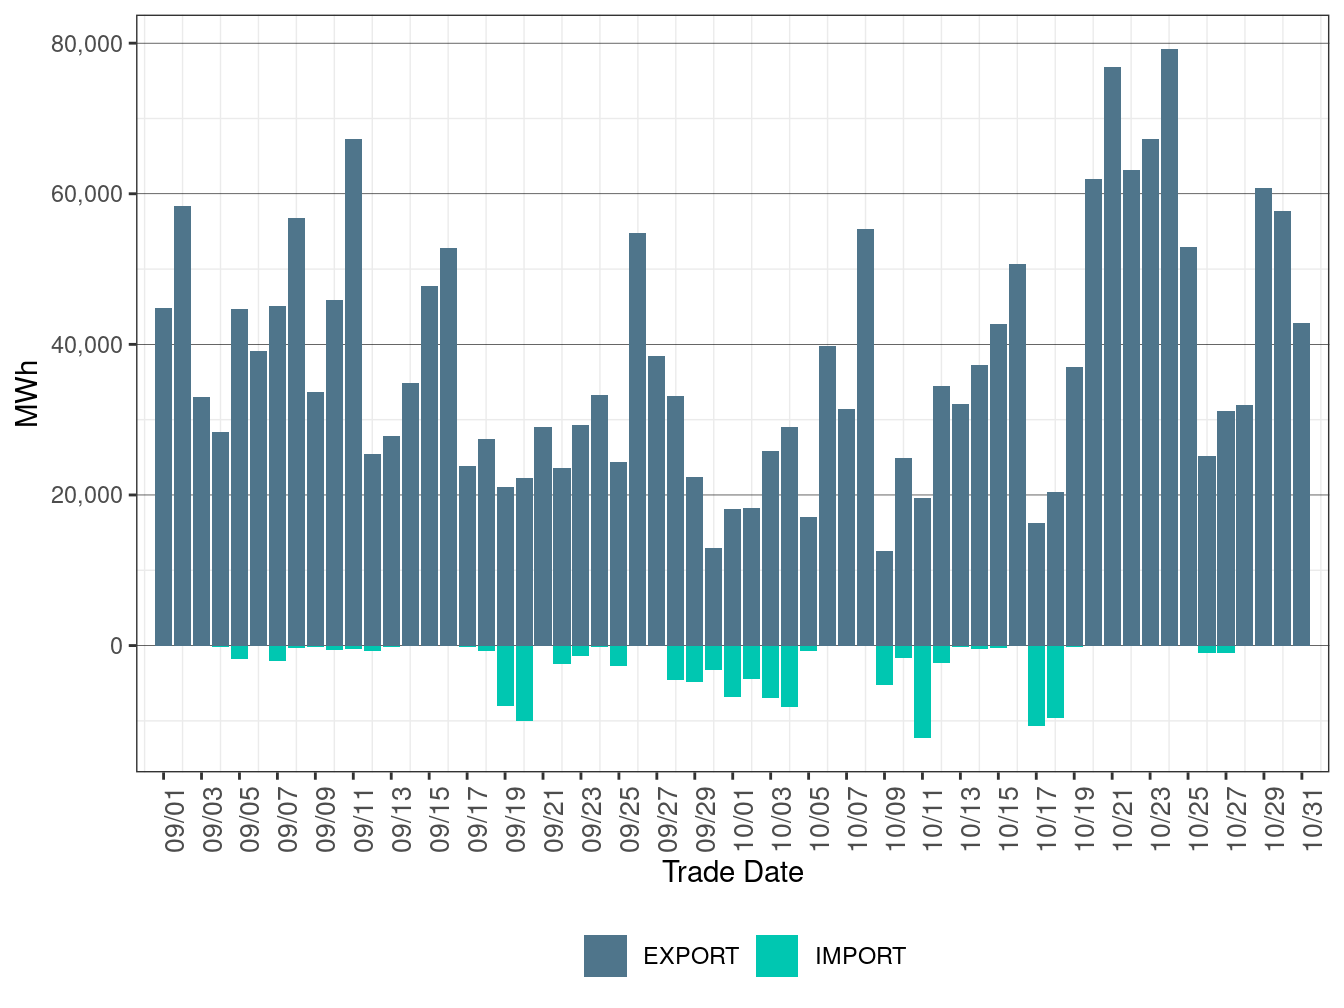
Figure 8.11: EIM Transfer for PACW in FMM

Figure 8.12: EIM Transfer for NEVP in FMM
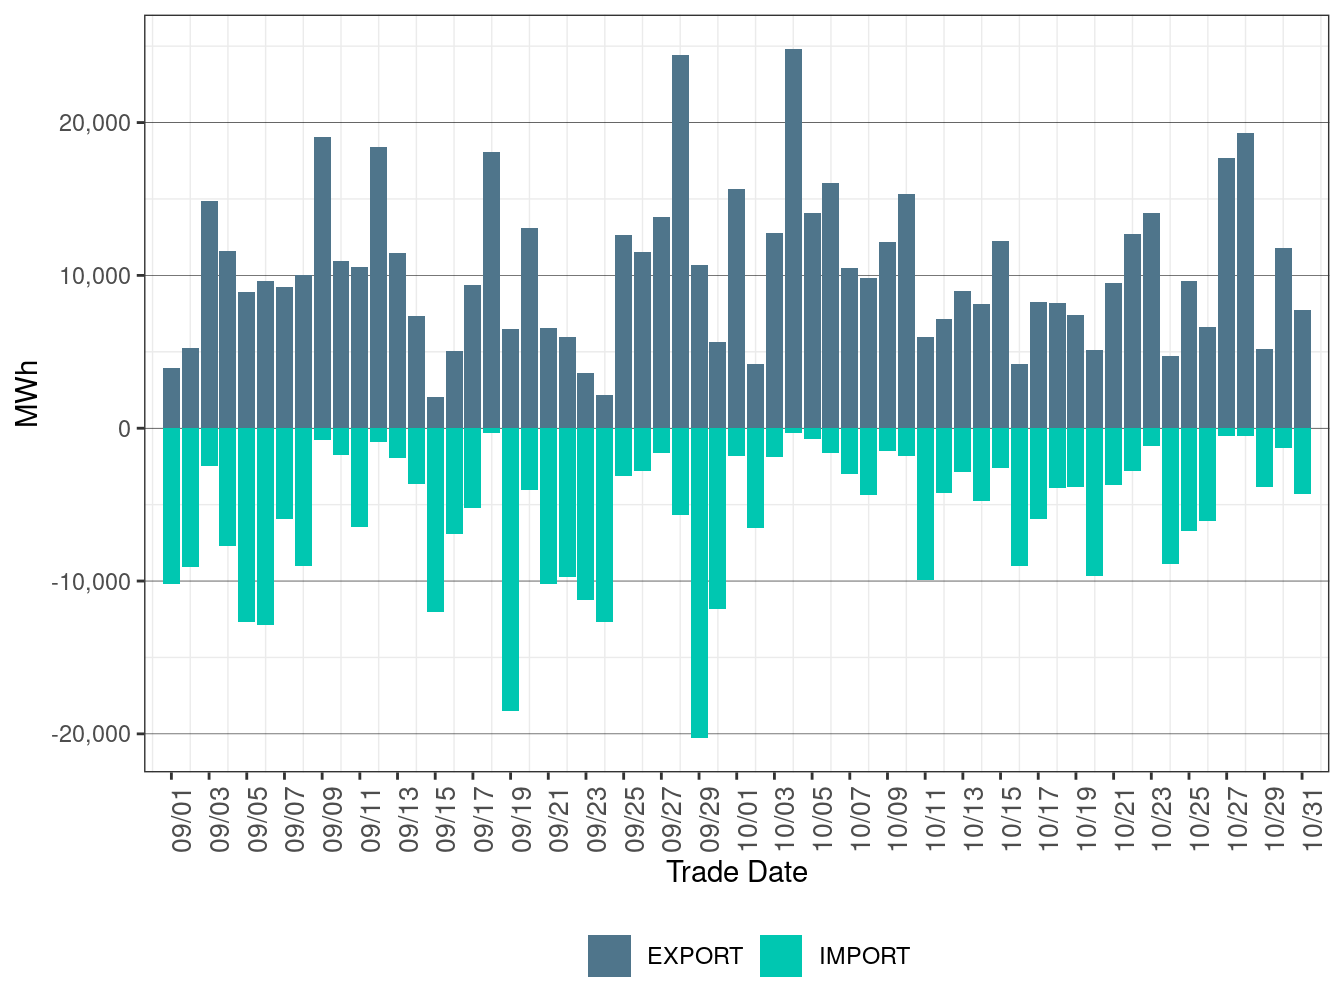
Figure 8.13: EIM Transfer for AZPS in FMM
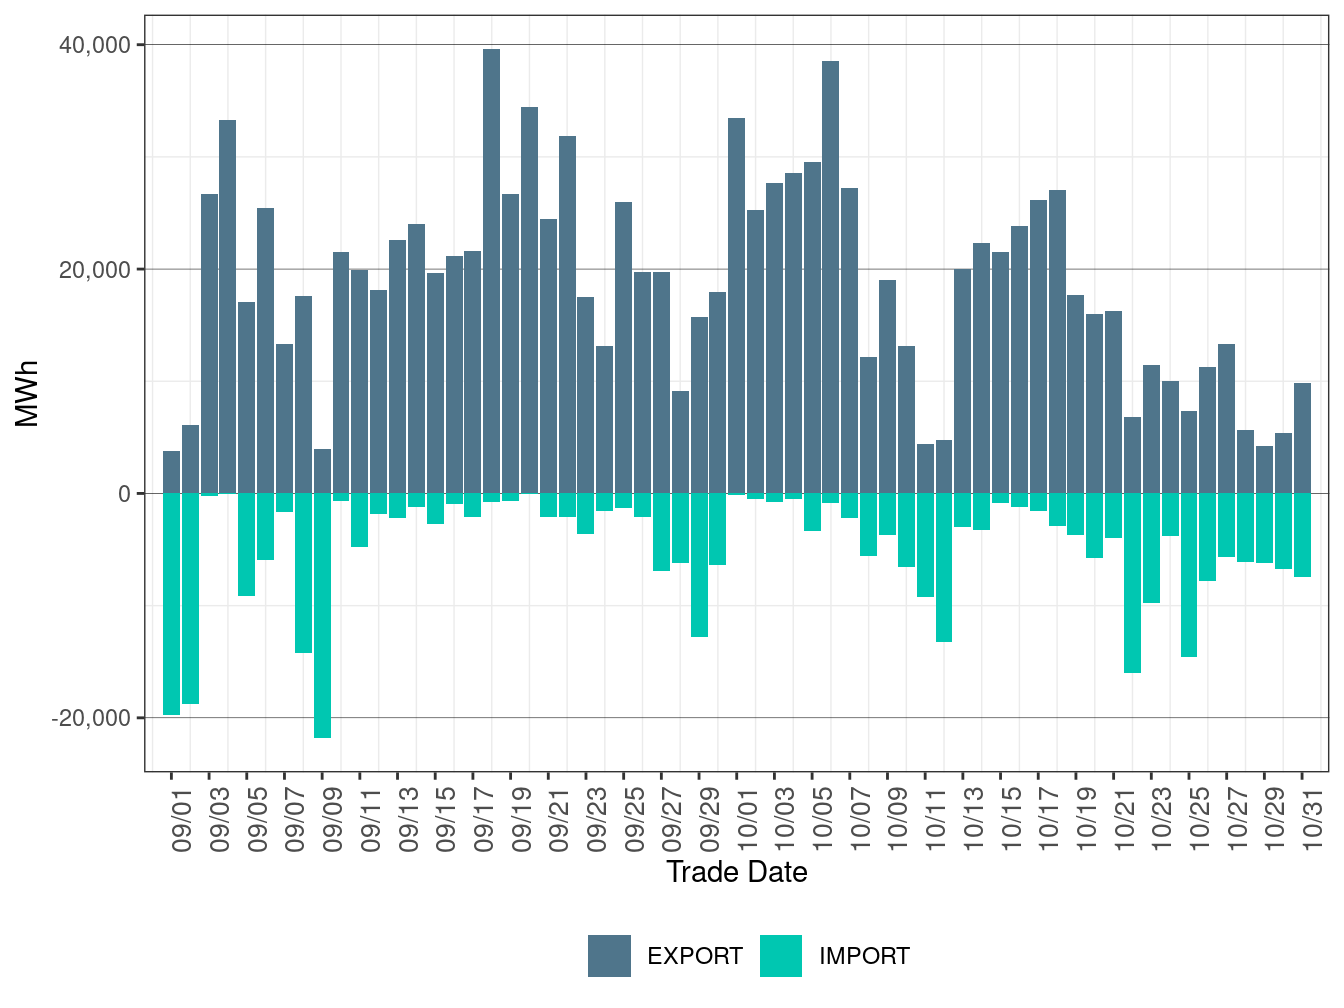
Figure 8.14: EIM Transfer for PSEI in FMM
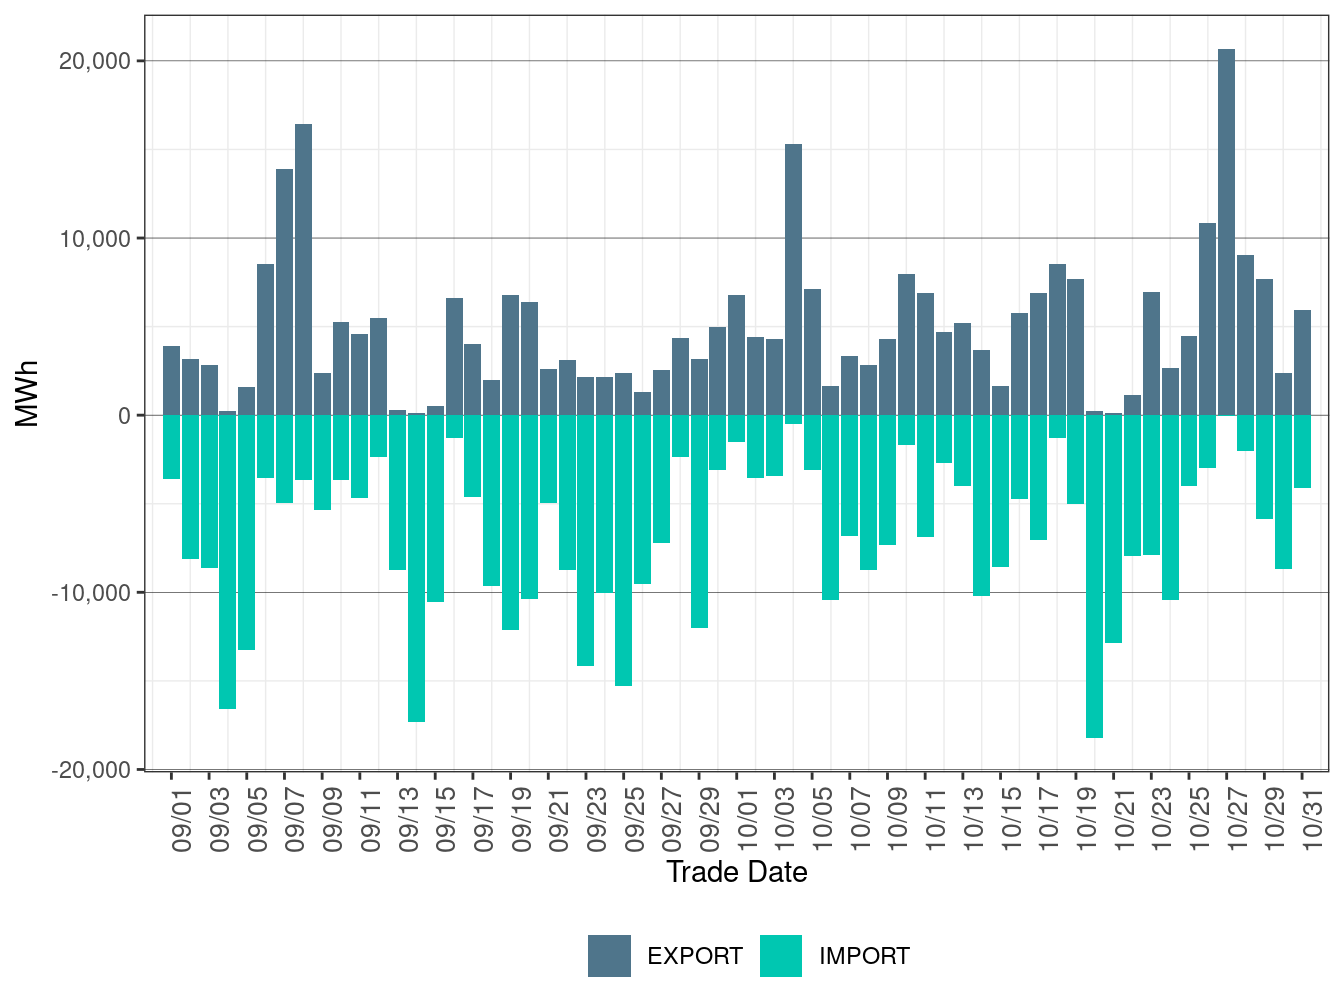
Figure 8.15: EIM Transfer for PGE in FMM
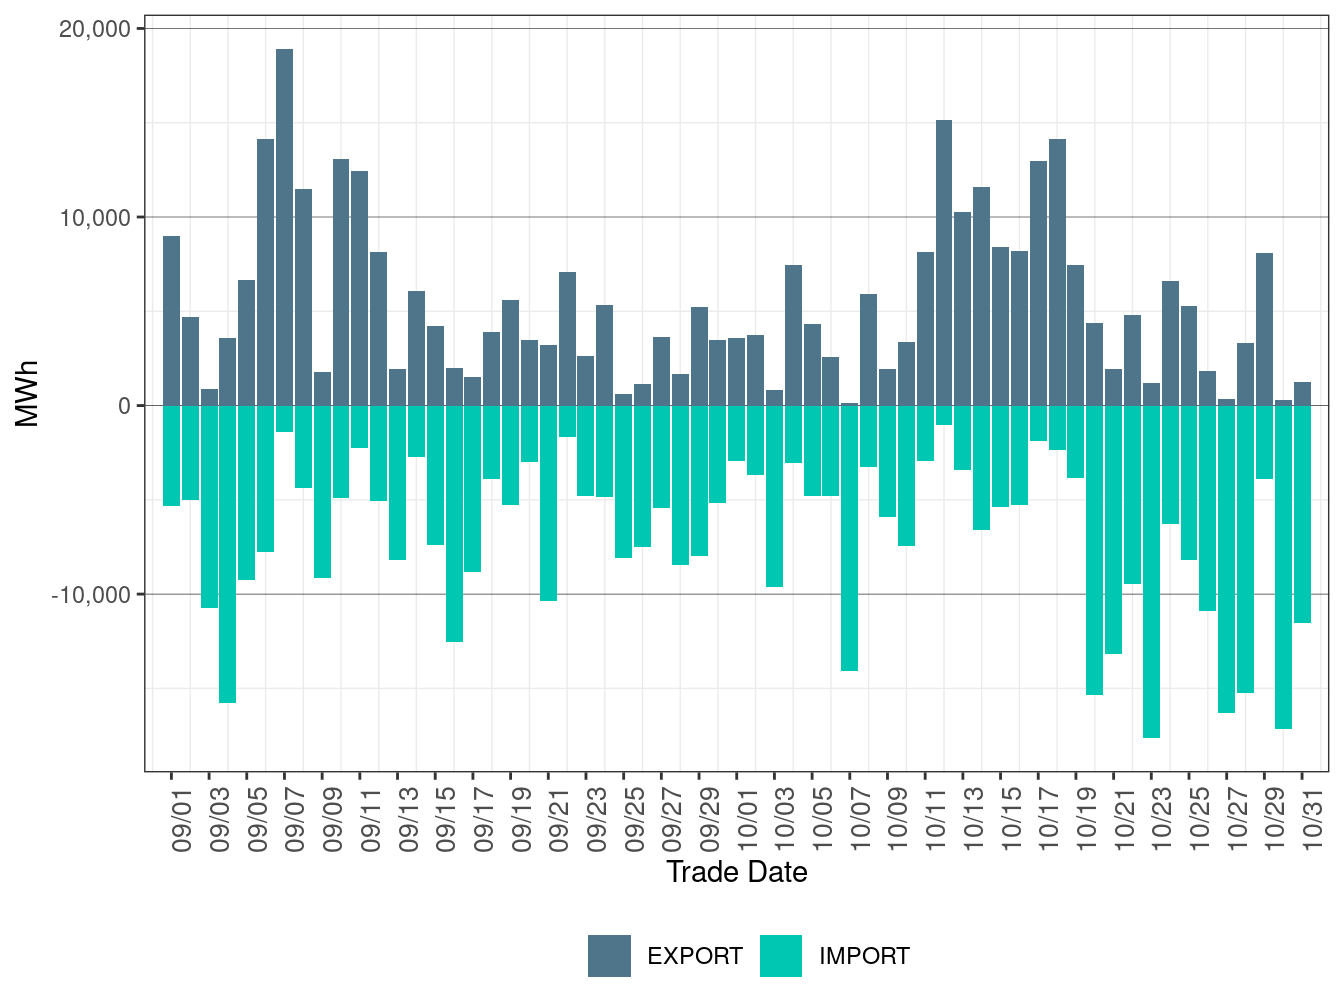
Figure 8.16: EIM Transfer for BCHA in FMM
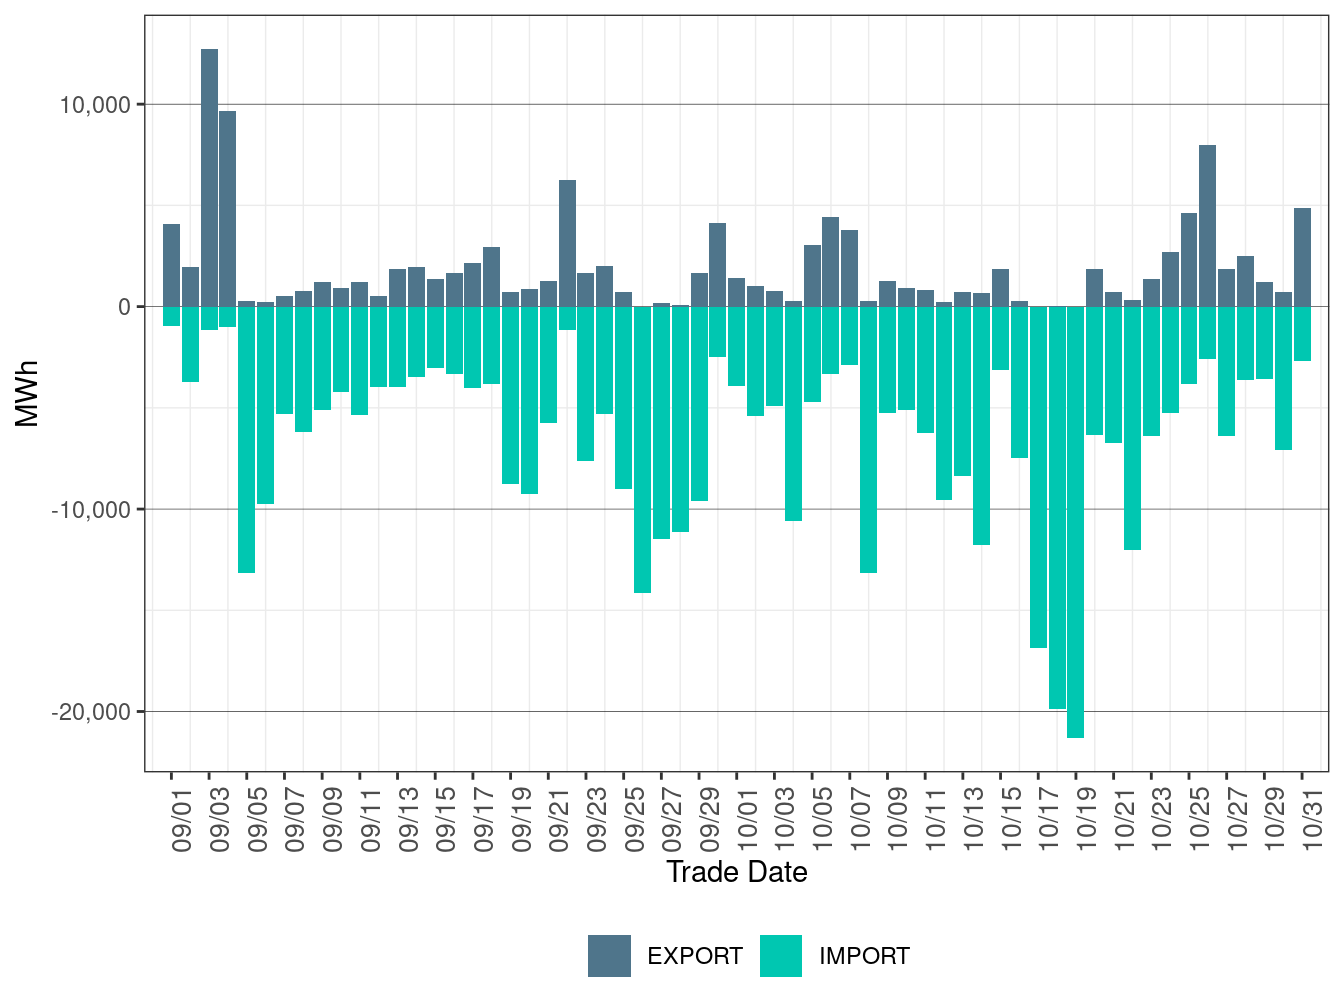
Figure 8.17: EIM Transfer for IPCO in FMM
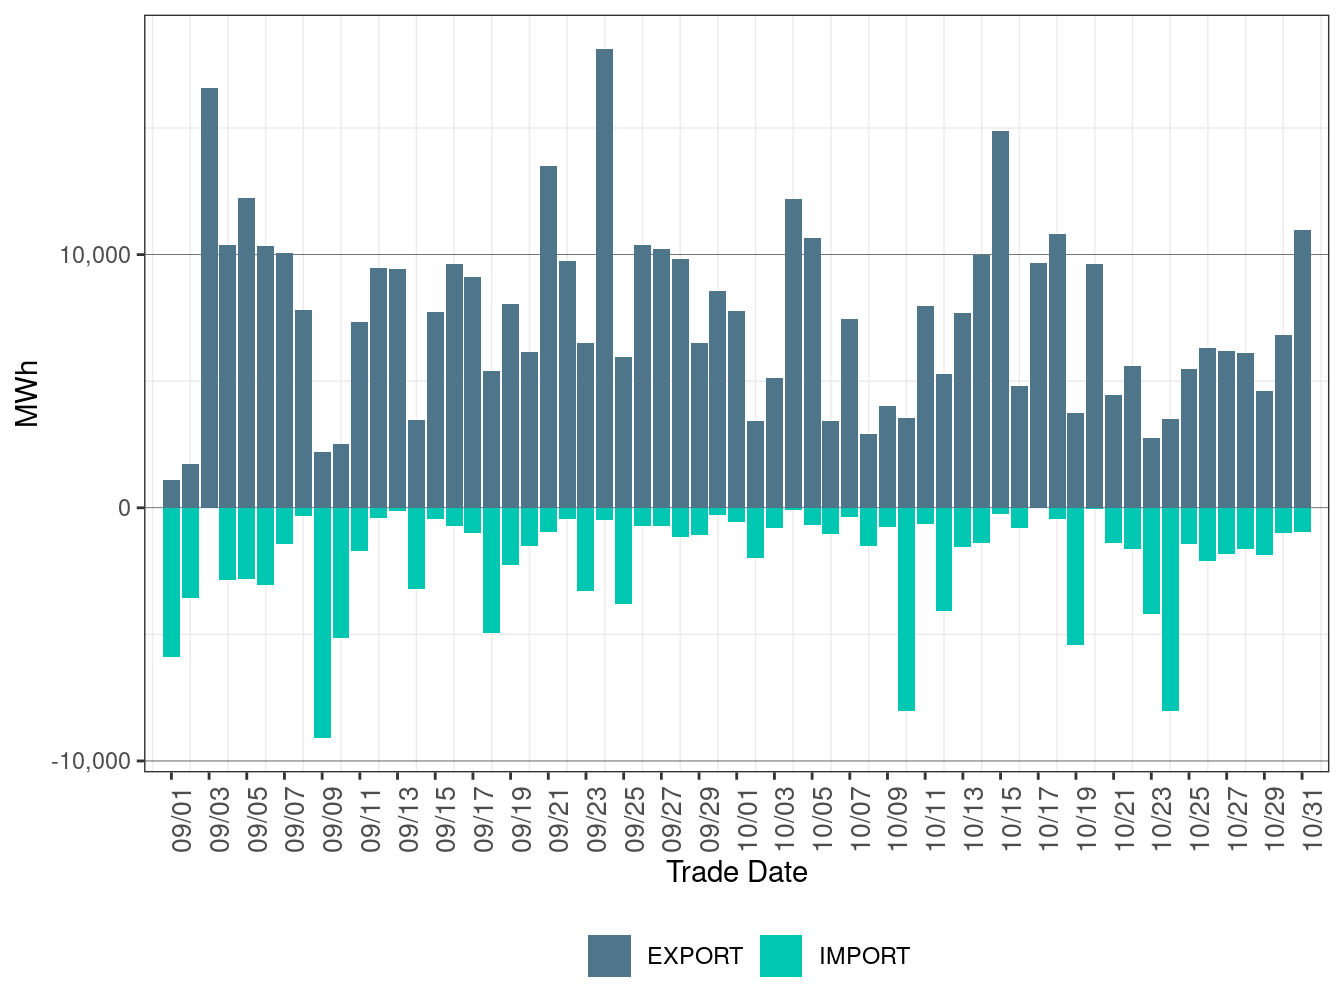
Figure 8.18: EIM Transfer for BANCSMUD in FMM
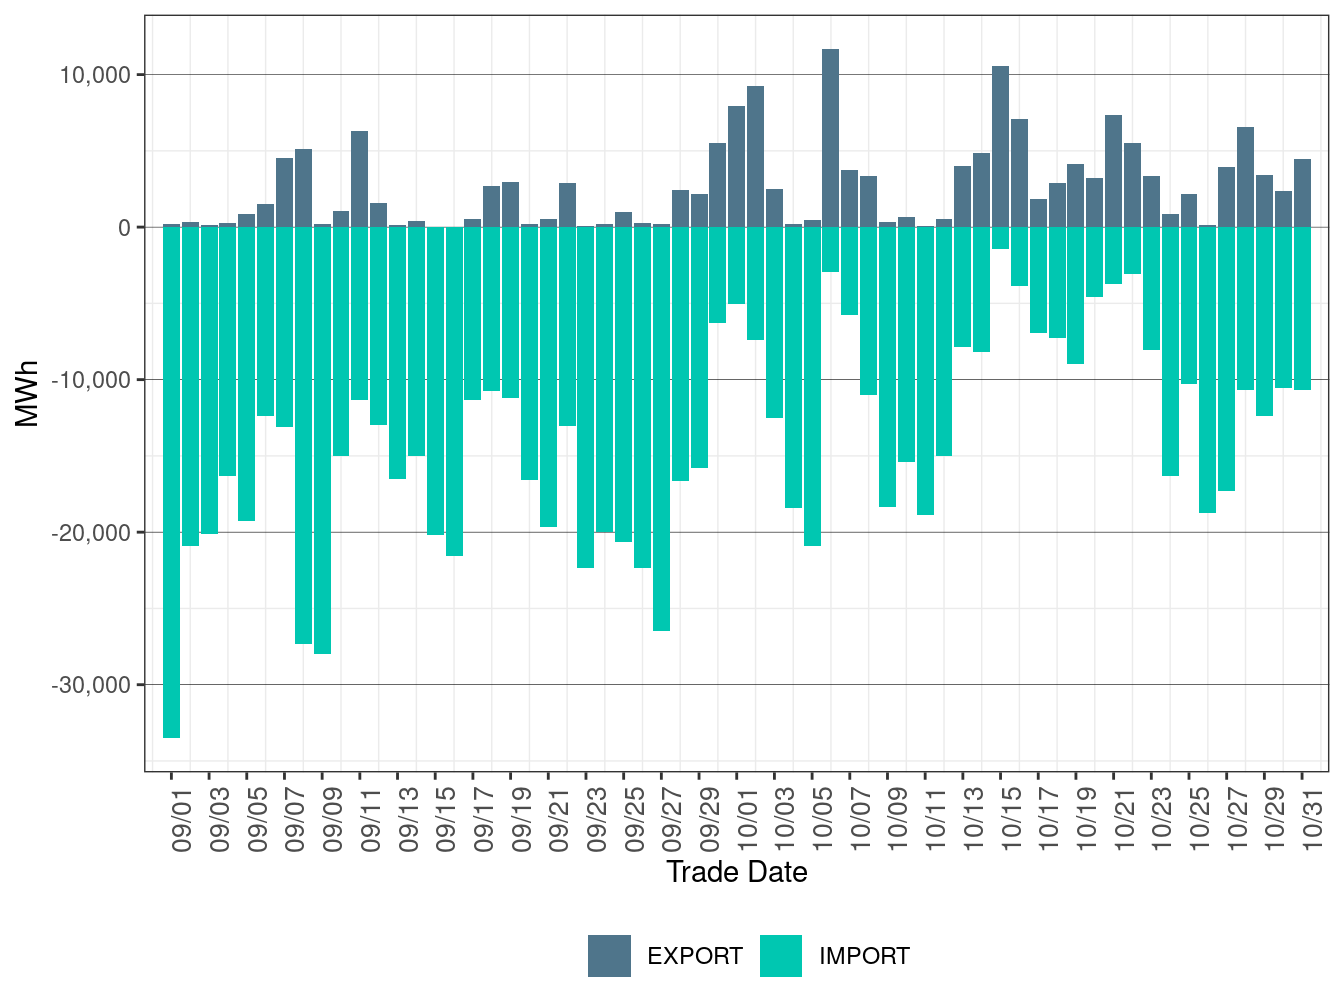
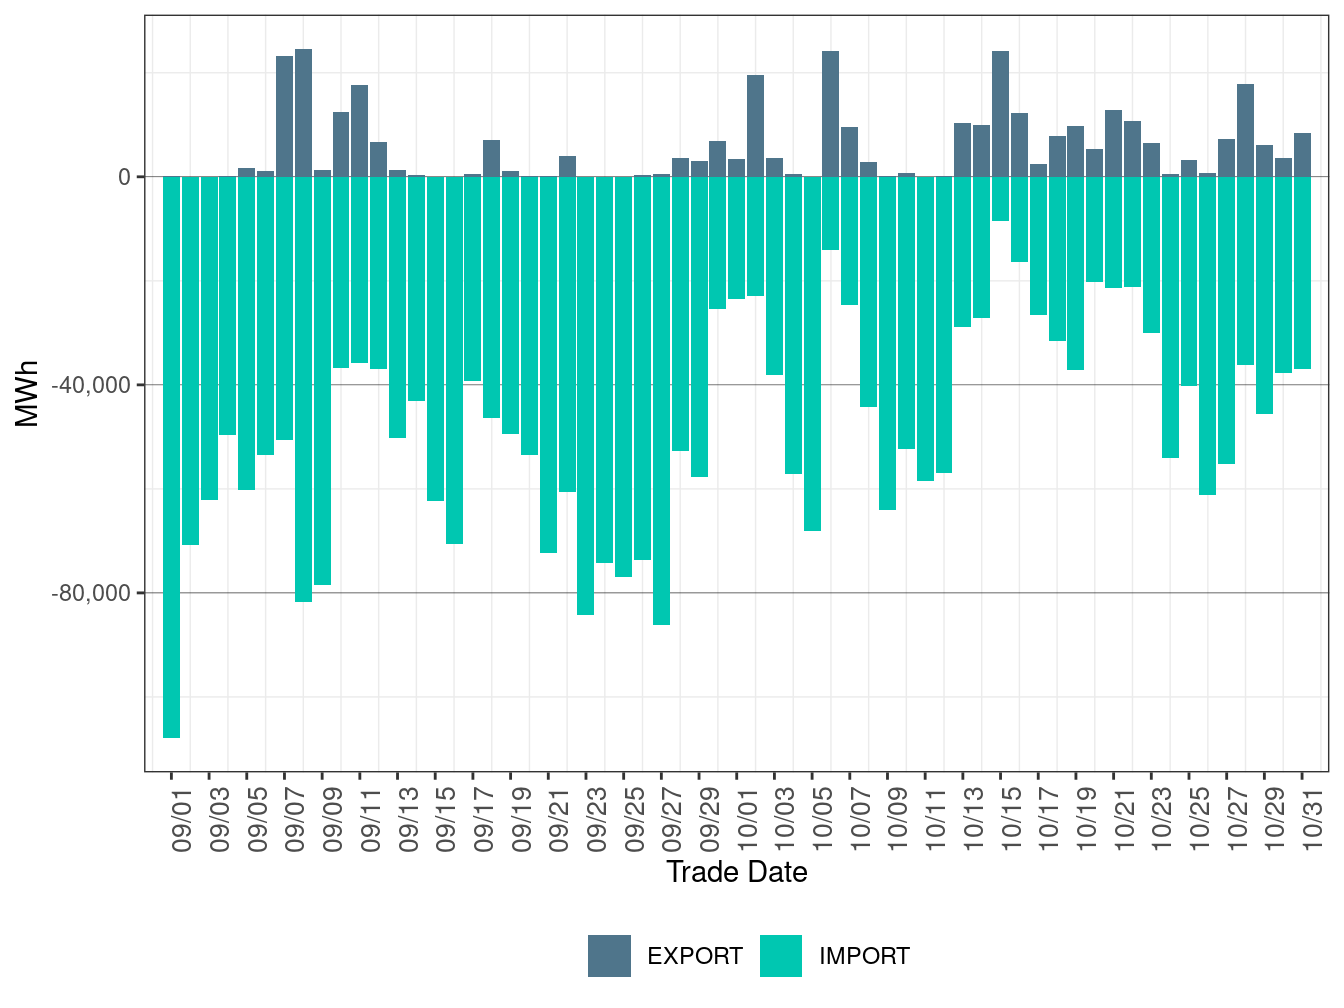
Figure 8.19 shows the daily volume of EIM transfer for CAISO in RTD. Figure 8.20 shows the daily volume of EIM transfer for PACE. Figure 8.21 shows the daily volume of EIM transfer for PACW in RTD. Figure 8.22 shows the daily volume of EIM transfer for NEVP in RTD. Figure 8.23 shows the daily volume of EIM transfer for AZPS in RTD. Figure 8.24 shows the daily volume of EIM transfer for PSEI in RTD. Figure 8.25 shows the daily volume of EIM transfer for PGE in RTD. Figure 8.26 shows the daily volume of EIM transfer for BCHA in RTD. Figure 8.27 shows the daily volume of EIM transfer for IPCO in RTD. Figure 8.28 shows the daily volume of EIM transfer for BANCSMUD in RTD.
Figure 8.19: EIM Transfer for CAISO in RTD
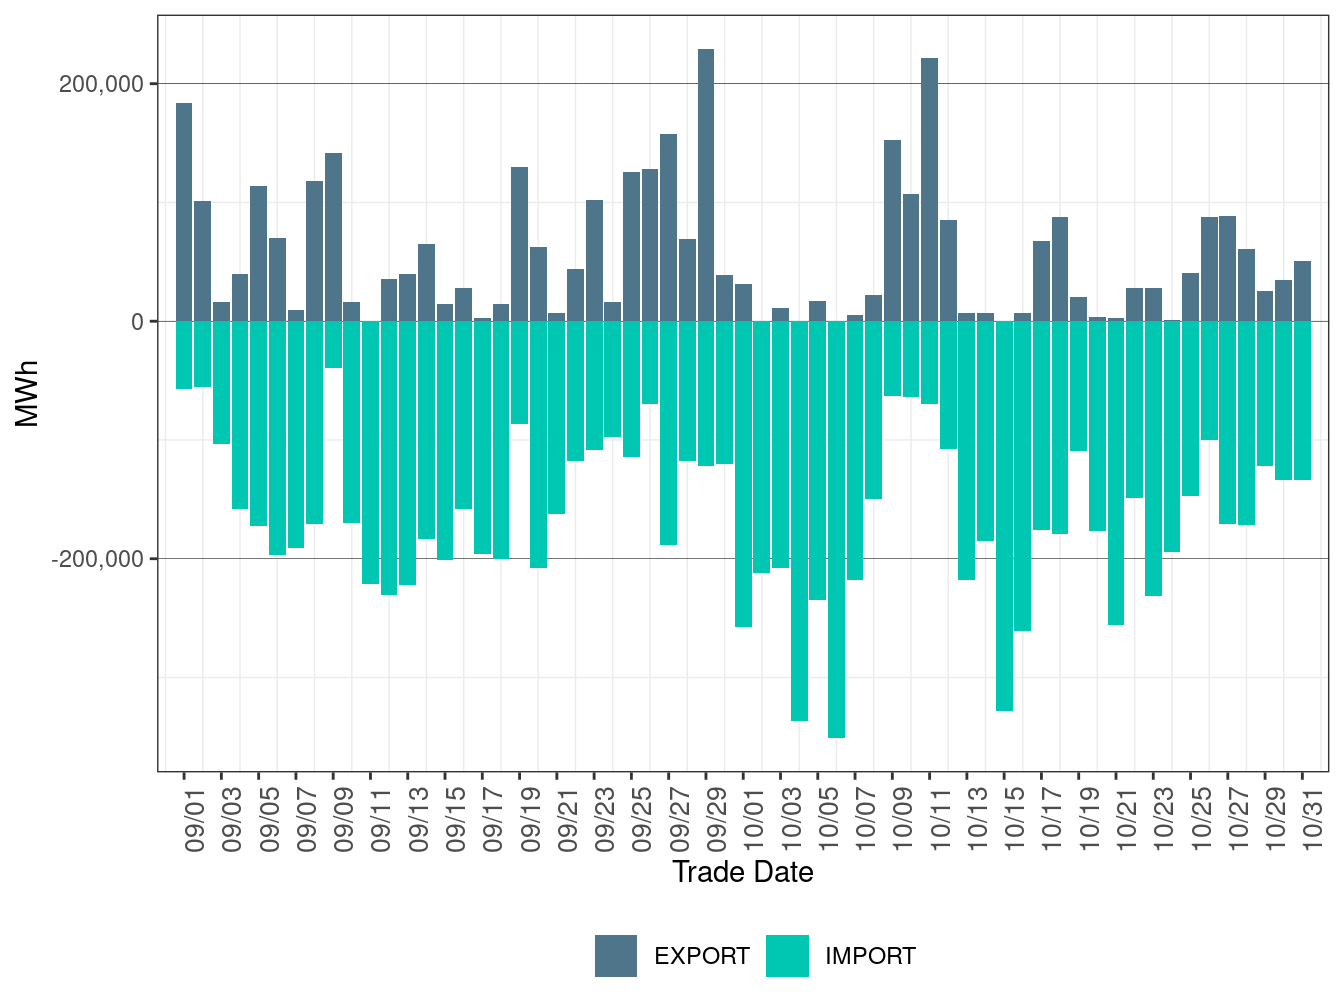
Figure 8.20: EIM Transfer for PACE in RTD

Figure 8.21: EIM Transfer for PACW in RTD
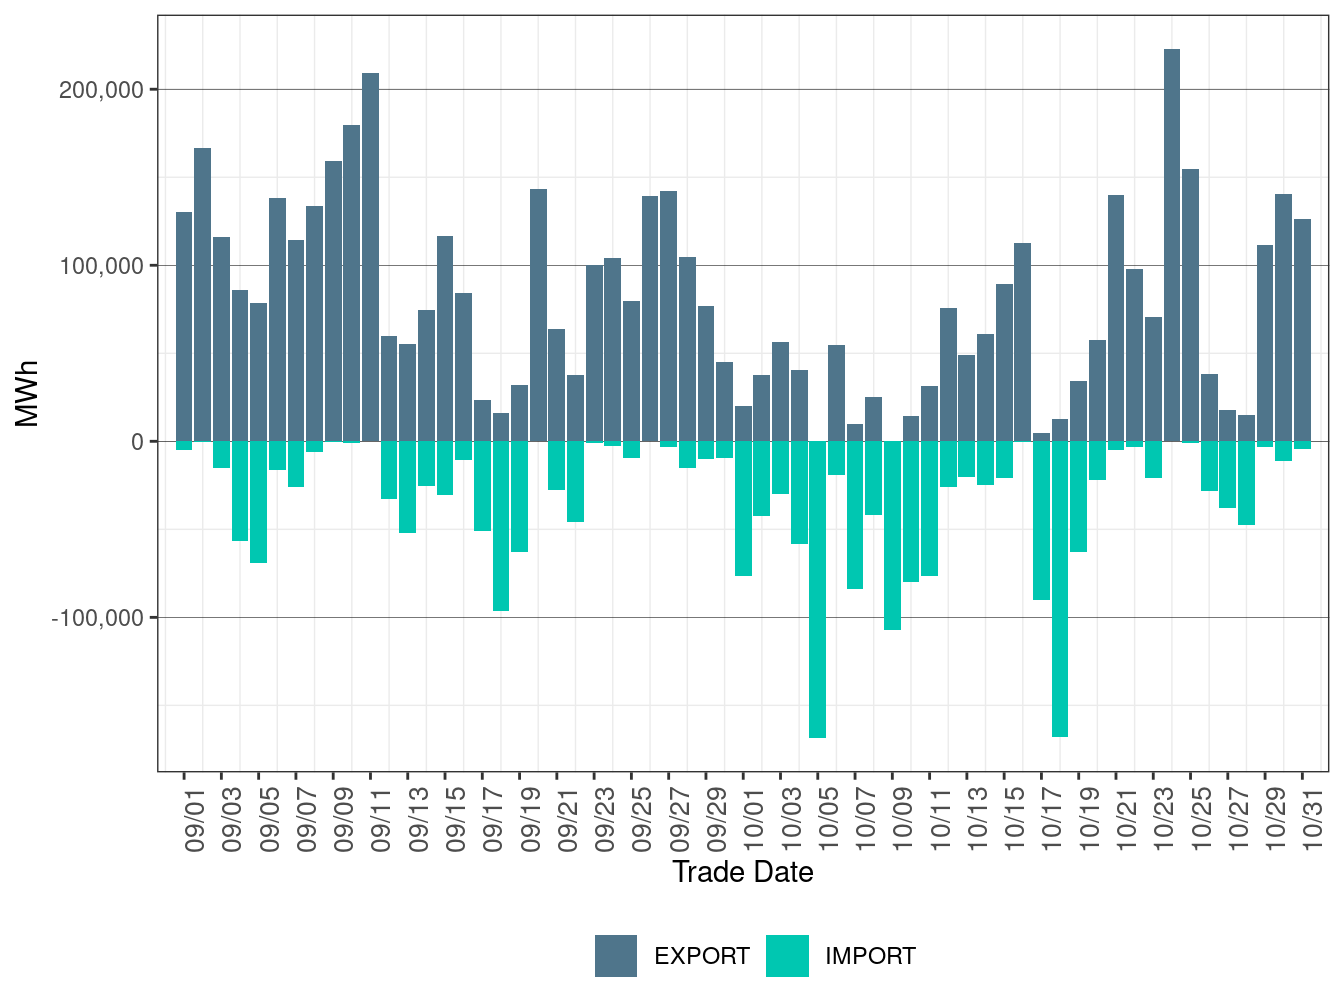
Figure 8.22: EIM Transfer for NEVP in RTD
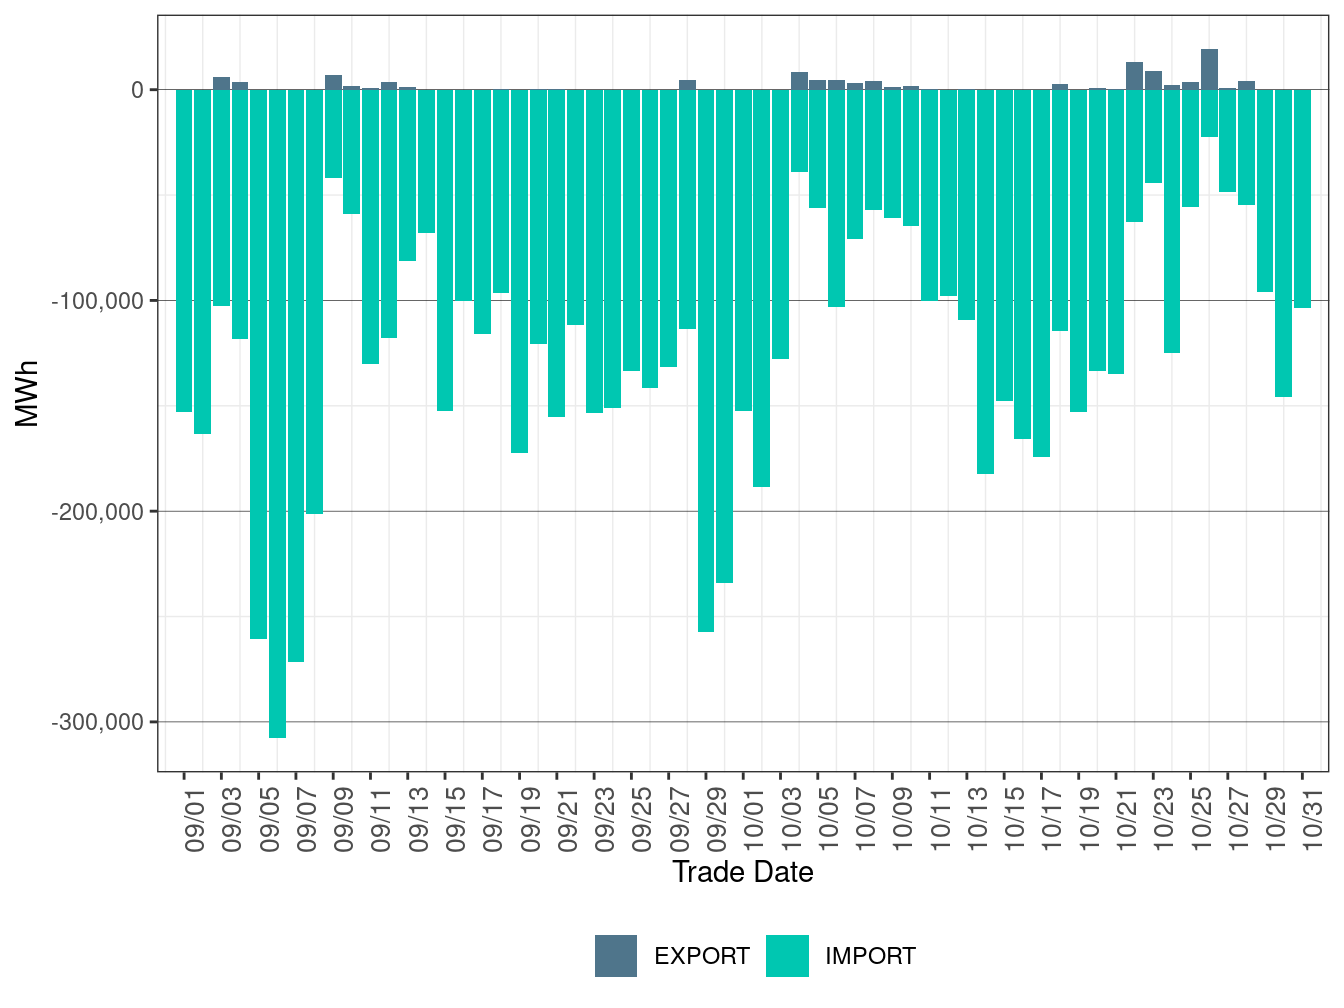
Figure 8.23: EIM Transfer for AZPS in RTD
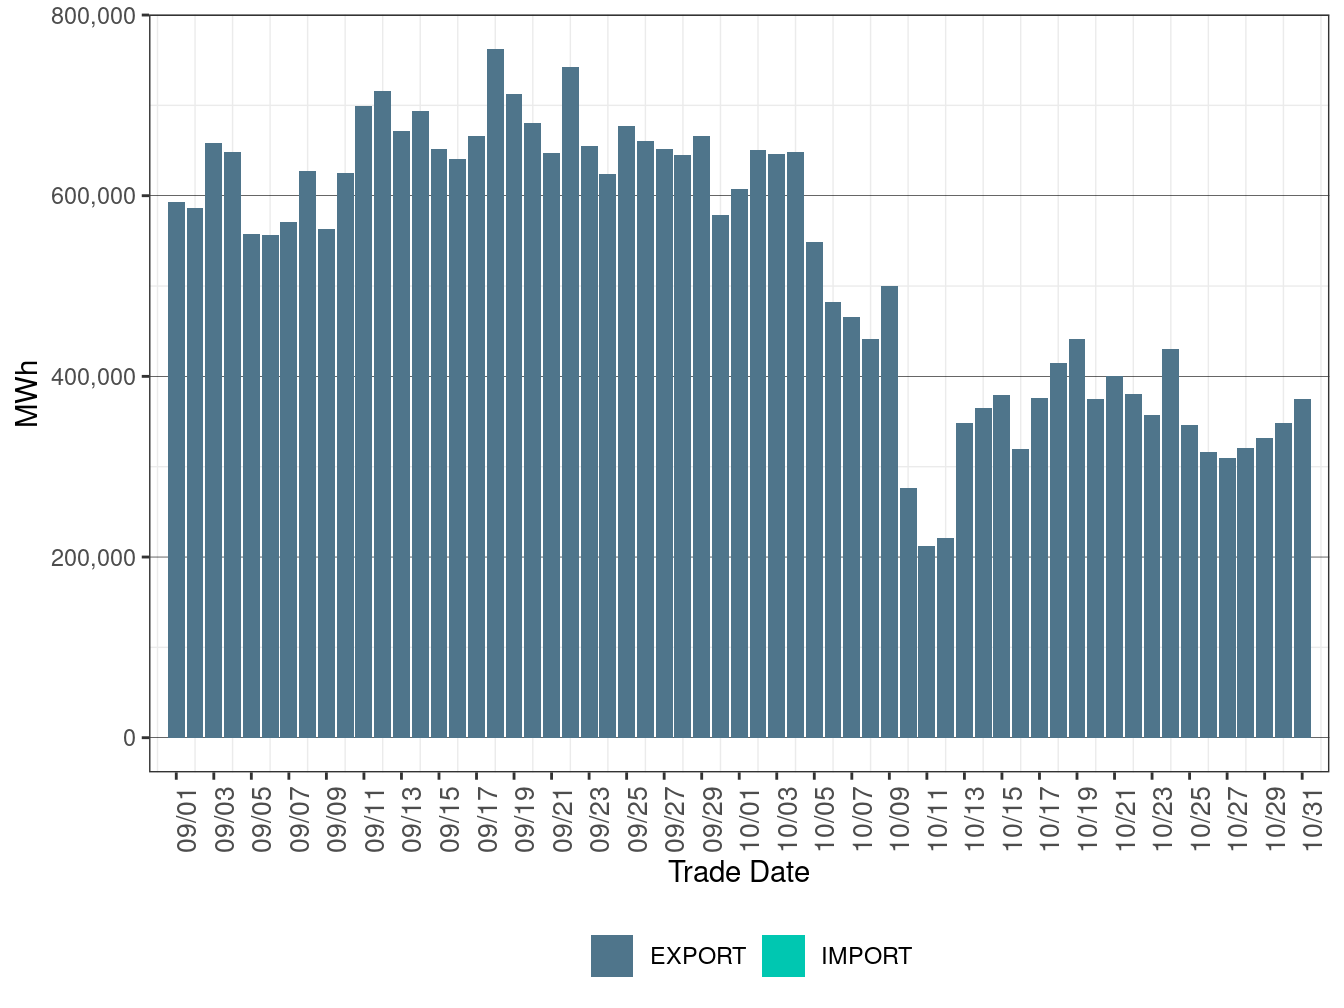
Figure 8.24: EIM Transfer for PSEI in RTD
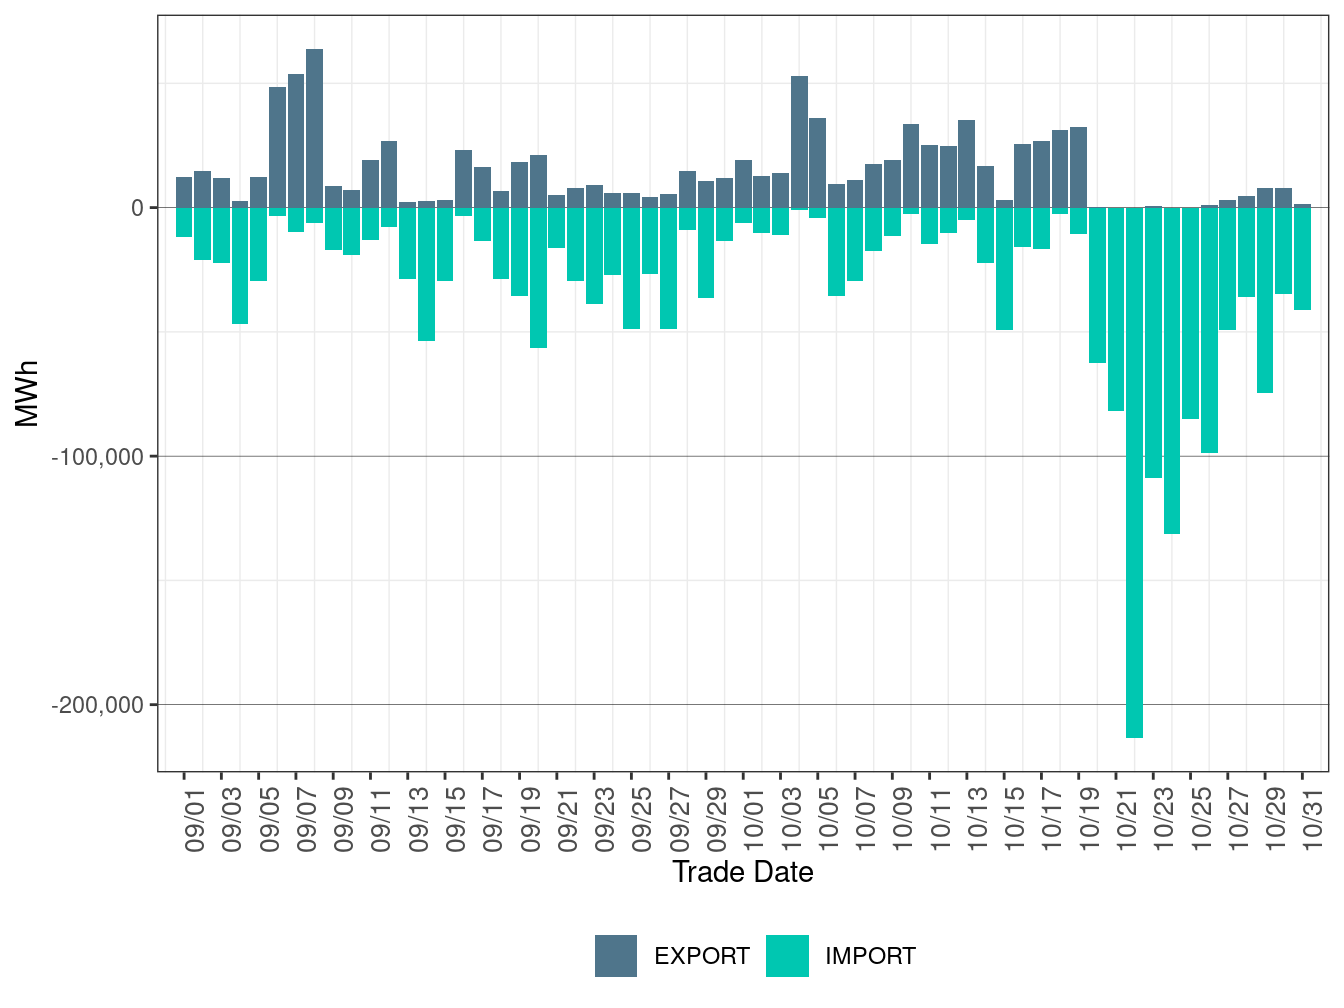
Figure 8.25: EIM Transfer for PGE in RTD
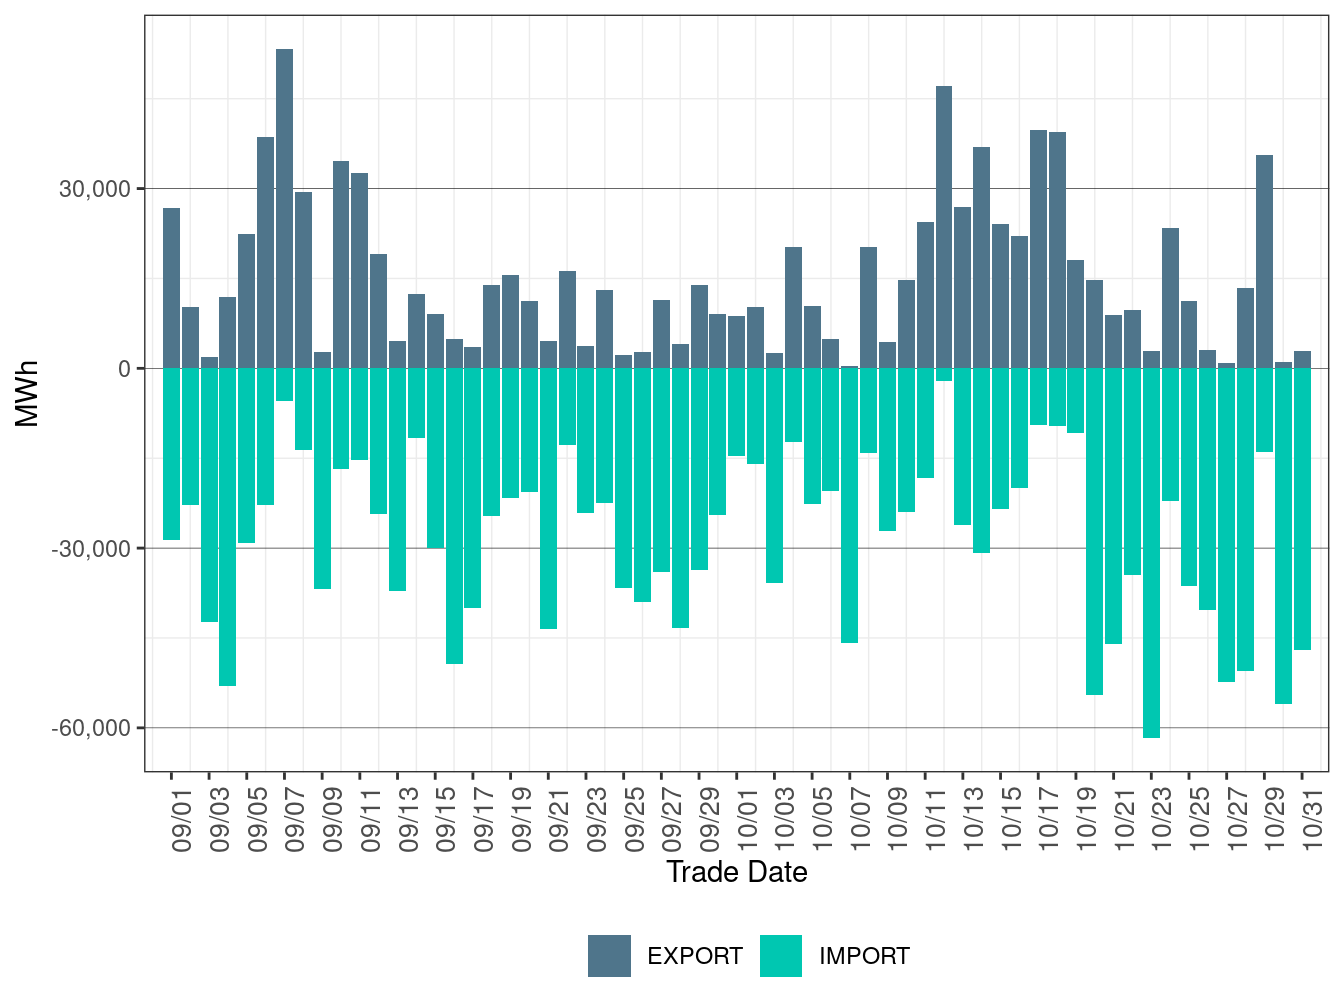
Figure 8.26: EIM Transfer for BCHA in RTD
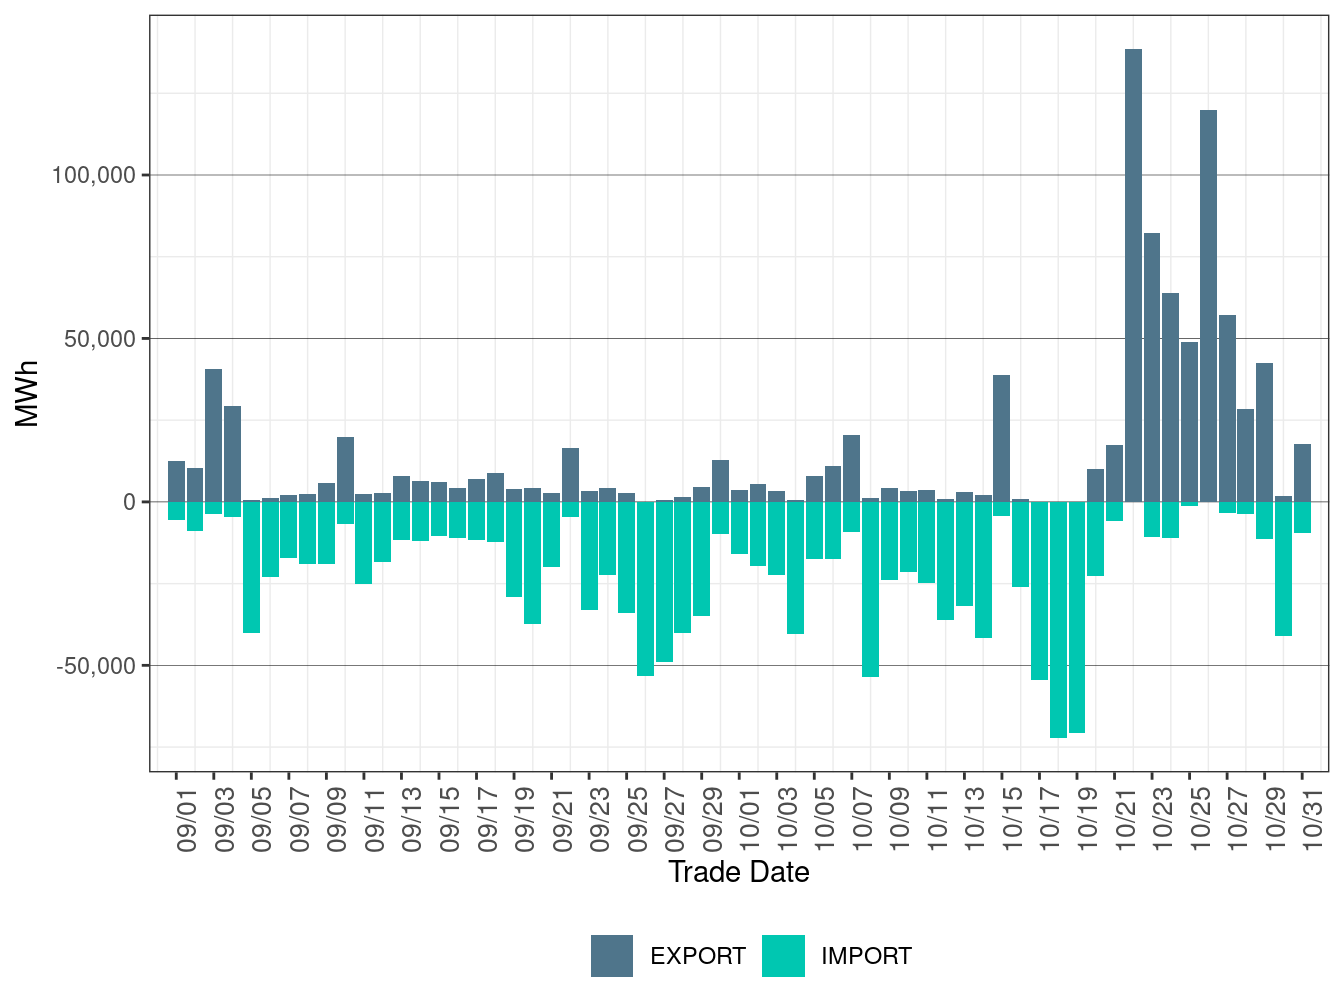
Figure 8.27: EIM Transfer for IPCO in RTD
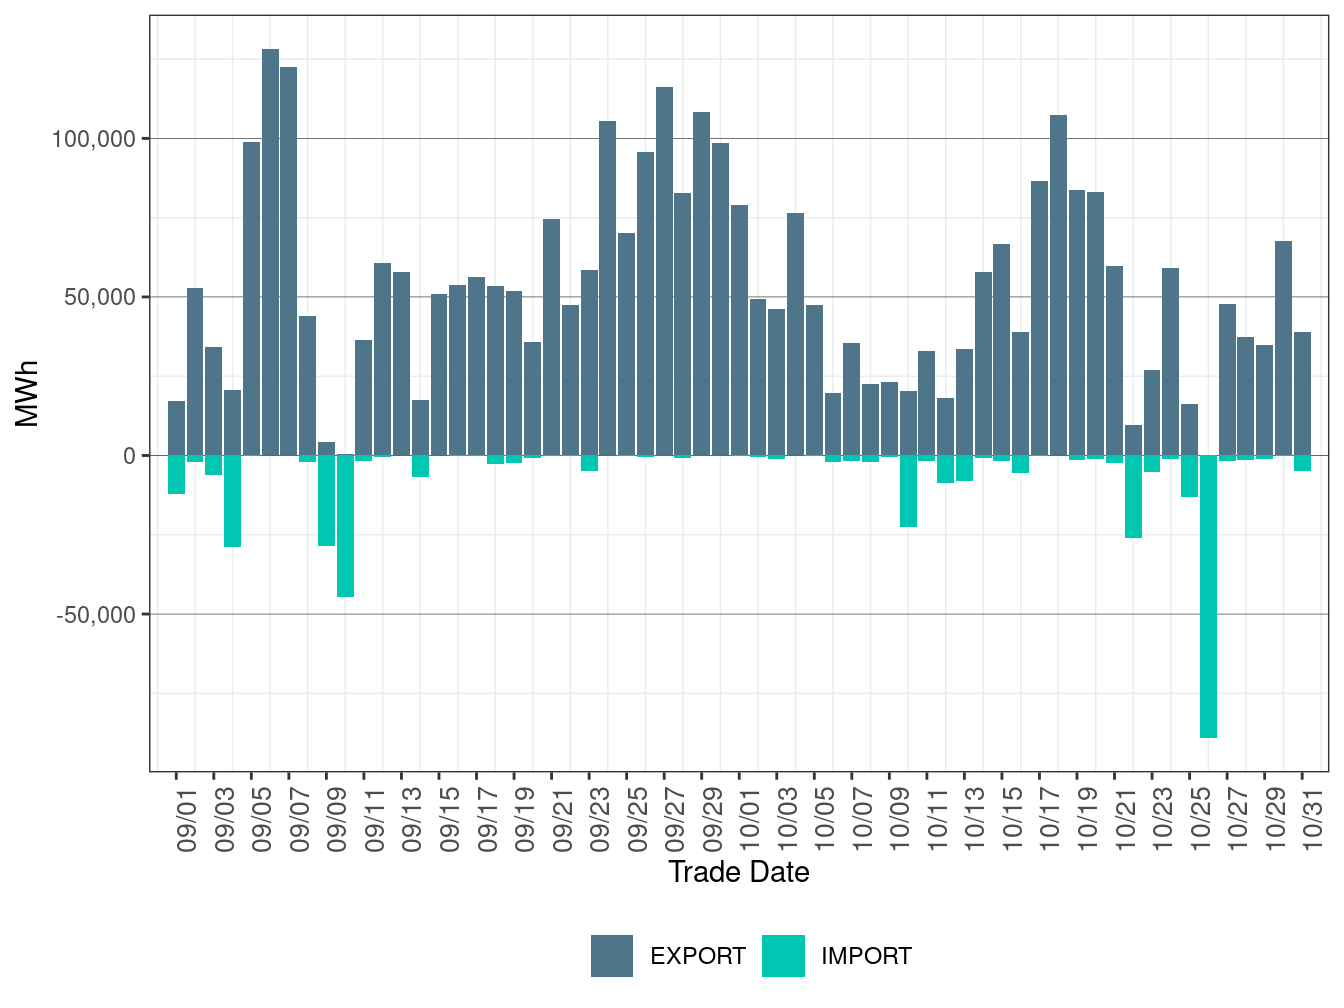
Figure 8.28: EIM Transfer for BANCSMUD in RTD
EIM Cost Allocation
Figure 8.29 shows daily real-time imbalance energy offset cost for PACE, PACW, NEVP, AZPS, PSEI, PGE, IPCO, BCHA, and BANCSMUD respectively. Total RTIEO in October decreased to -$5.68 million from -$4.41 million in September.
Figure 8.29: EIM Real-Time Imbalance Energy Offset by Area
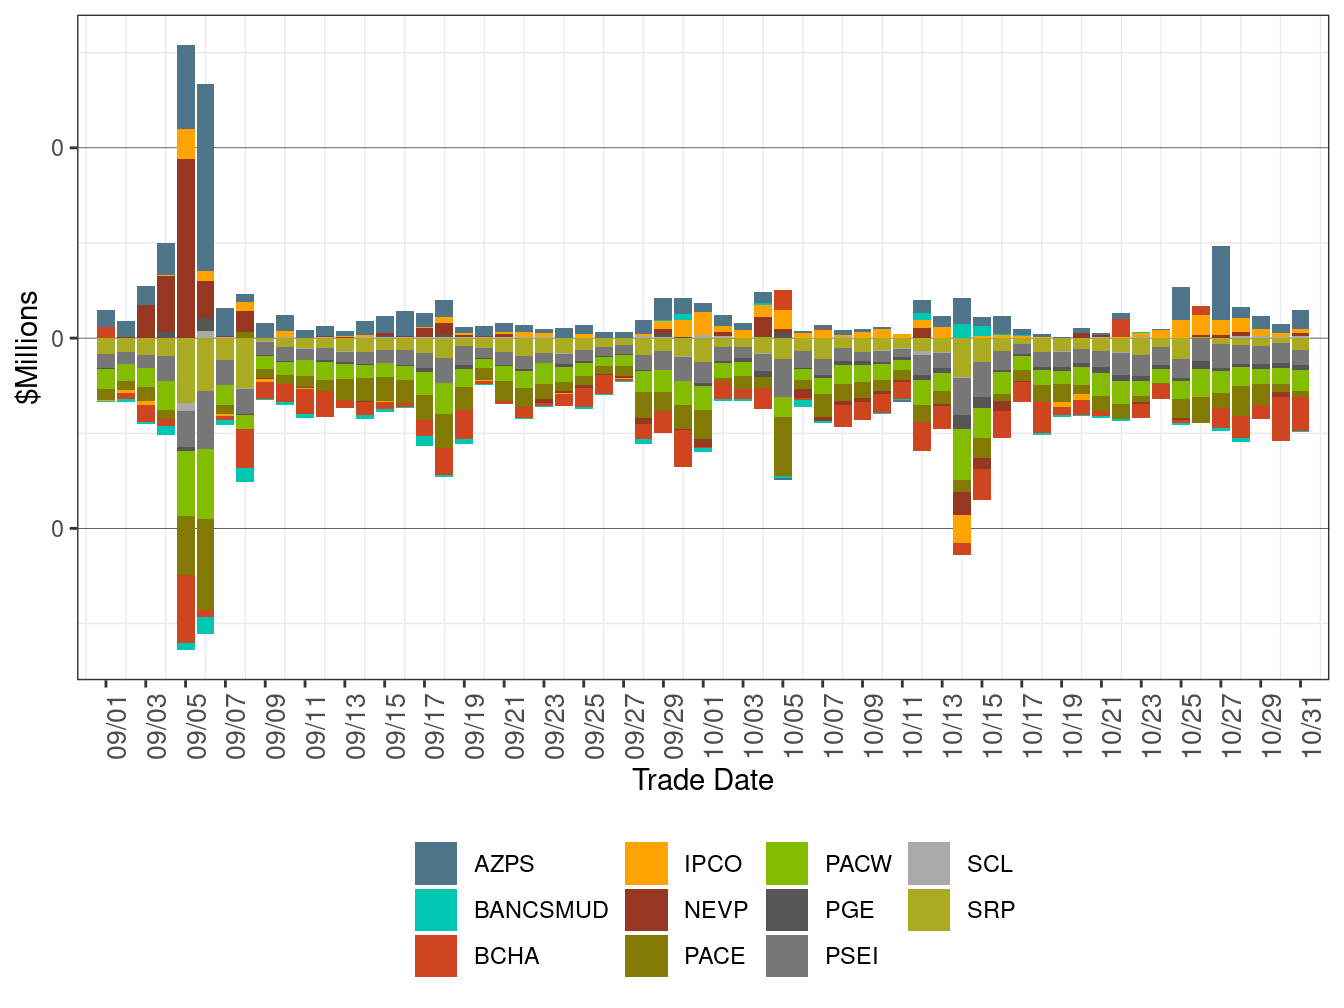
Figure 8.30 shows daily real-time congestion offset cost for PACE, PACW, NEVP, AZPS, PSEI, PGE, IPCO, BCHA, and BANCSMUD respectively. Total RTCO decreased to -$6.65 million in October from -$4.35 million in September.
Figure 8.30: EIM Real-Time Congestion Imbalance Offset by Area
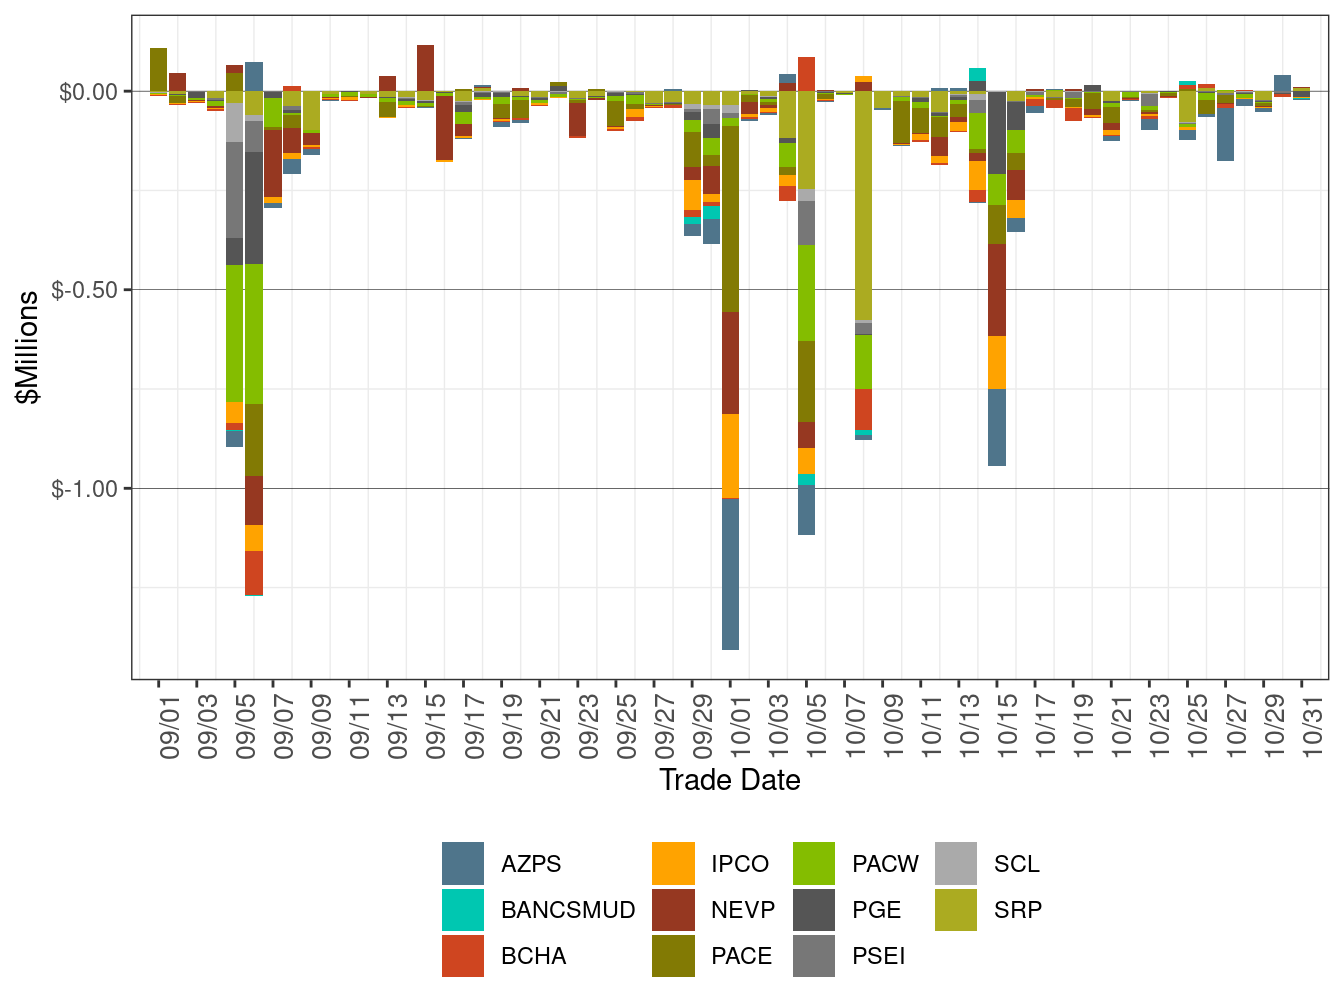
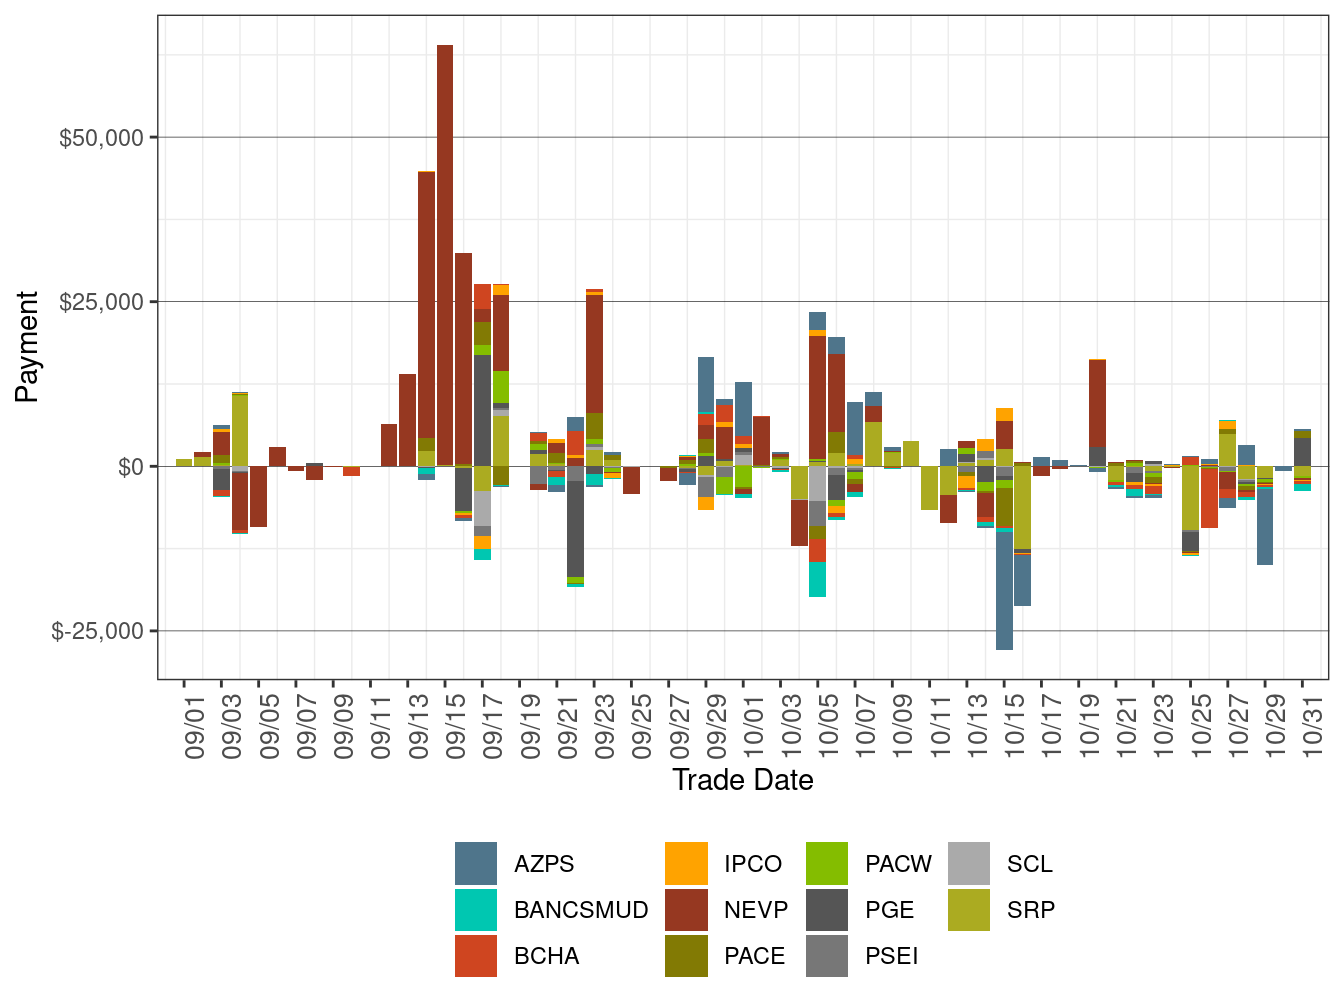
Figure 8.31 shows daily bid cost recovery for PACE, PACW, NEVP, AZPS, PSEI, PGE, IPCO, BCHA, and BANCSMUD respectively. Total BCR decreased to $0.40 million in October from $0.56 million in September.
Figure 8.31: EIM Bid Cost Recovery by Area
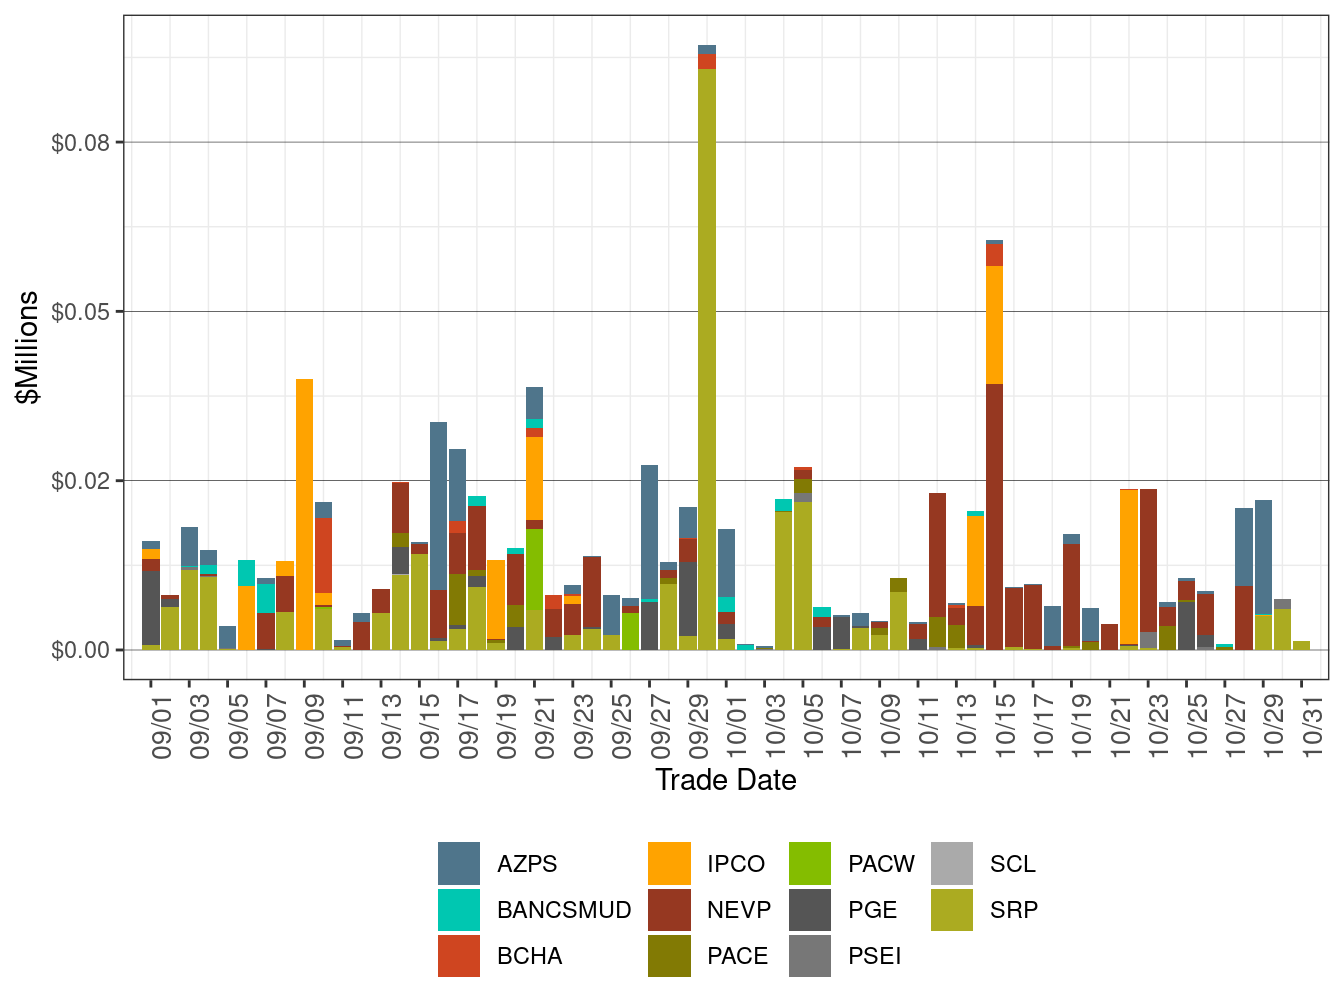
Figure 8.32 shows the flexible ramping up uncertainty payment PACE, PACW, NEVP, AZPS, PSEI, PGE, IPCO BCHA, and BANCSMUD respectively. Total flexible ramping up uncertainty payment in October inched down to $0.15 million from $0.24 million in September. Figure 8.33 shows the flexible ramping down uncertainty payment PACE, PACW, NEVP, AZPS, PSEI, PGE, IPCO BCHA, BANCSMUD respectively. Total flexible ramping down uncertainty payment in October increased to $4,314 from -$4,639 in September. Figure 8.34 shows the flexible ramping forecast payment PACE, PACW, NEVP, AZPS, PSEI, PGE, IPCO, BCHA, and BANCSMUD respectively. Total forecast payment in October fell to -$20,101 from $220,411 in September.
Figure 8.32: Flexible Ramping Up Uncertainty Payment
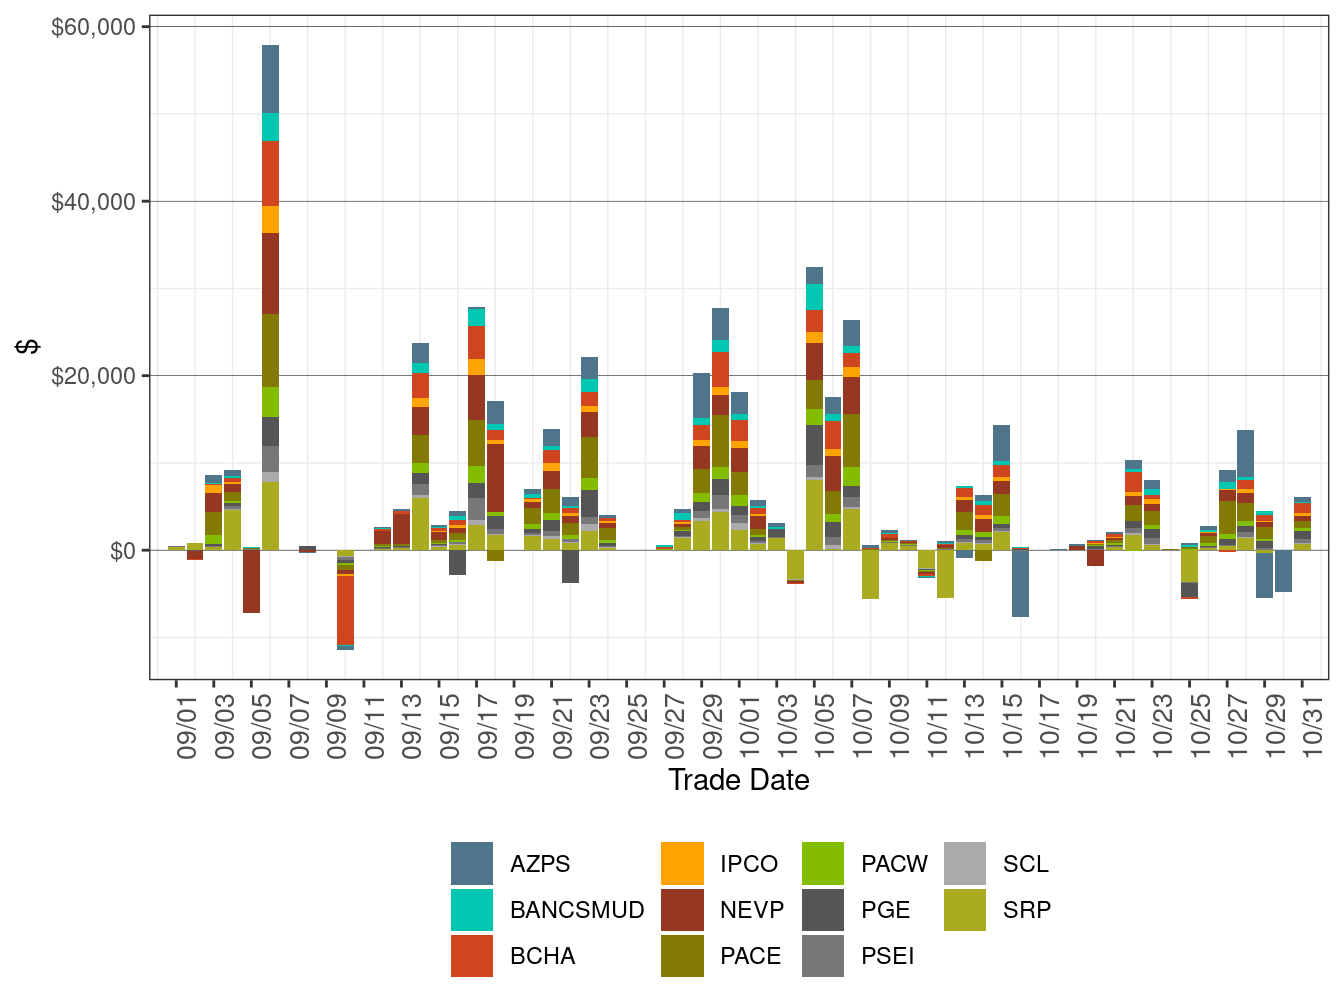
Figure 8.33: Flexible Ramping Down Uncertainty Payment
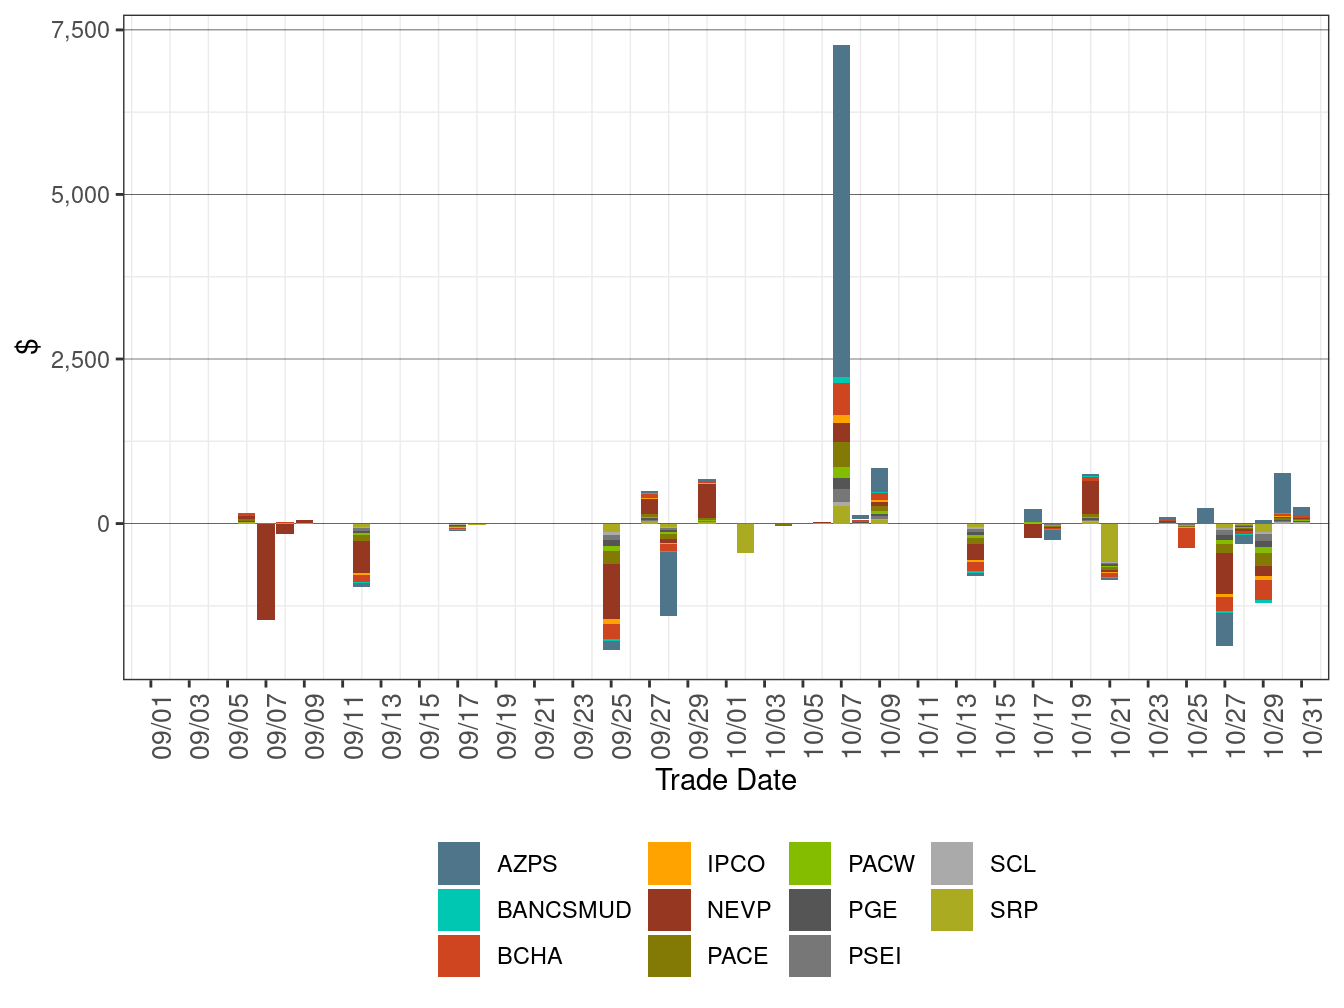
Figure 8.34: Flexible Ramping Forecast Payment
The ISO’s Energy Imbalance Market Business Practice Manual describes the methodology for determining whether an EIM participating resource is dispatched to support transfers to serve California load. The methodology ensures that the dispatch considers the combined energy and associated marginal greenhouse gas (GHG) compliance cost based on submitted bids. The EIM dispatches to support transfers into the ISO were documented in Figure 8.35 and TABLE 8.1 below.
Figure 8.35: EIM Transfer into ISO by Fuel Type
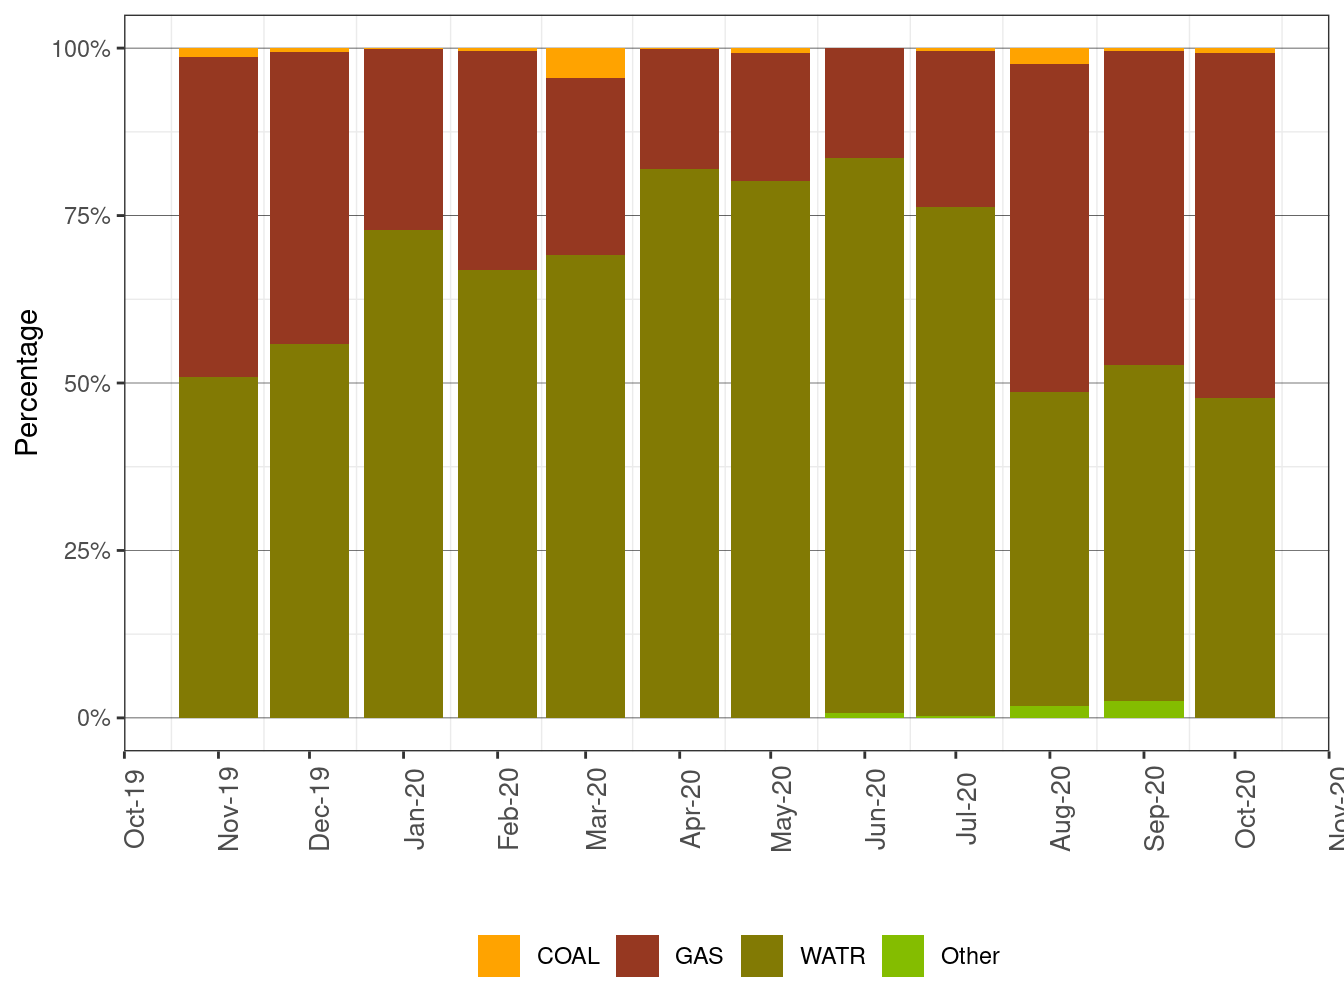
| Month-Year | Coal (%) | Gas (%) | Water (%) | Other Non-Emitting (%) |
|---|---|---|---|---|
| Apr-2020 | 0.2% | 17.8% | 82.0% | 0 |
| Aug-2020 | 2.3% | 49.0% | 47.0% | 1.7% |
| Dec-2019 | 0.5% | 43.7% | 55.8% | 0.0% |
| Feb-2020 | 0.4% | 32.8% | 66.8% | 0 |
| Jan-2020 | 0.2% | 27.0% | 72.8% | 0.0% |
| Jul-2020 | 0.4% | 23.3% | 75.9% | 0.3% |
| Jun-2020 | 0.0% | 16.3% | 82.9% | 0.7% |
| Mar-2020 | 4.4% | 26.5% | 69.1% | 0.0% |
| May-2020 | 0.7% | 19.1% | 80.2% | 0 |
| Nov-2019 | 1.4% | 47.7% | 50.9% | 0.0% |
| Oct-2020 | 0.8% | 51.5% | 47.7% | 0 |
| Sep-2020 | 0.4% | 46.9% | 50.1% | 2.6% |