13 Market Performance Metrics
Day-Ahead Prices
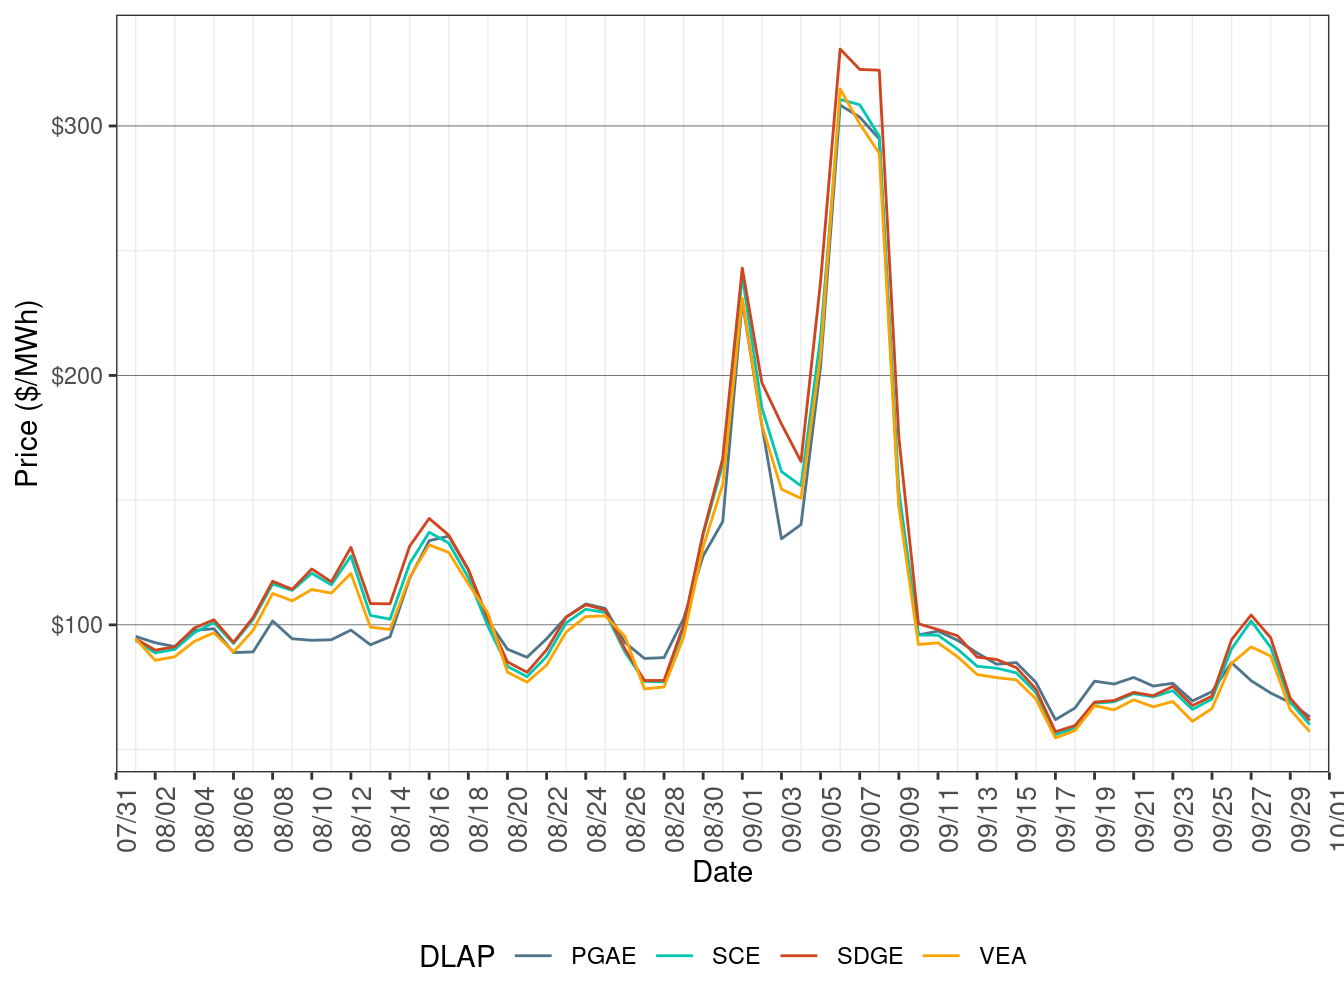
Figure 89, Figure 90 and Figure 91 show the daily simple average load-aggregation points (LAP) prices for each of the four default LAPs (PG&E, SCE, SDG&E, and VEA) for peak hours, off-peak hours, and all hours respectively in the day-ahead market.
Figure 89: Day-Ahead Simple Average LAP Prices (On-Peak Hours)
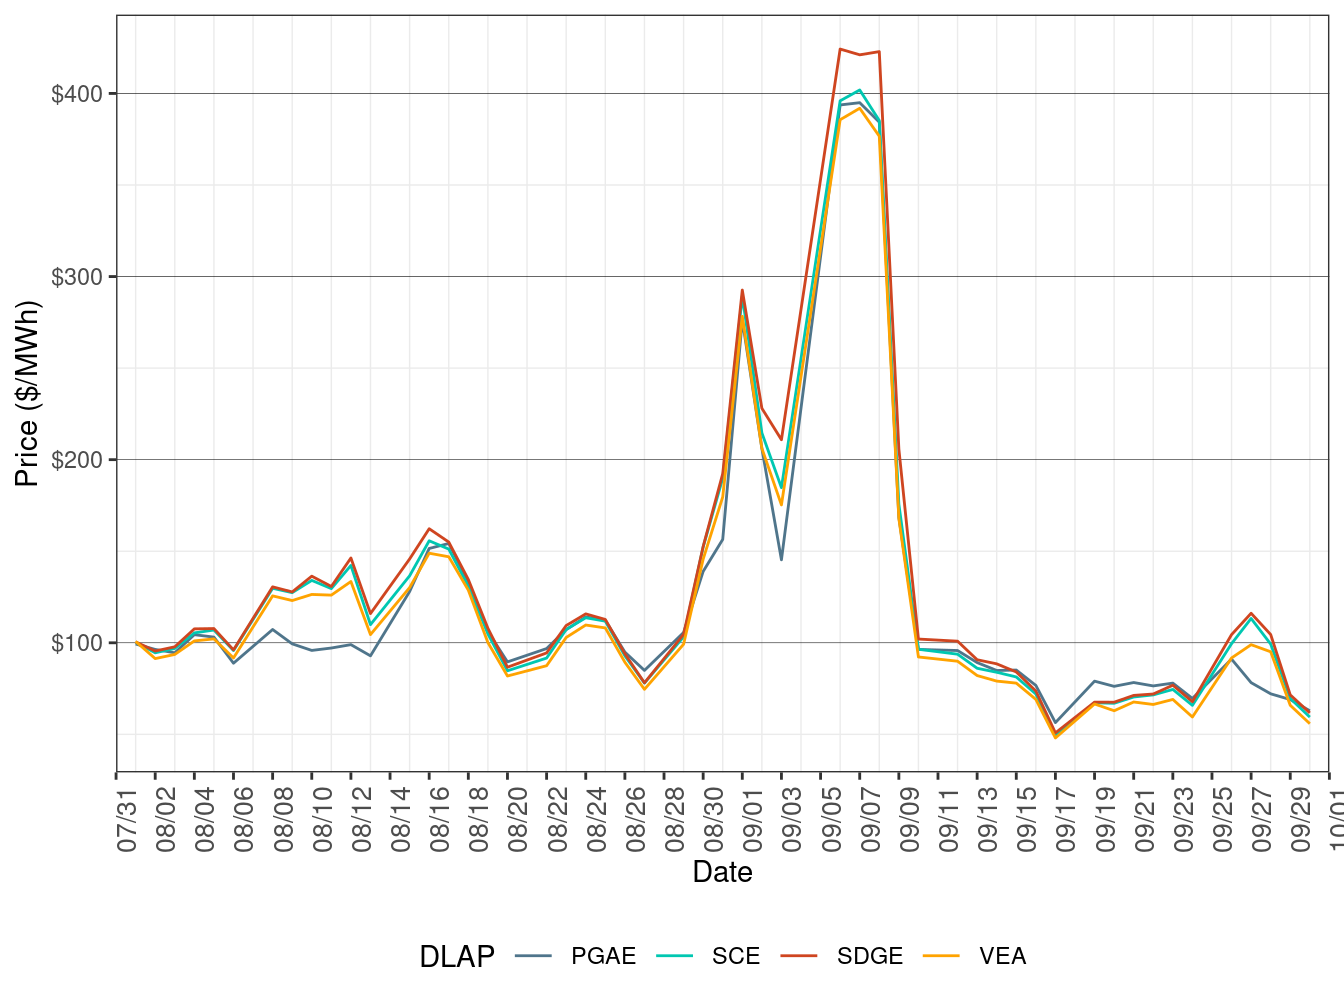
Figure 90: Day-Ahead Simple Average LAP Prices (Off-Peak Hours)
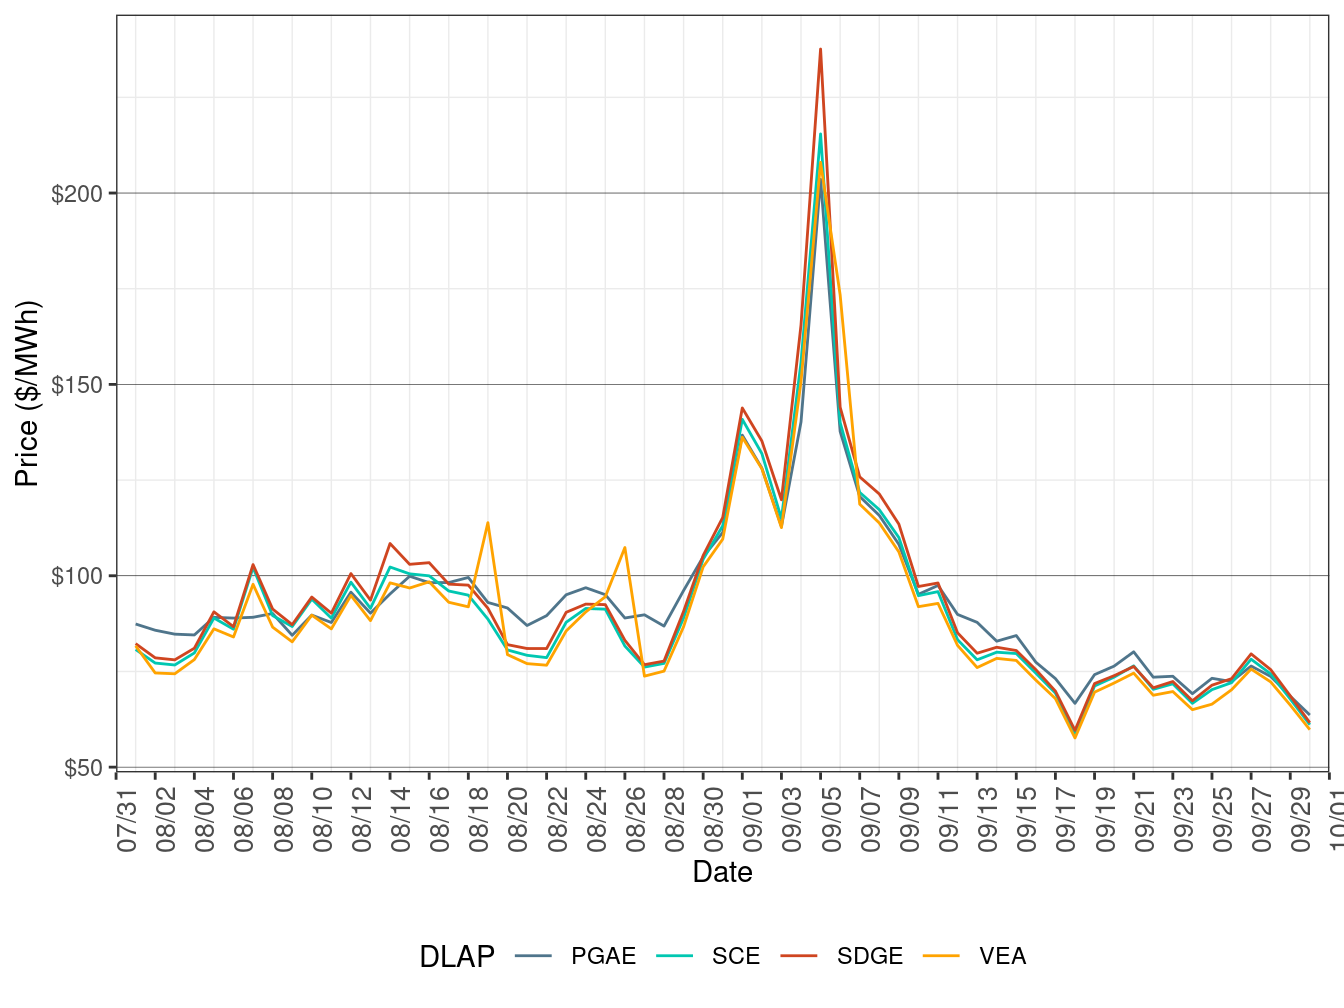
Figure 91: Day-Ahead Simple Average LAP Prices (All Hours)
Real-Time Prices
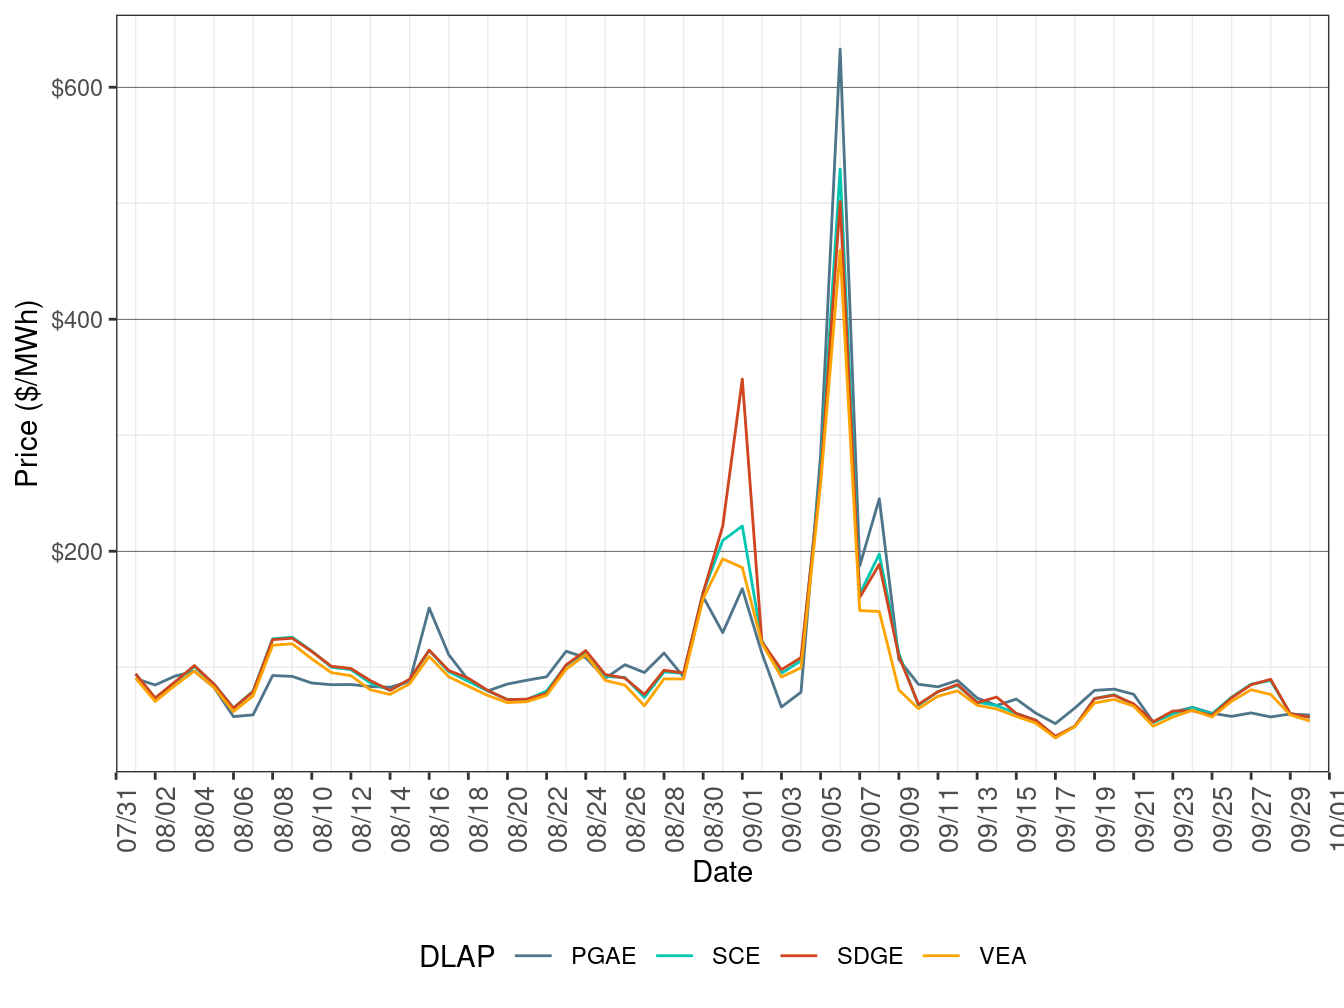
Figure 92, Figure 93 and Figure 94 show daily simple average LAP prices for all the default LAPs for peak hours, off-peak hours, and all hours respectively in FMM. Figure 95, Figure 96 and Figure 97 show daily simple average LAP prices for each of the four default LAPs for peak hours, off-peak hours, and all hours respectively in RTD.
Figure 92: FMM Simple Average LAP Prices (On-Peak Hours)
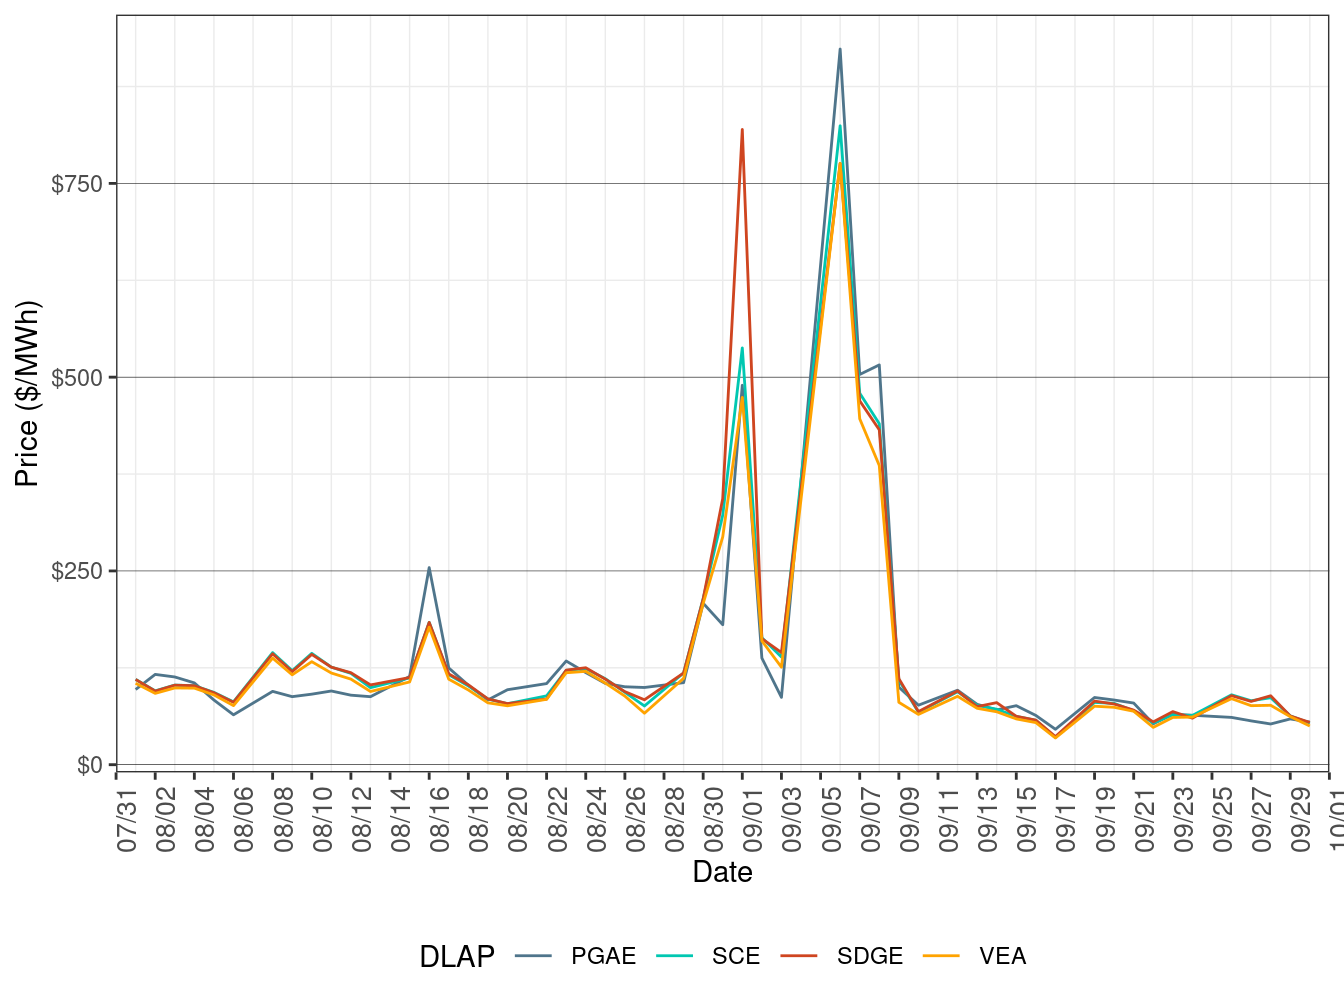
Figure 93: FMM Simple Average LAP Prices (Off-Peak Hours)
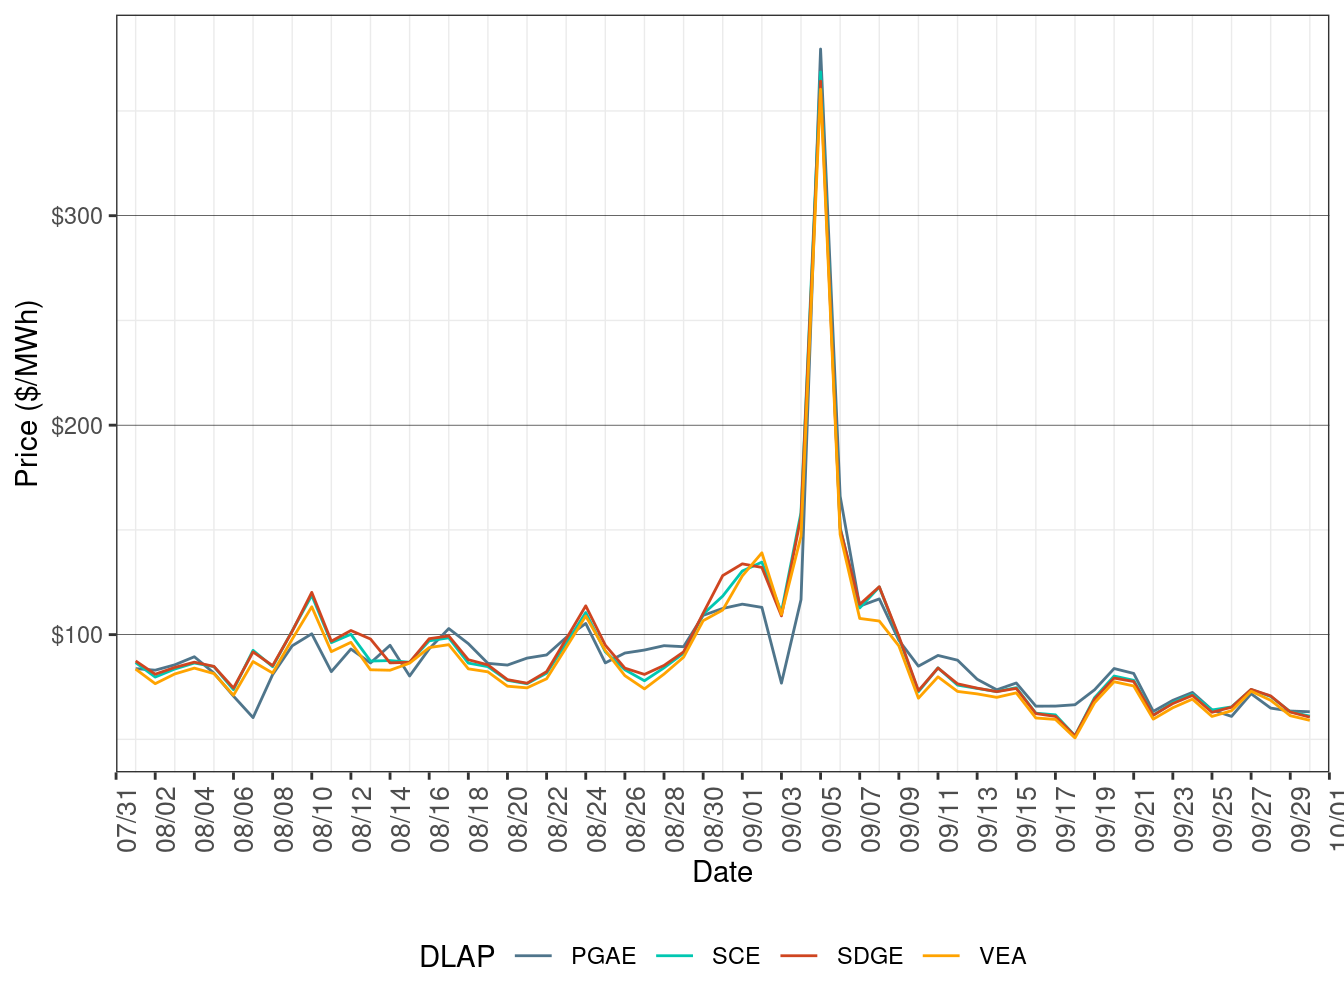
Figure 94: FMM Simple Average LAP Prices (All Hours)
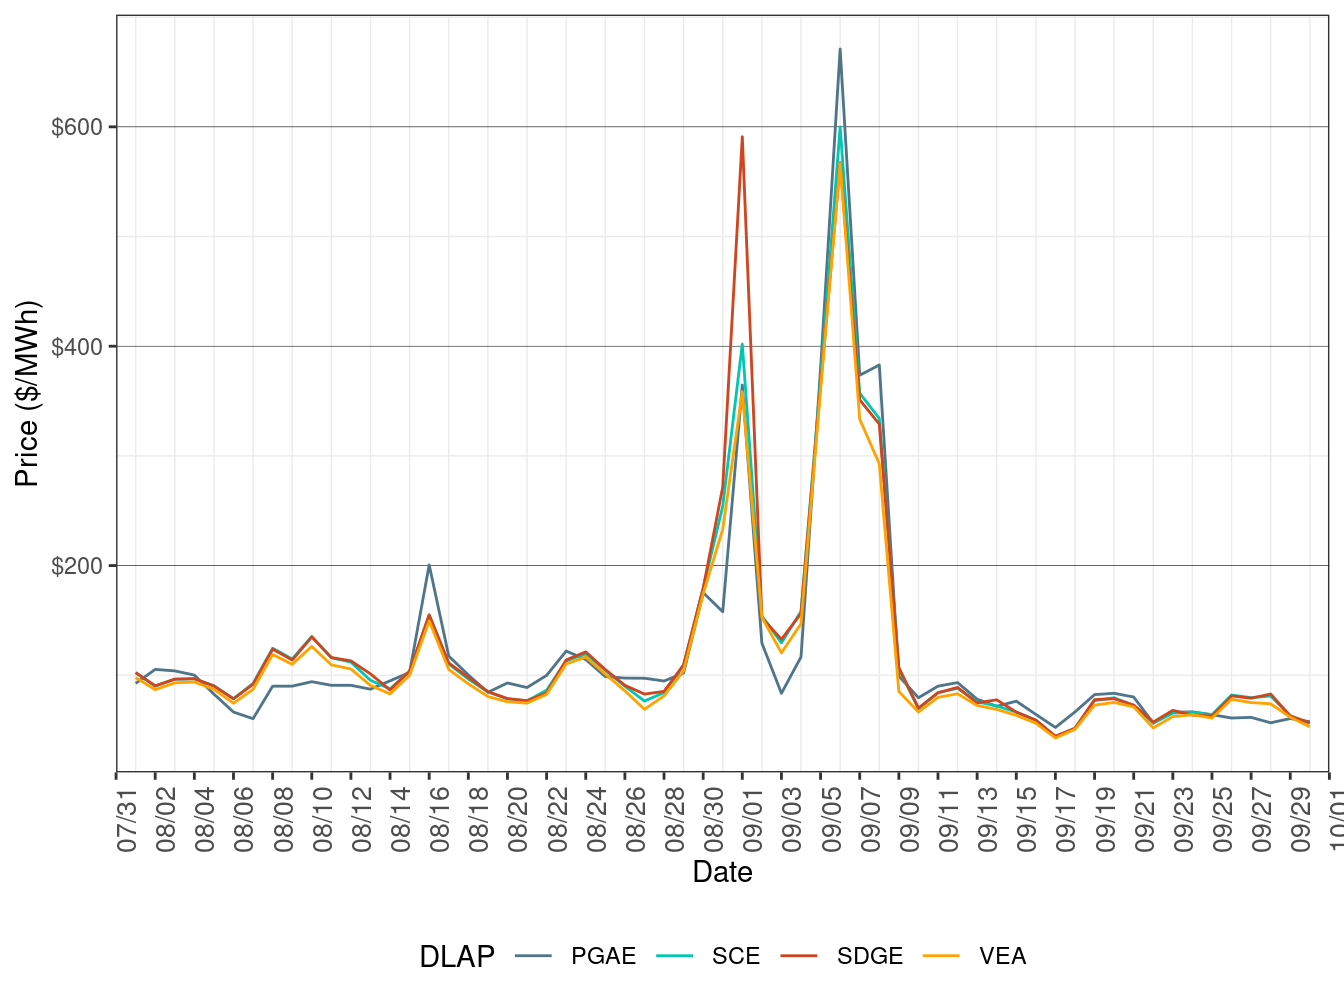
Figure 95: RTD Simple Average LAP Prices (On-Peak Hours)
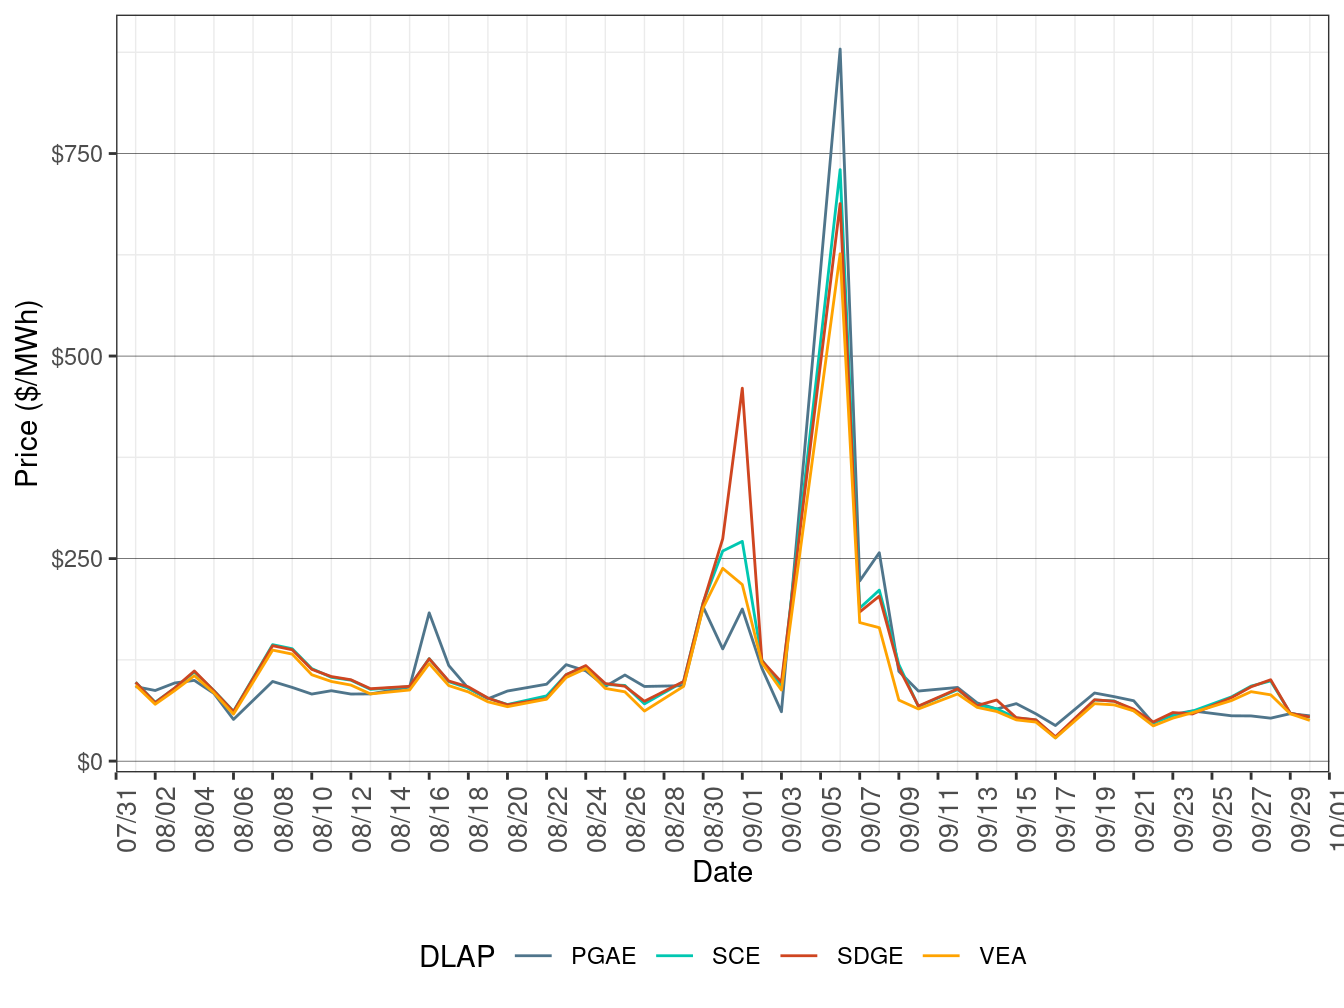
Figure 96: RTD Simple Average LAP Prices (Off-Peak Hours)
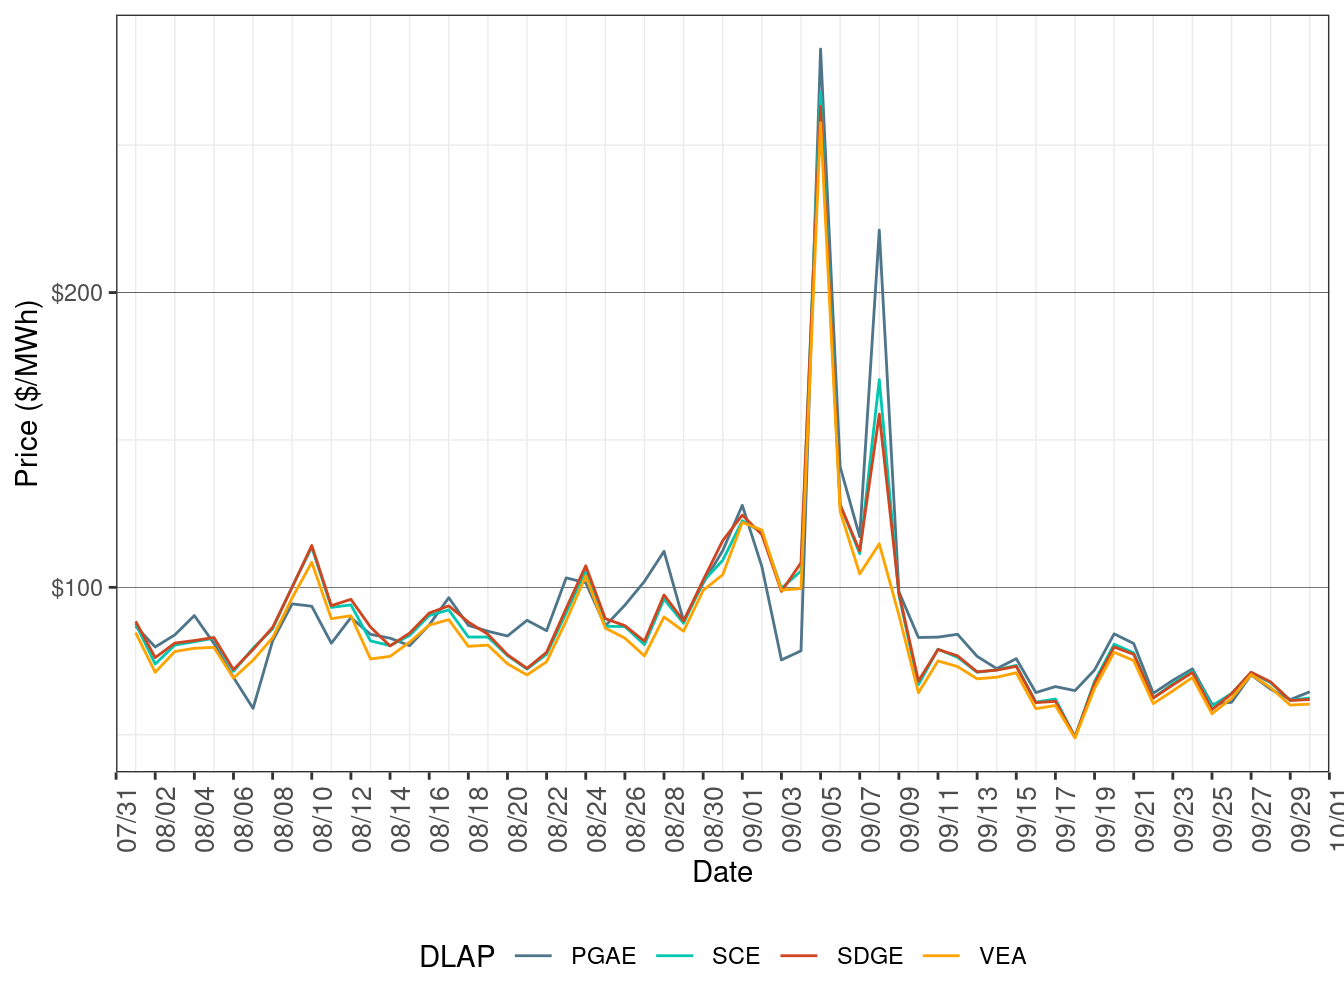
Figure 97: RTD Simple Average LAP Prices (All Hours)
Price Convergence
Price convergence is measured by the difference between day-ahead (DA) and real-time dispatch (RTD) prices. Generally speaking, the smaller the difference between the prices, the more convergent the prices are. Figure 98, Figure 99, and Figure 100 show the difference between DA daily average price and RTD daily average price for three default LAPs in all hours, peak hours, and off-peak hours respectively.
DA daily simple average price for each of the three default LAPs is calculated asthe following:
\[ \ P_i = \sum_{i}\frac{LMP_{ij}}{K} \quad where \quad i = PGAE , \ SCE \ and\ SDGE \] \(P_i\) is the daily average price for LAP i while j represents the hour (peak, off-peak,or all). K is the count of the hours in one day.
The formula for RTD DLAP daily average price is :
\[ \ P_i = \sum_j\sum_h\frac{LMP_{ijh}}{N} \quad where \quad i = PGAE , \ SCE \ and \ SDGE \] \(P_i\) is the daily average price for LAP i while j represents the hour (peak, off-peak, or all) and h represents 5-minute interval. N is the count of the intervals in one day. The similar methods are applied to calculate the DA and RTD weekly average prices for default LAPs.
Figure 98: Daily LAP Price Difference (All Hours)
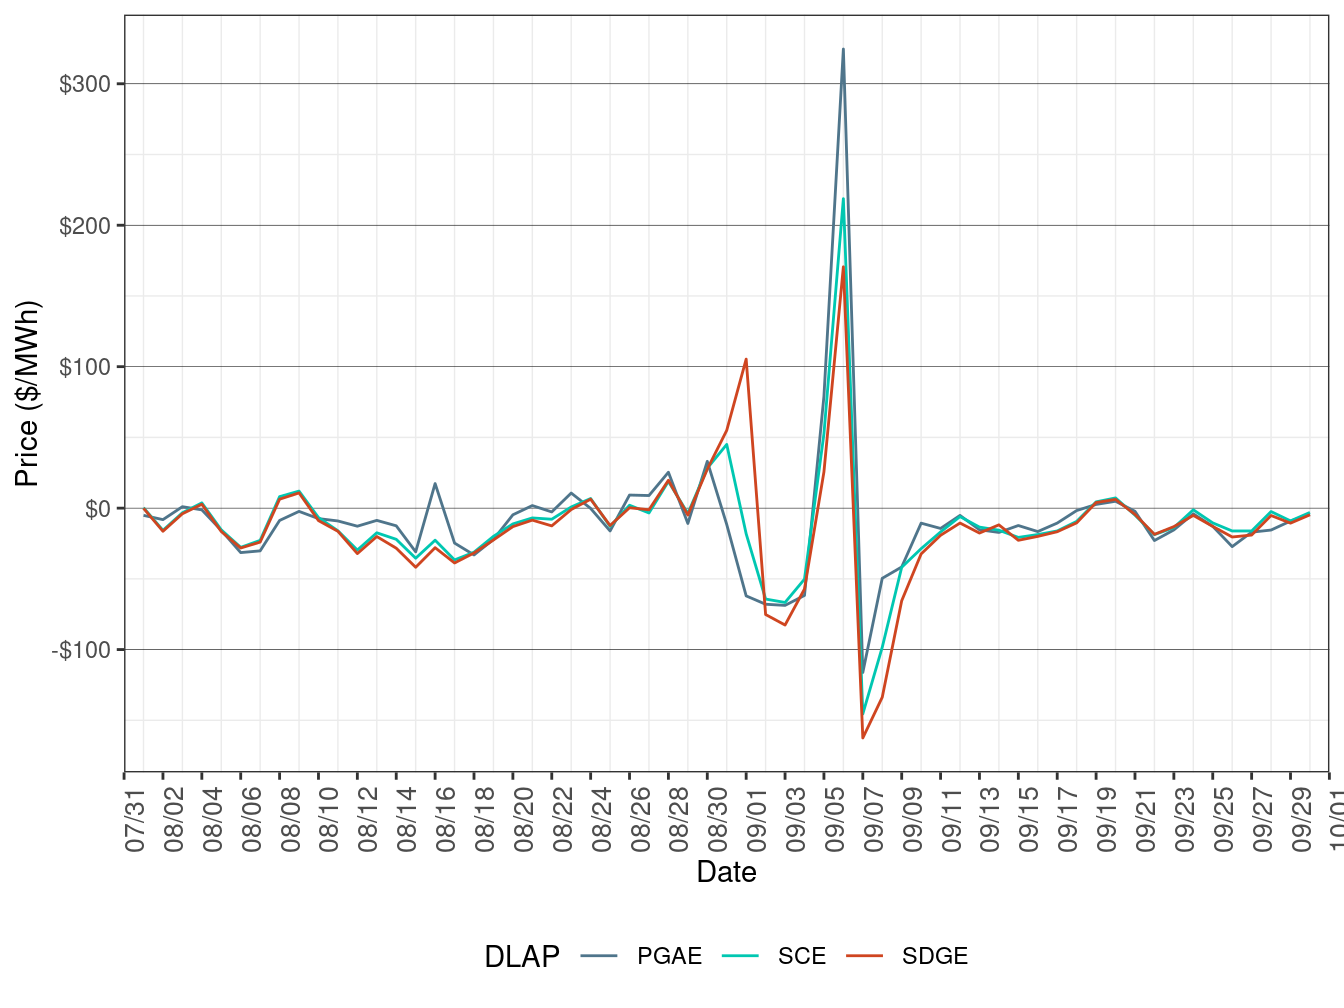
Figure 99: Daily LAP Price Difference (On-Peak Hours)
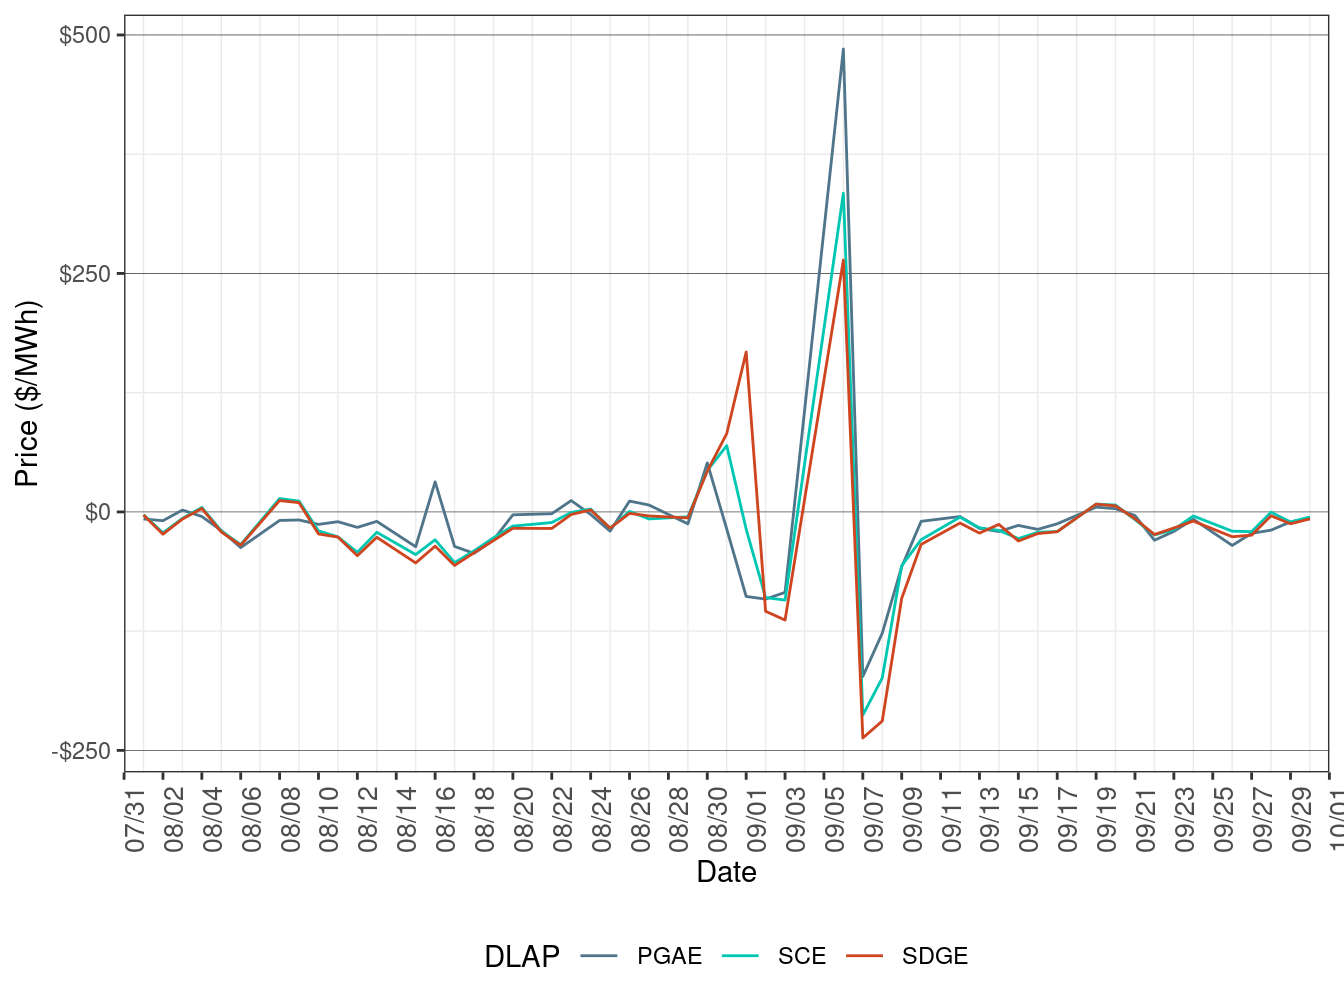
Figure 100: Daily LAP Price Difference (Off-Peak Hours)
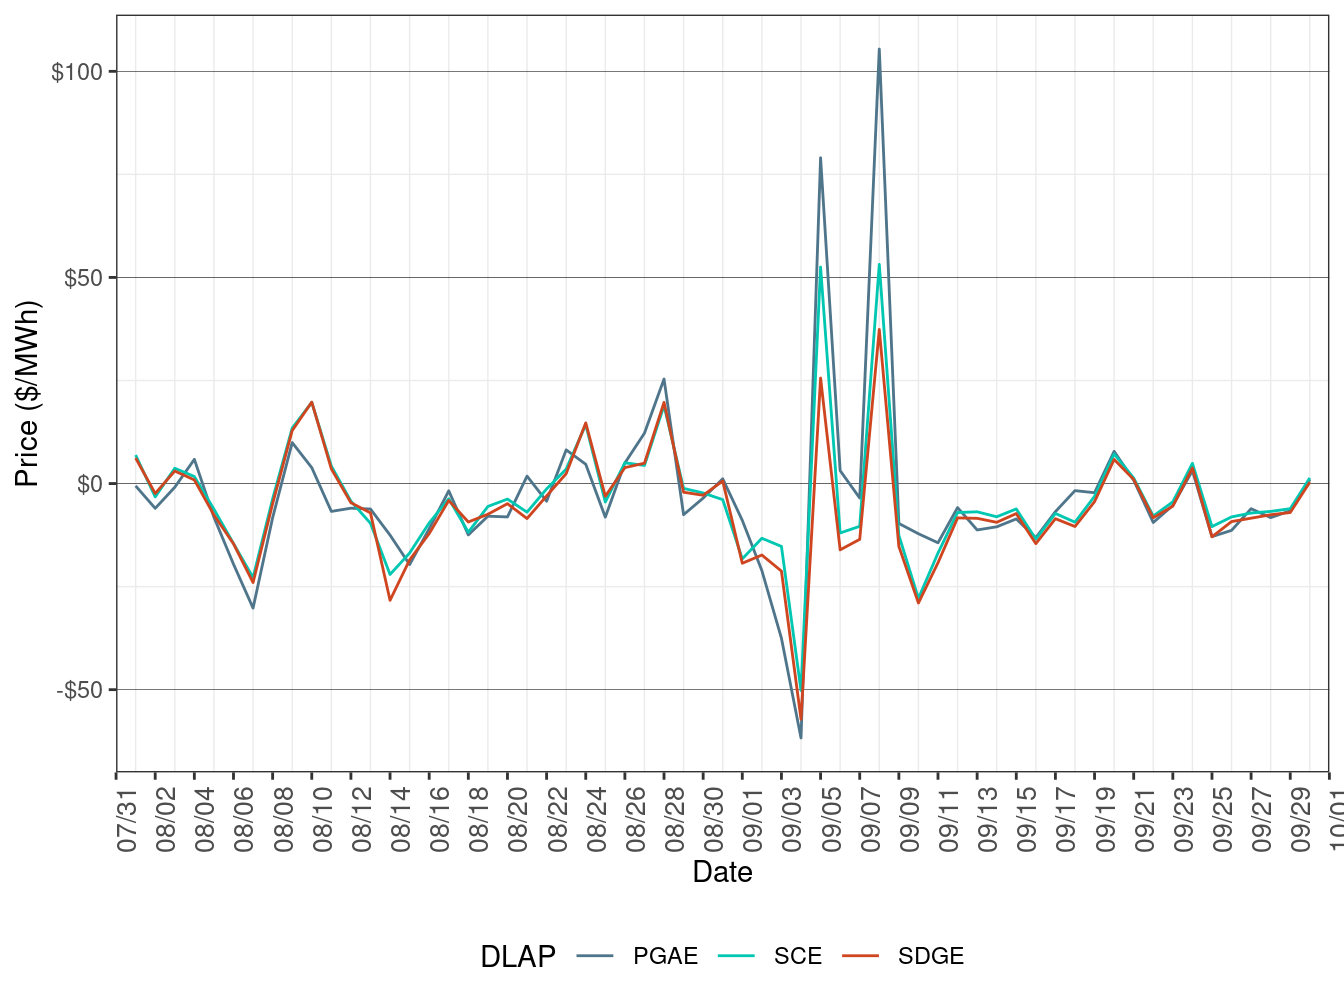
Figure 101, Figure 102, and Figure 103 show the difference between DA daily average price and RTD daily average price for three trading hubs (NP15, SP15, and ZP26) in all hours, peak hours, and off-peak hours respectively.
DA daily average price for each of the three trading hubs is calculated as below:
\[ \ P_i = \sum_j\frac{LMP_{ij}}{K} \quad where \quad i = NP15 , \ SP15 \ and \ ZP26 \] \(P_i\) is the daily average price for hub i while j represents the hour (peak, off-peak, or all). K is the count of the hours in one day.
The formula for RTD hub daily average price is:
\[ \ P_i = \sum_j\sum_h\frac{LMP_{ijh}}{K} \quad where \quad i = NP15 , \ SP15 \ and \ ZP26 \]
\(P_i\) is the daily average price for hub i while j represents the hour (peak, off-peak, or all) and h represents 5-minute interval. N is the count of the intervals in one day. The similar methods are applied to calculate the DA and RTD weekly average prices for trading hubs.
Figure 101: Daily Trading Hub Price Difference (All Hours)
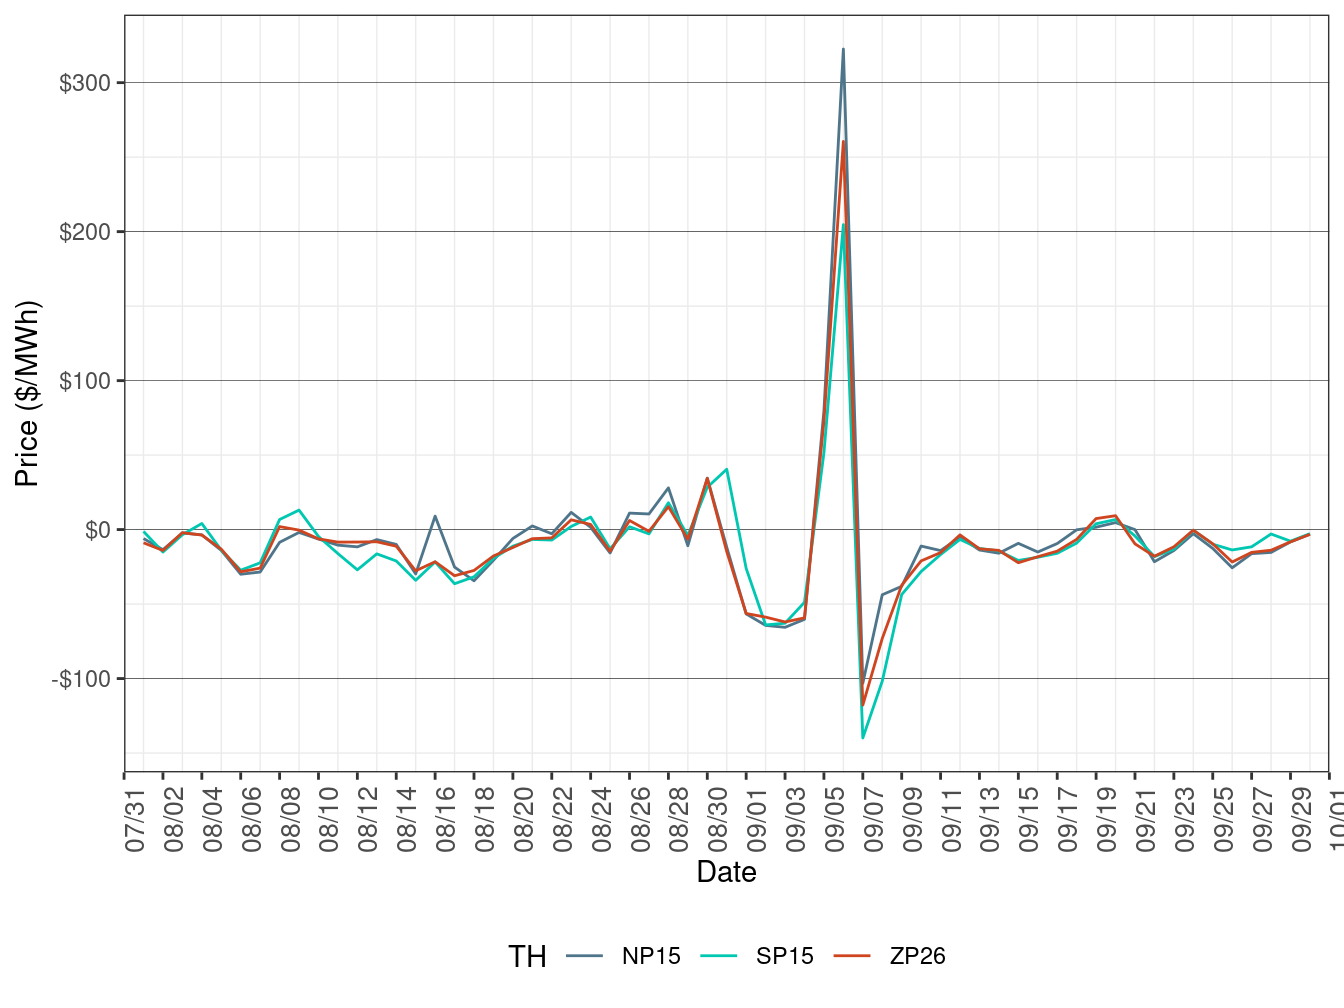
Figure 102: Daily Trading Hub Price Difference (On-Peak Hours)
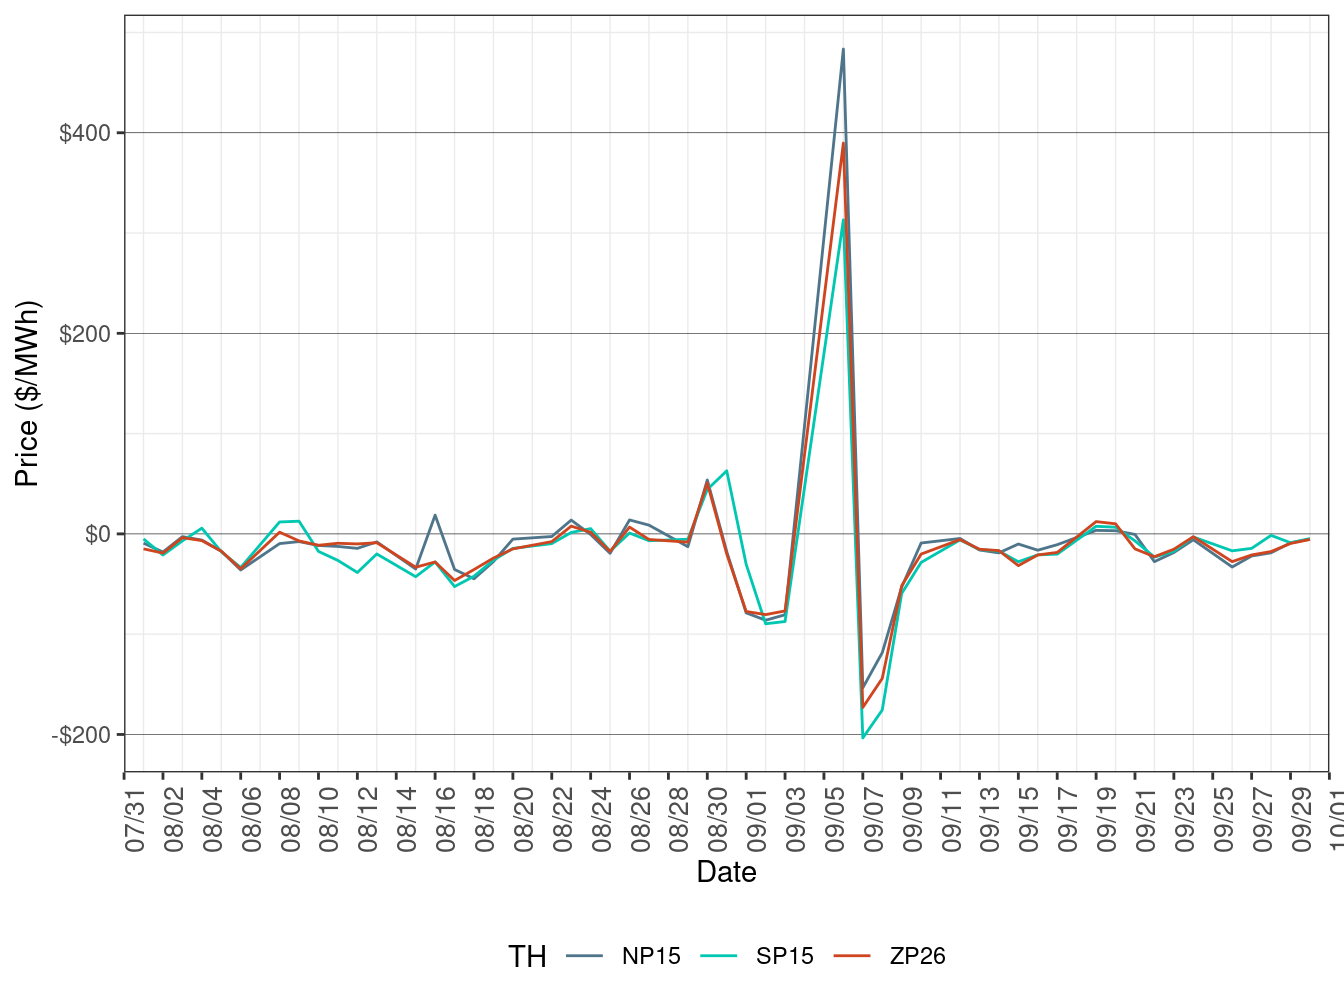
Figure 103: Daily Trading Hub Price Difference (Off-Peak Hours)
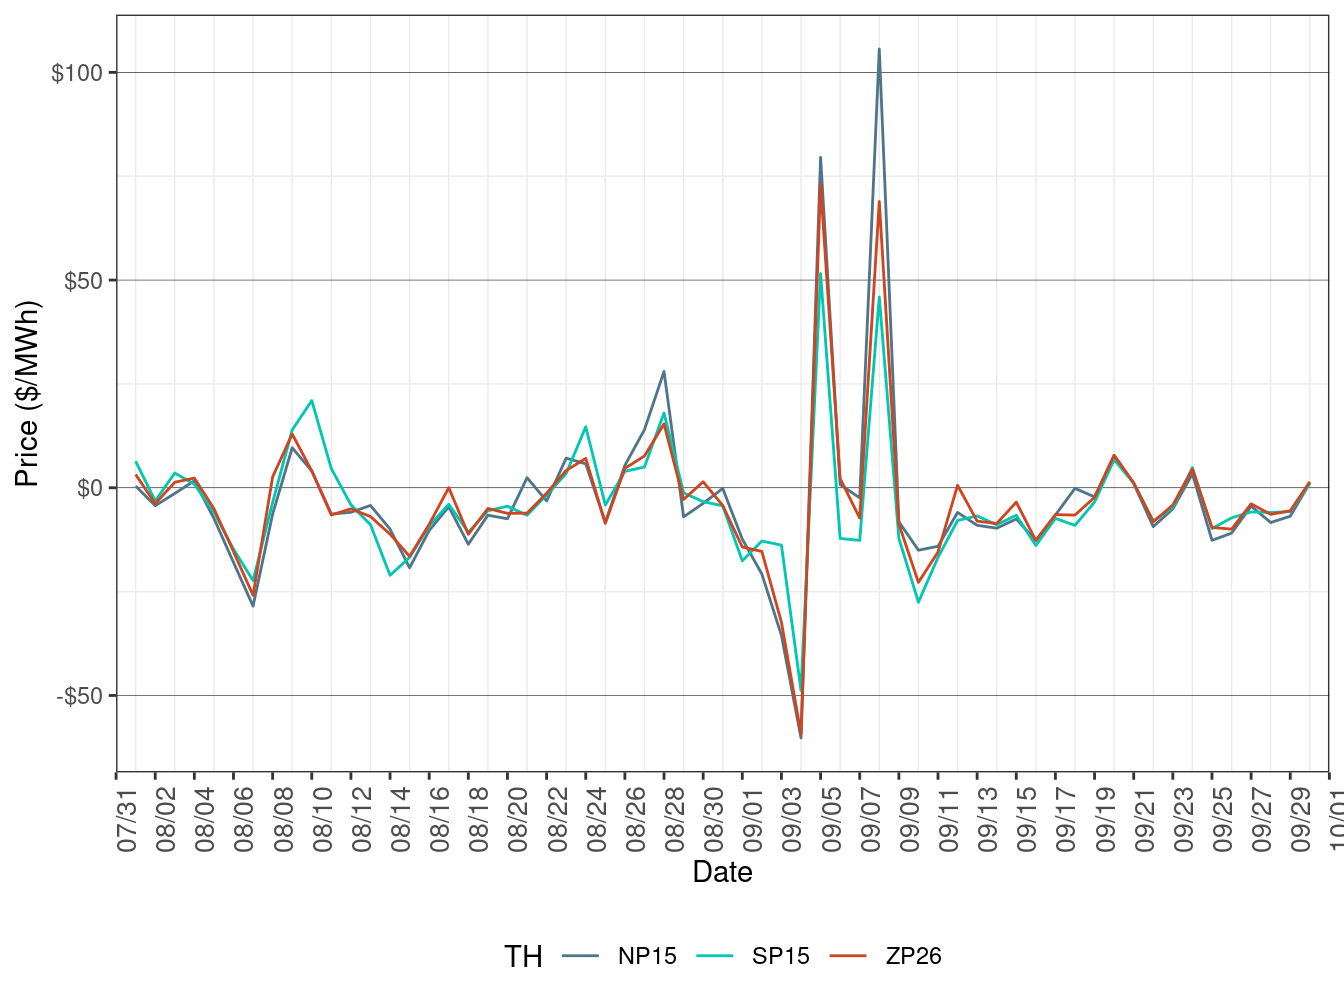
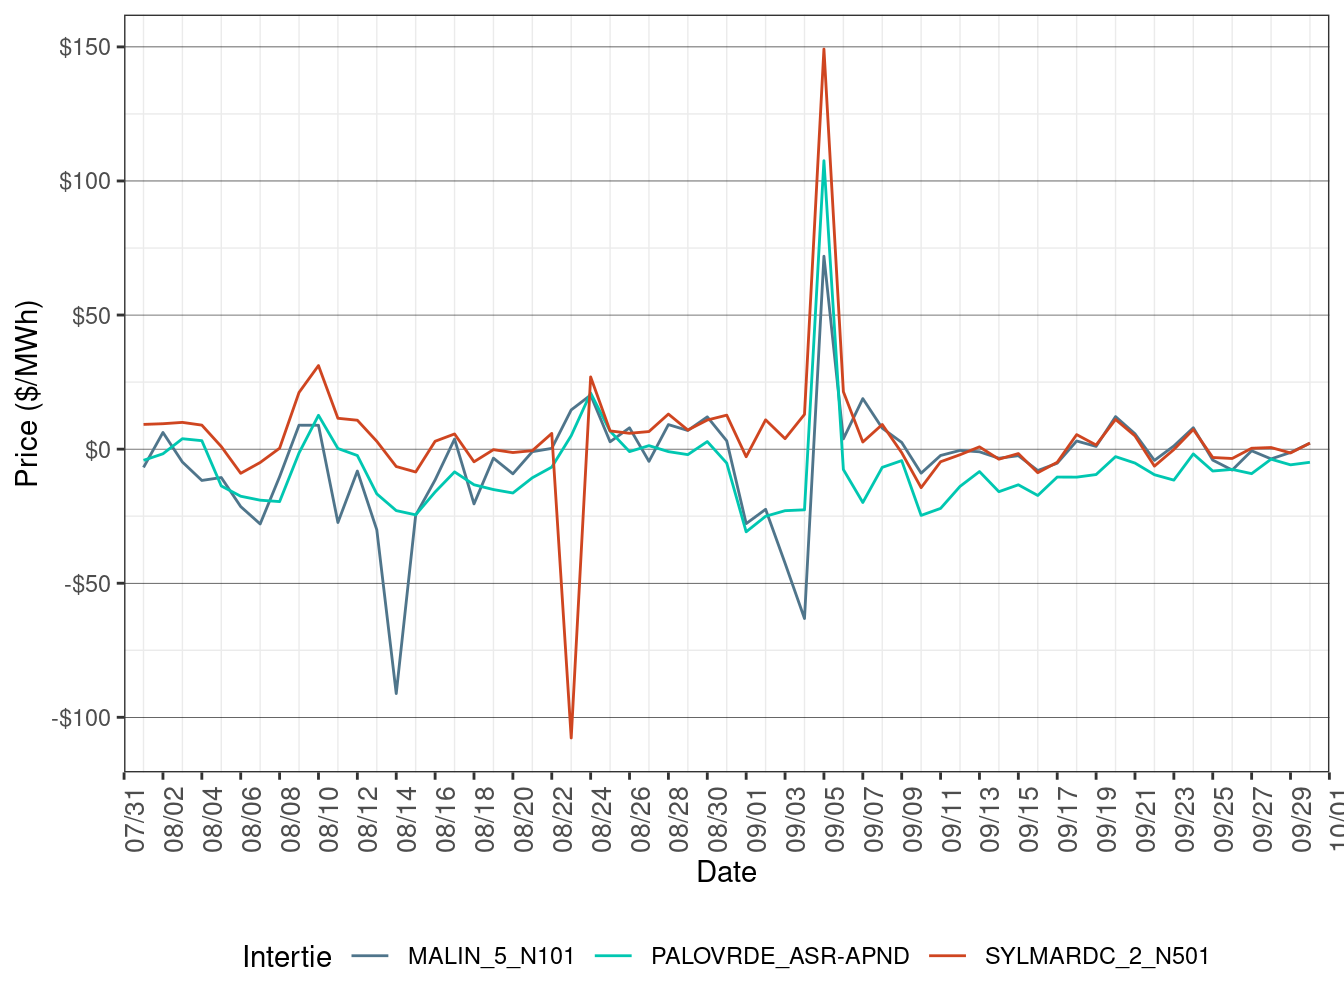
Figure 104, Figure 105, and Figure 106 show the difference between DA daily average price and FMM daily average price for three selected interties (Malin, Palo Verde, and Sylmar) in all hours, peak hours, and off-peak hours respectively
DA daily simple average price for each of the three selected Scheduling points is calculated as the follows:
$ P_i = _j where i = Malin , Palo Verde and Sylmar $
\(P_i\) is the daily average price for intertie i while j represents the hour (peak, off-peak, or all). K is the count of the hours in one day.
The formula for FMM intertie daily average price is: \[ \ P_i = \sum_j\sum_h\frac{LMP_{ijh}}{N} \quad where \quad i = Malin , \ Palo Verde \ and \ Sylmar \]
\(P_i\) is the daily average price for intertie i while j represents the hour (peak, off-peak, or all) and h represents 15-minute interval. N is the count of the intervals in one day.
Figure 104: Daily Intertie Price Difference (All Hours)
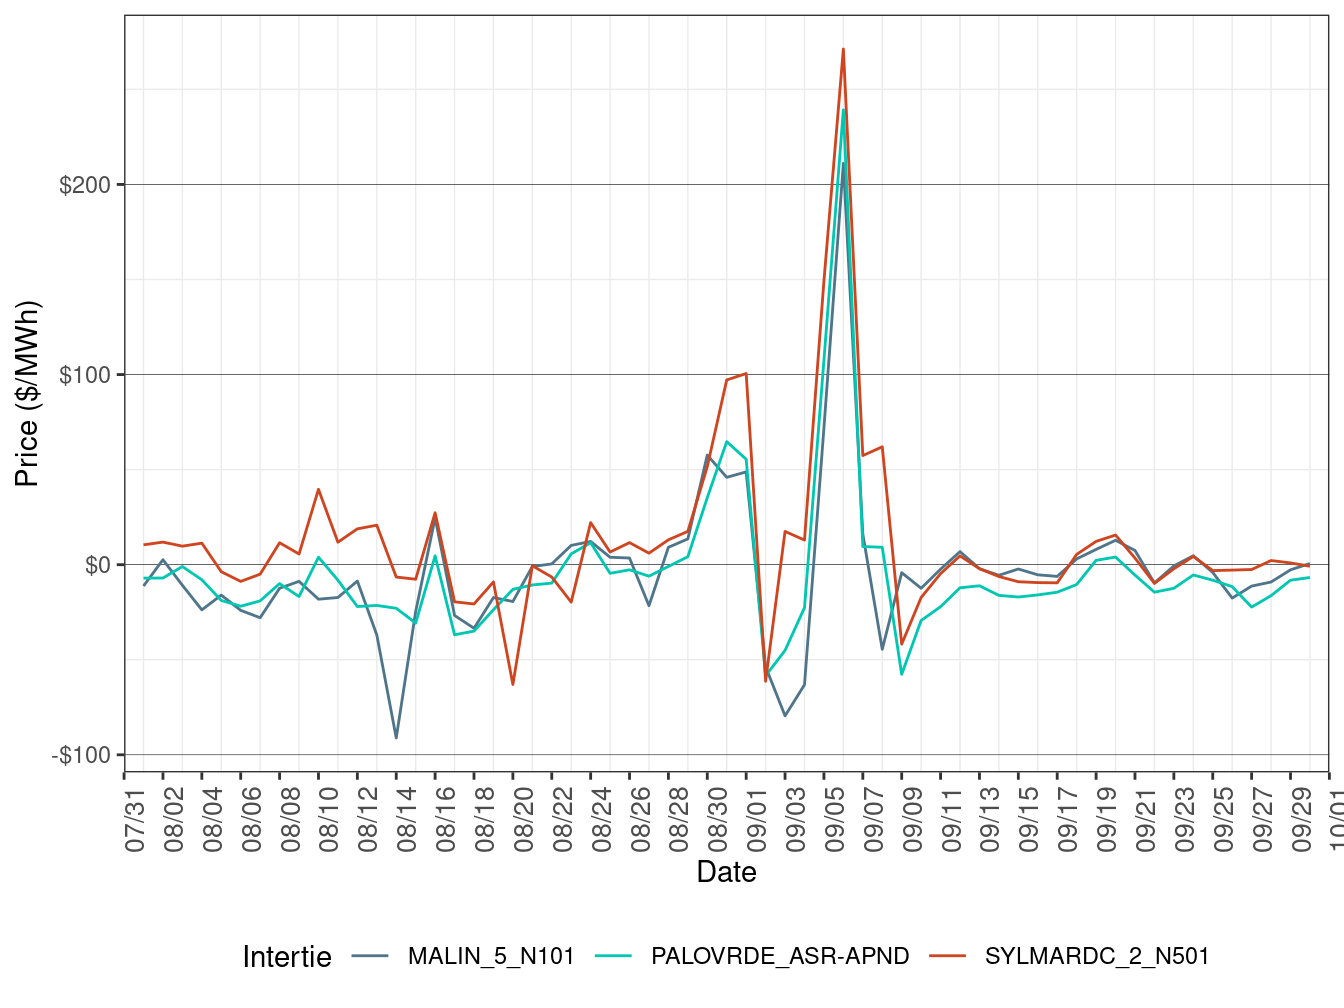
Figure 105: Daily Intertie Price Difference (On-Peak Hours)
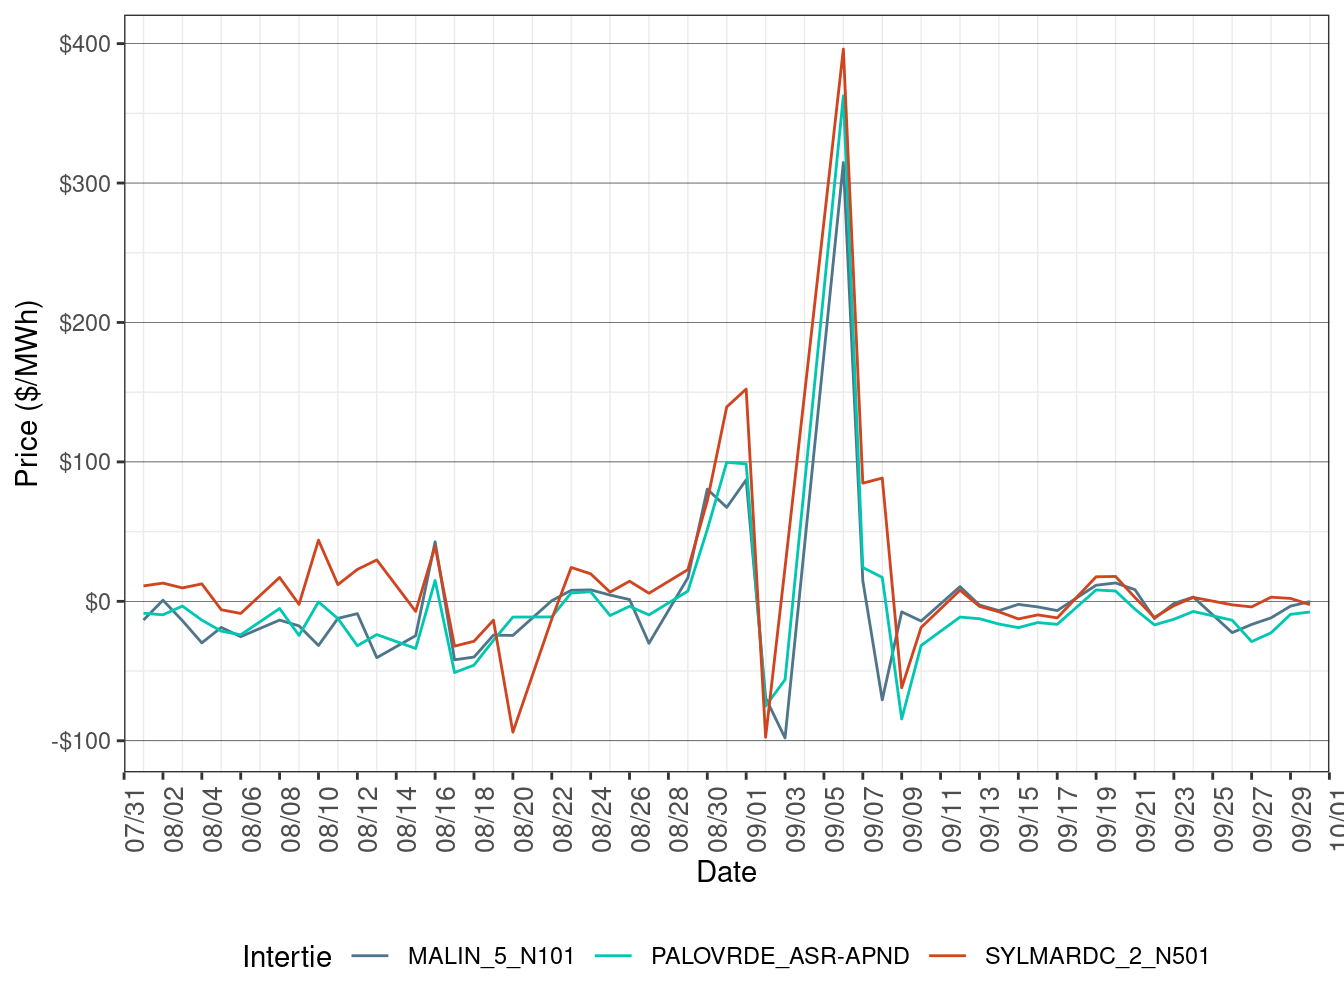
Figure 106: Daily Intertie Price Difference (Off-Peak Hours)
Real-Time Price Volatility
Figure 107 shows the daily price frequency for prices above $250/MWh and below $0/MWh in FMM. Prices are for all default LAPs. The graph may provide a trend of price spikes over time.
Figure 107: Daily Frequency of FMM LAP Positive Price Spikes and Negative Prices
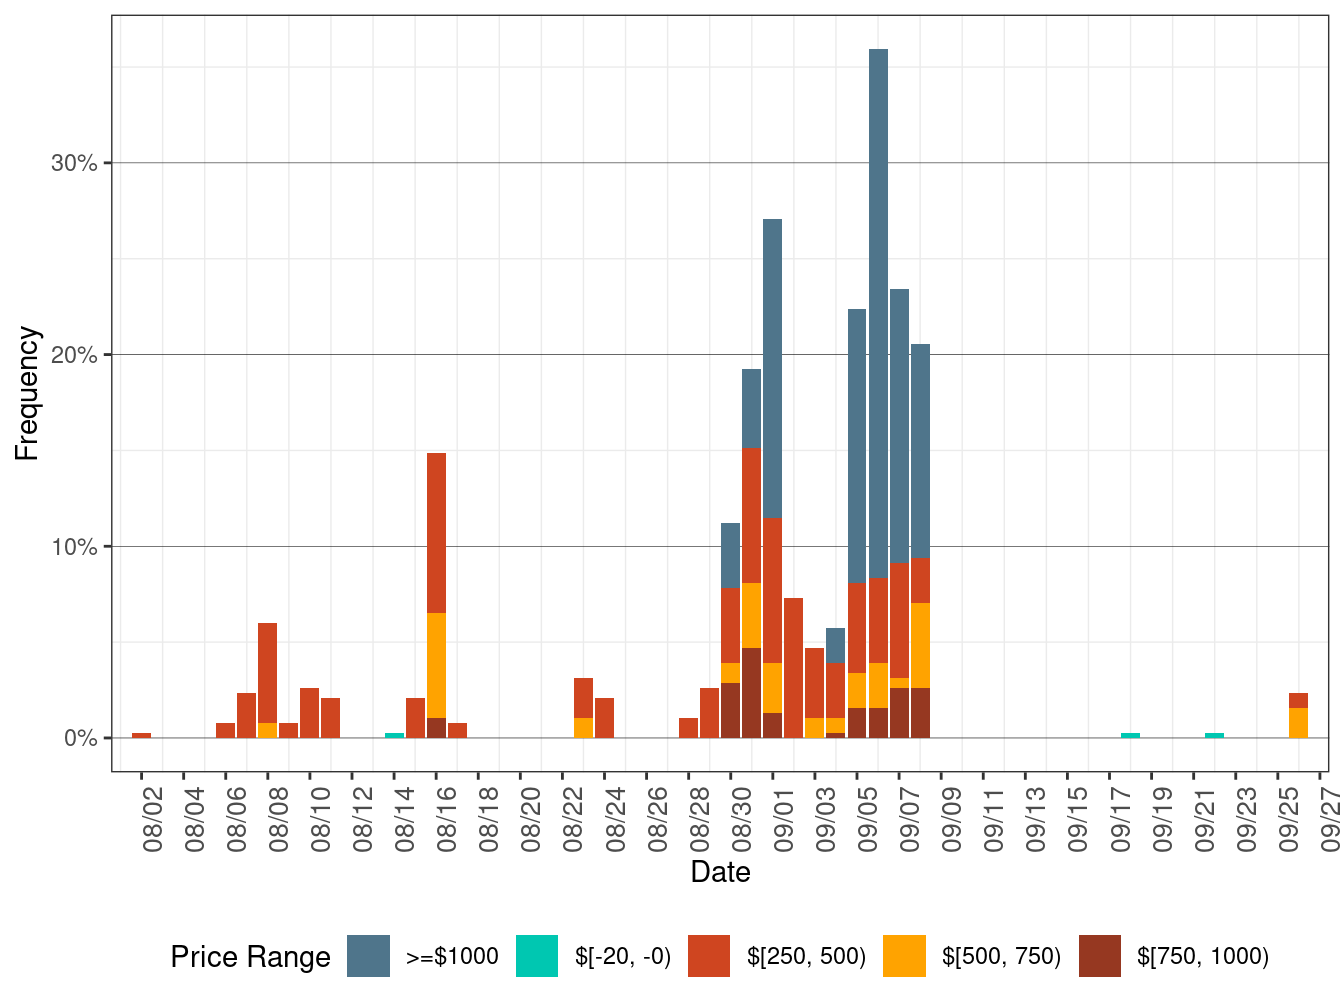
Figure 108 shows the frequency of prices of the default LAP prices in the real-time market. Prices are grouped in several bins. This plot provides a reference of the frequency of prices that fall below -30/MWh and above $250/MWh. This frequency includes both time of uses, on-peak and off-peak, and is aggregated by default LAP on a monthly basis.
Figure 108: Frequency of RTD LAP Prices (All Hours)
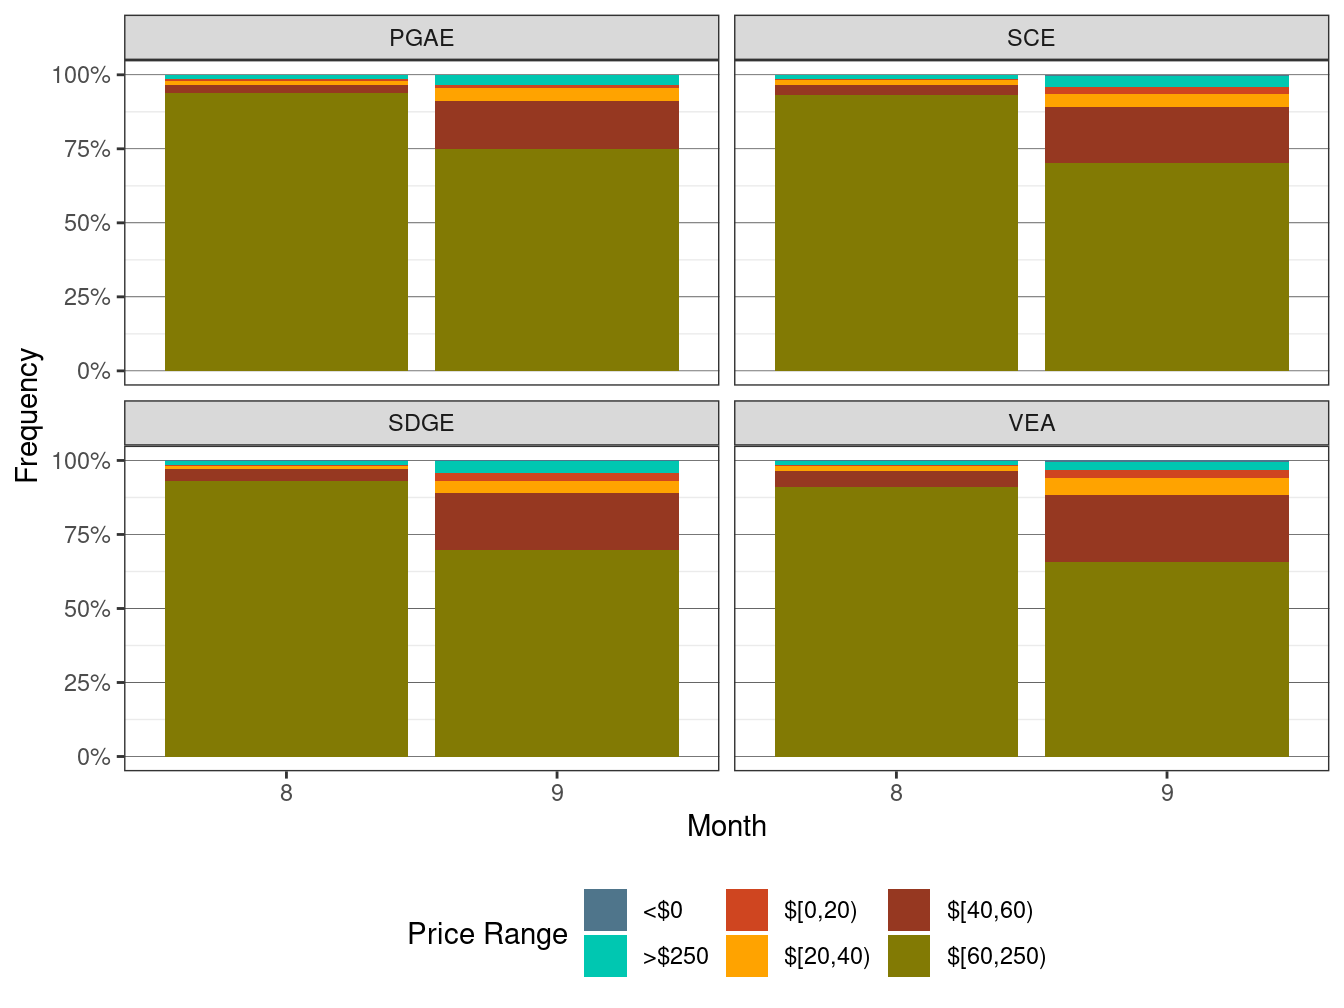
Figure 109 shows the monthly frequency of spikes for RTD default LAP prices that are above $250/MWh, and also negative prices. The prices are aggregated in a monthly basis for each default LAP.
Figure 109: Frequency of RTD LAP Price Spikes and Negative Prices
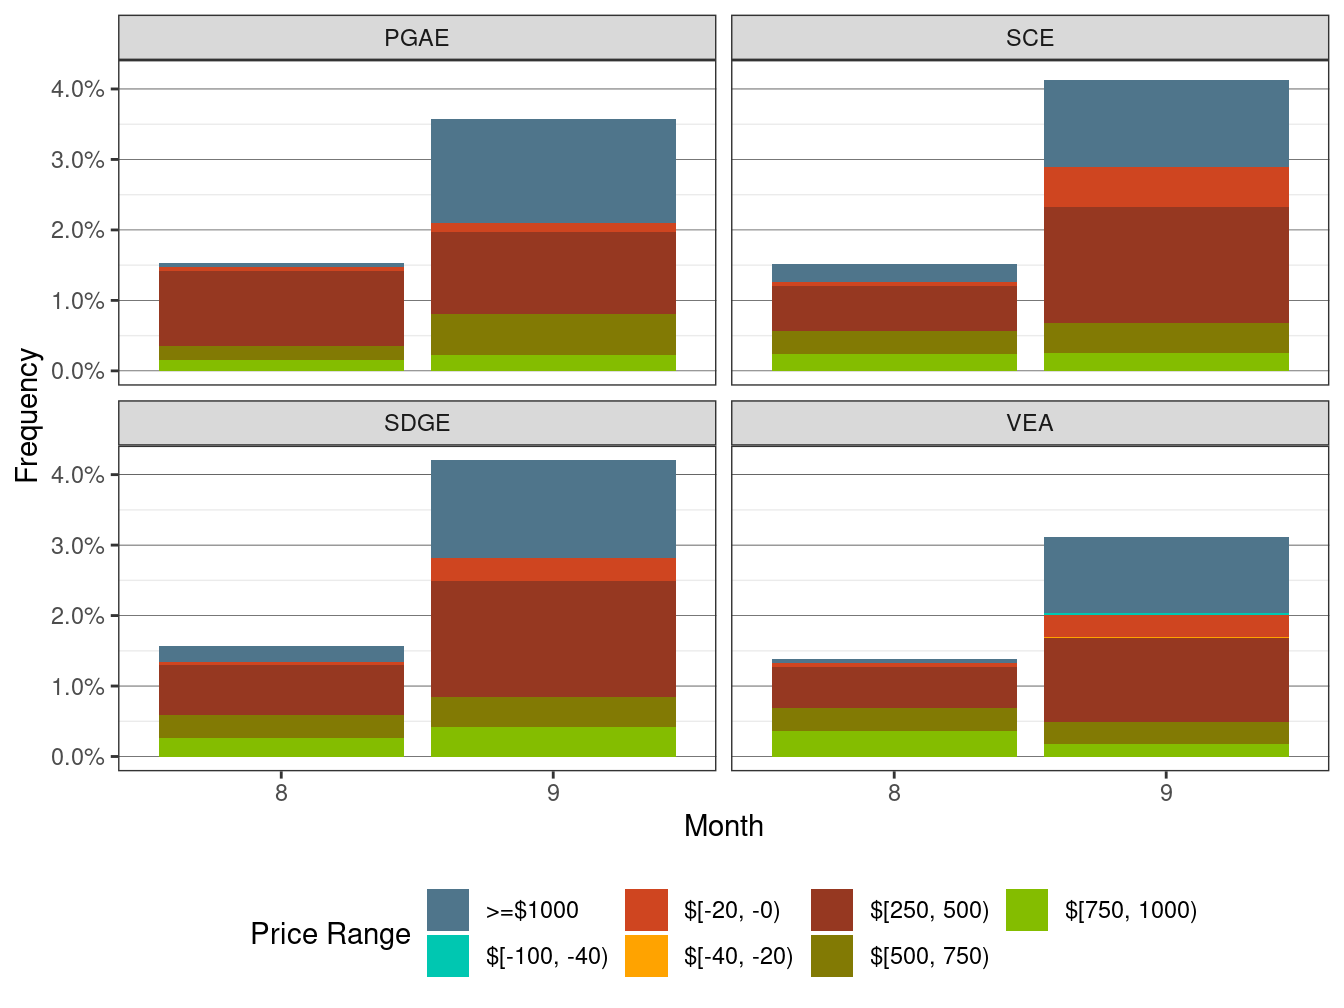
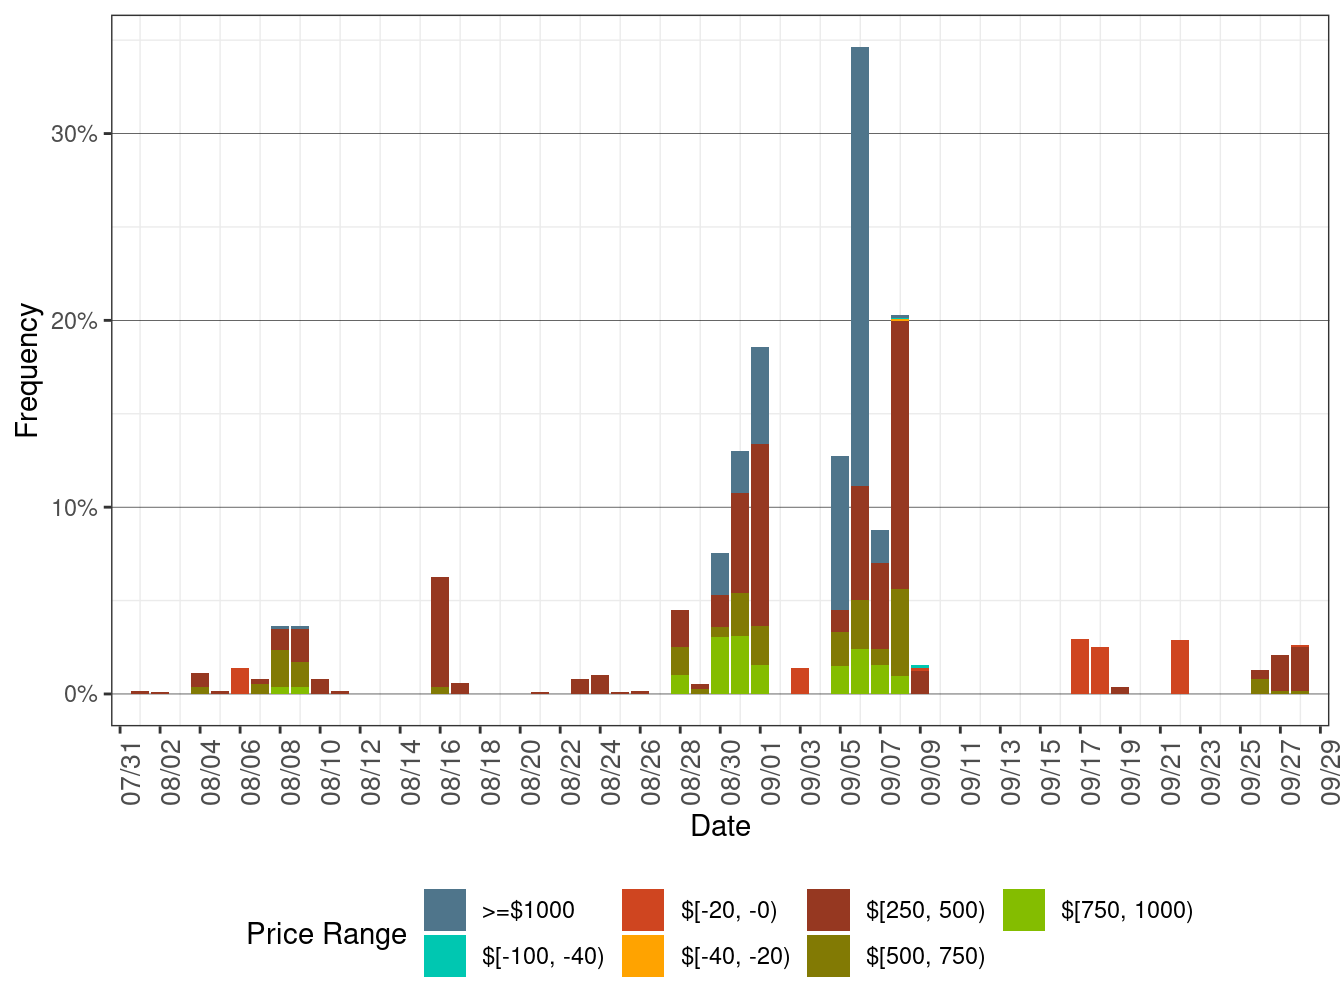
Figure 110 shows the daily price frequency for prices above $250/MWh and below $0/MWh. Prices are for all four default LAPs. The graph may provide a trend of price spikes over time.
Figure 110: Daily Frequency of RTD LAP Positive Price Spkies and Negative Prices