9 Market Software Metrics
Market performance can be confounded by software issues, which vary in importance levels, however amongst these various measures the failure of a market run is the most obvious failure.
Market Disruption
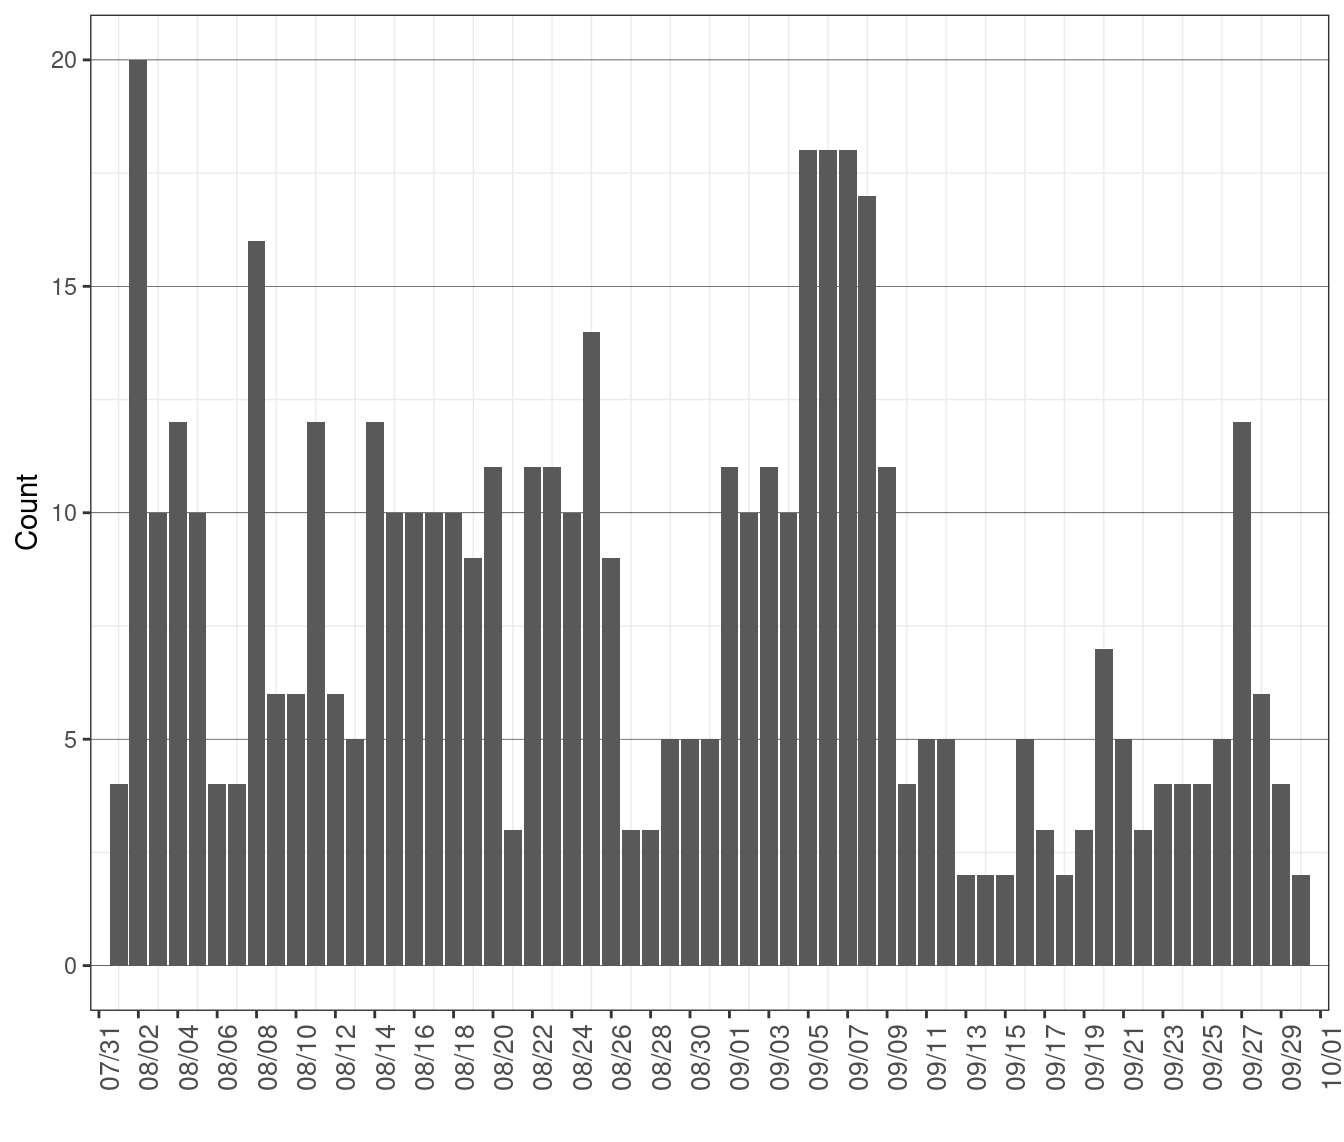
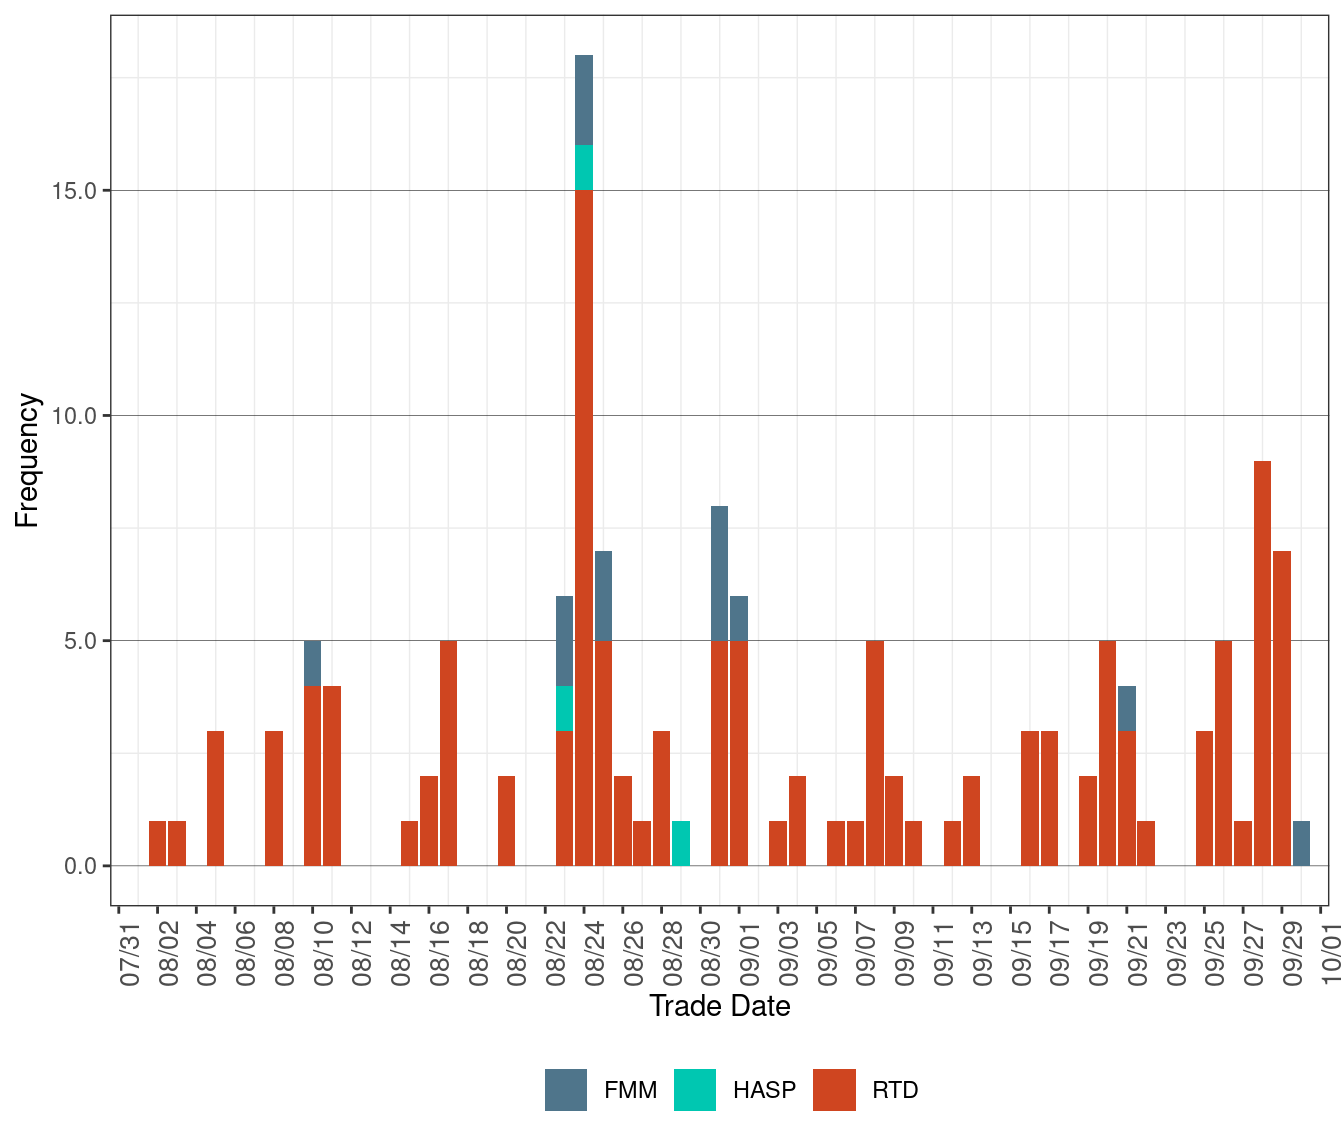
A market disruption is an action or event that causes a failure of an ISO market, related to system operation issues or system emergencies. Pursuant to section 7.7.6 of the ISO tariff, the ISO can take one or more of a number of specified actions in the event of a market disruption, to prevent a market disruption, or to minimize the extent of a market disruption. Figure 71 shows the frequency of HASP, RTUC, and RTD failures in the current month. There were a total of 66 market disruptions in this month. On September 28, there were nine RTD disruptions due to application problem.
Figure 71: Frequency of Market Disruption
System Parameter Excursion
The power balance constraint is one of the requirements that is enforced in the market all the time to ensure the balance between electricity generation and demand. The tendency for 5-minute real-time prices to exceed hour-ahead prices is driven in large part by extreme price spikes in the real-time market when the market software meets the system-wide power balance constraint with small and temporary amounts of regulation resources rather than with energy resources. When this relaxation occurs, the system imposes a penalty price, which then affects the energy prices in the pricing run.
This constraint can occur in two different ways:
When the market software dispatches regulation up as supply to meet projected demand, this represents a “shortage” constraint that causes prices to spike upwards to the $1000/MWh bid cap.
When the market software dispatches regulation down to balance supply with projected demand, this represents an “excess” constraint that causes prices to spike downwards to the -$30/MWh bid floor.
Figures 72 and 73 present how often the power balance constraint is relaxed by day and by class of shortage during the real-time dispatch. Figures 74 and 75 present how often the power balance constraint is relaxed by day and by class of excess during the real-time dispatch.
Figure 72: Frequency of Shortage
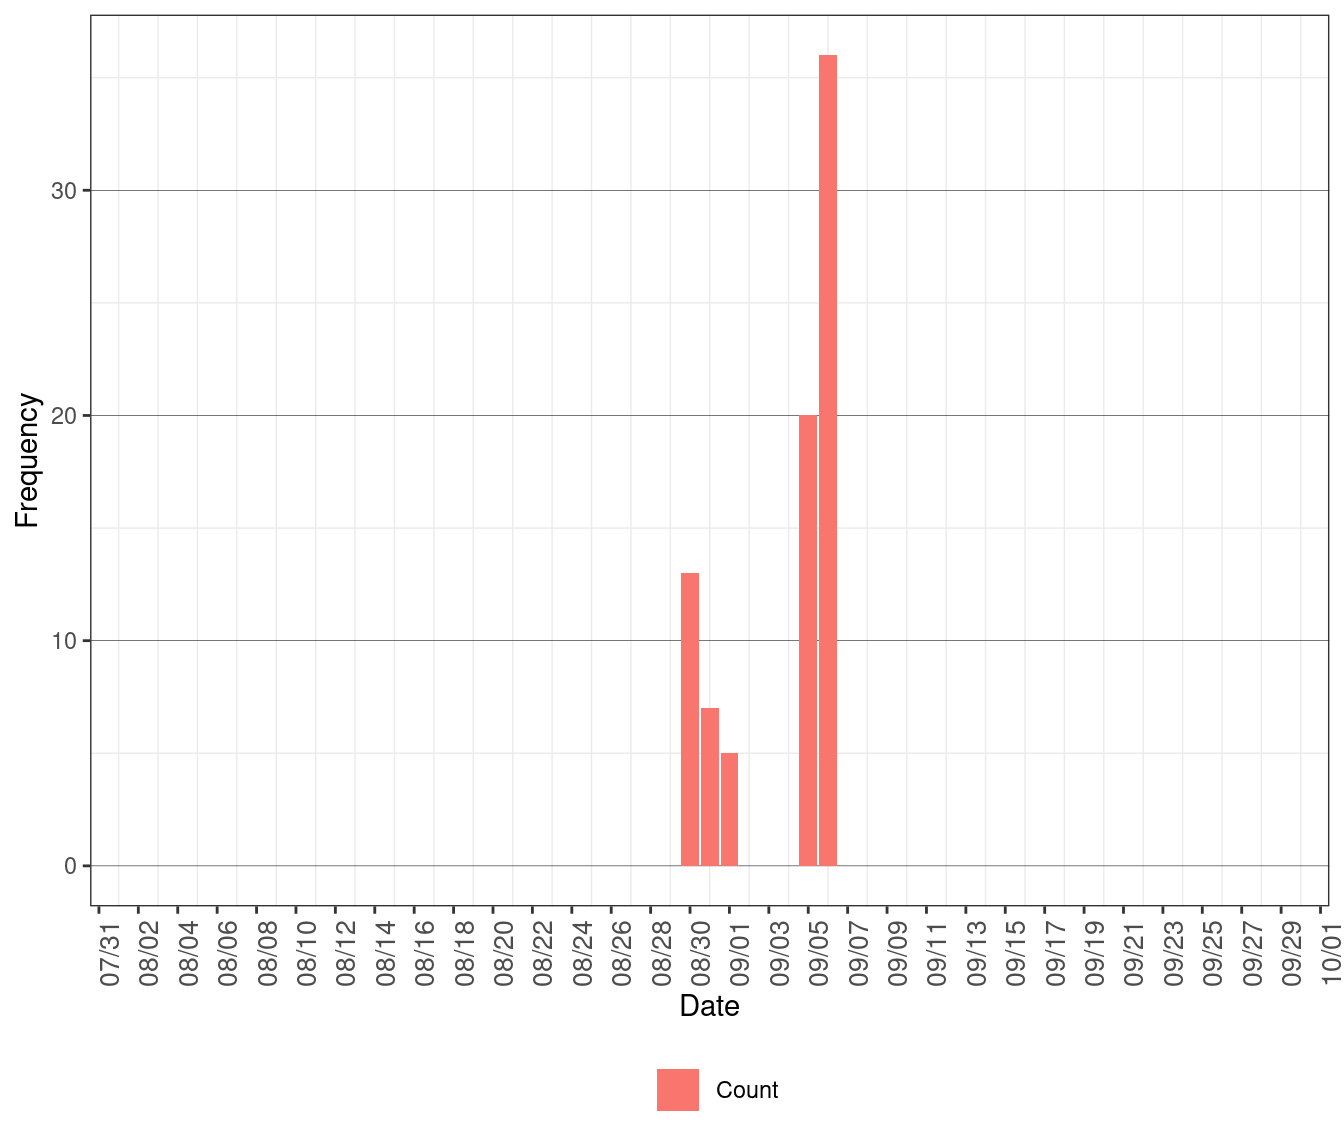
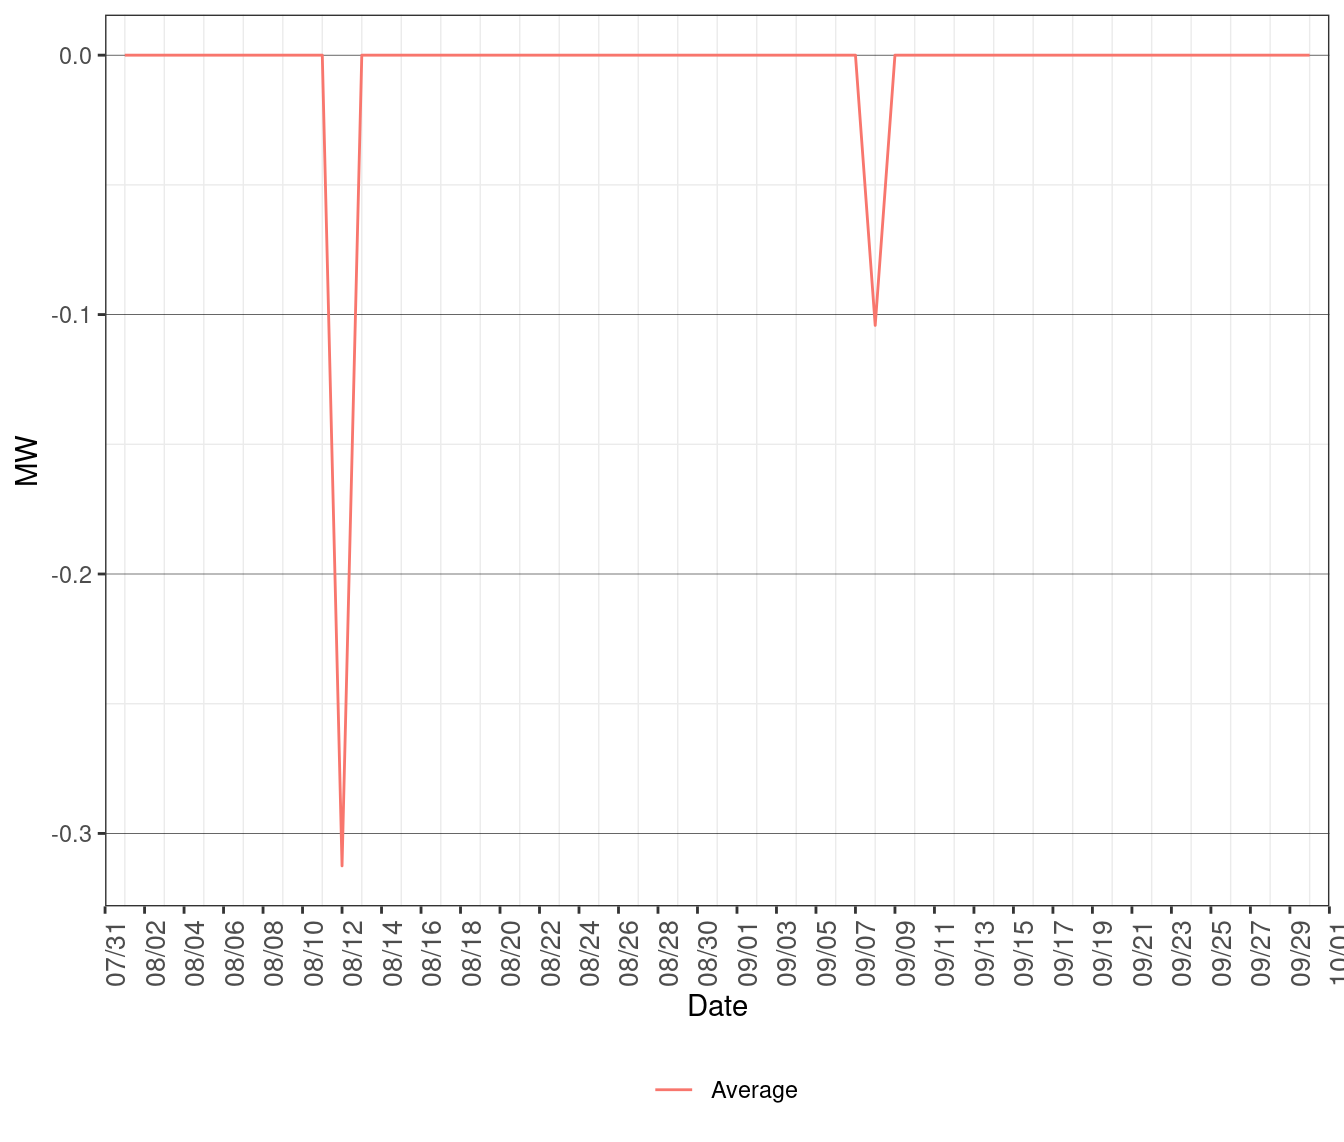
Figure 73: Average MW of Shortage
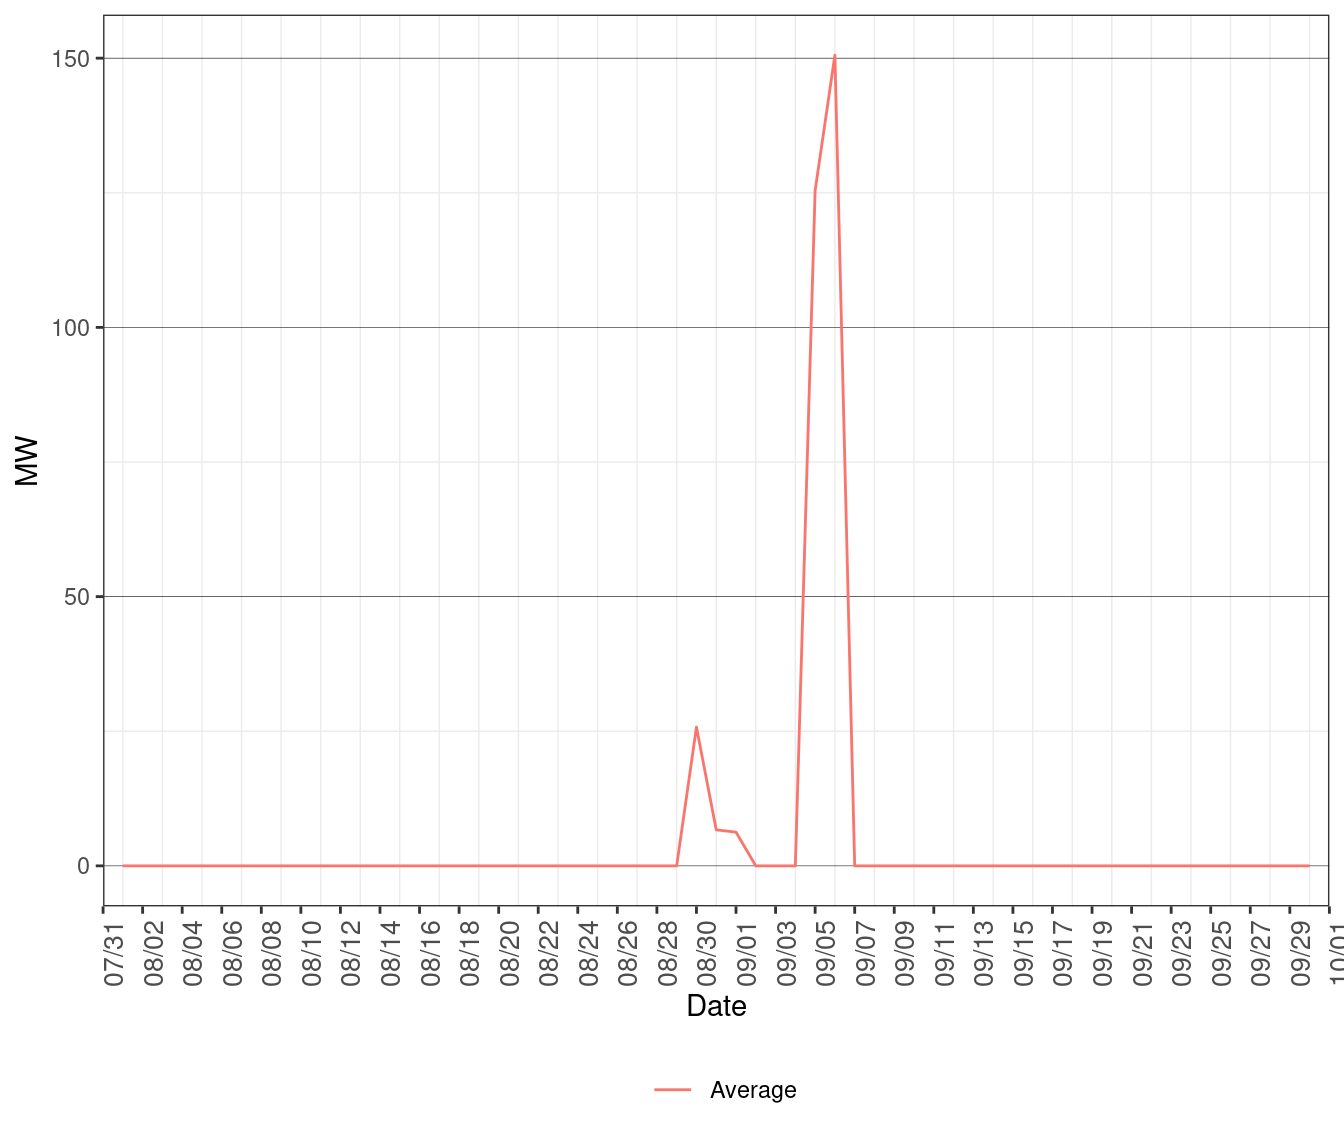
Figure 74: Frequency of Excess
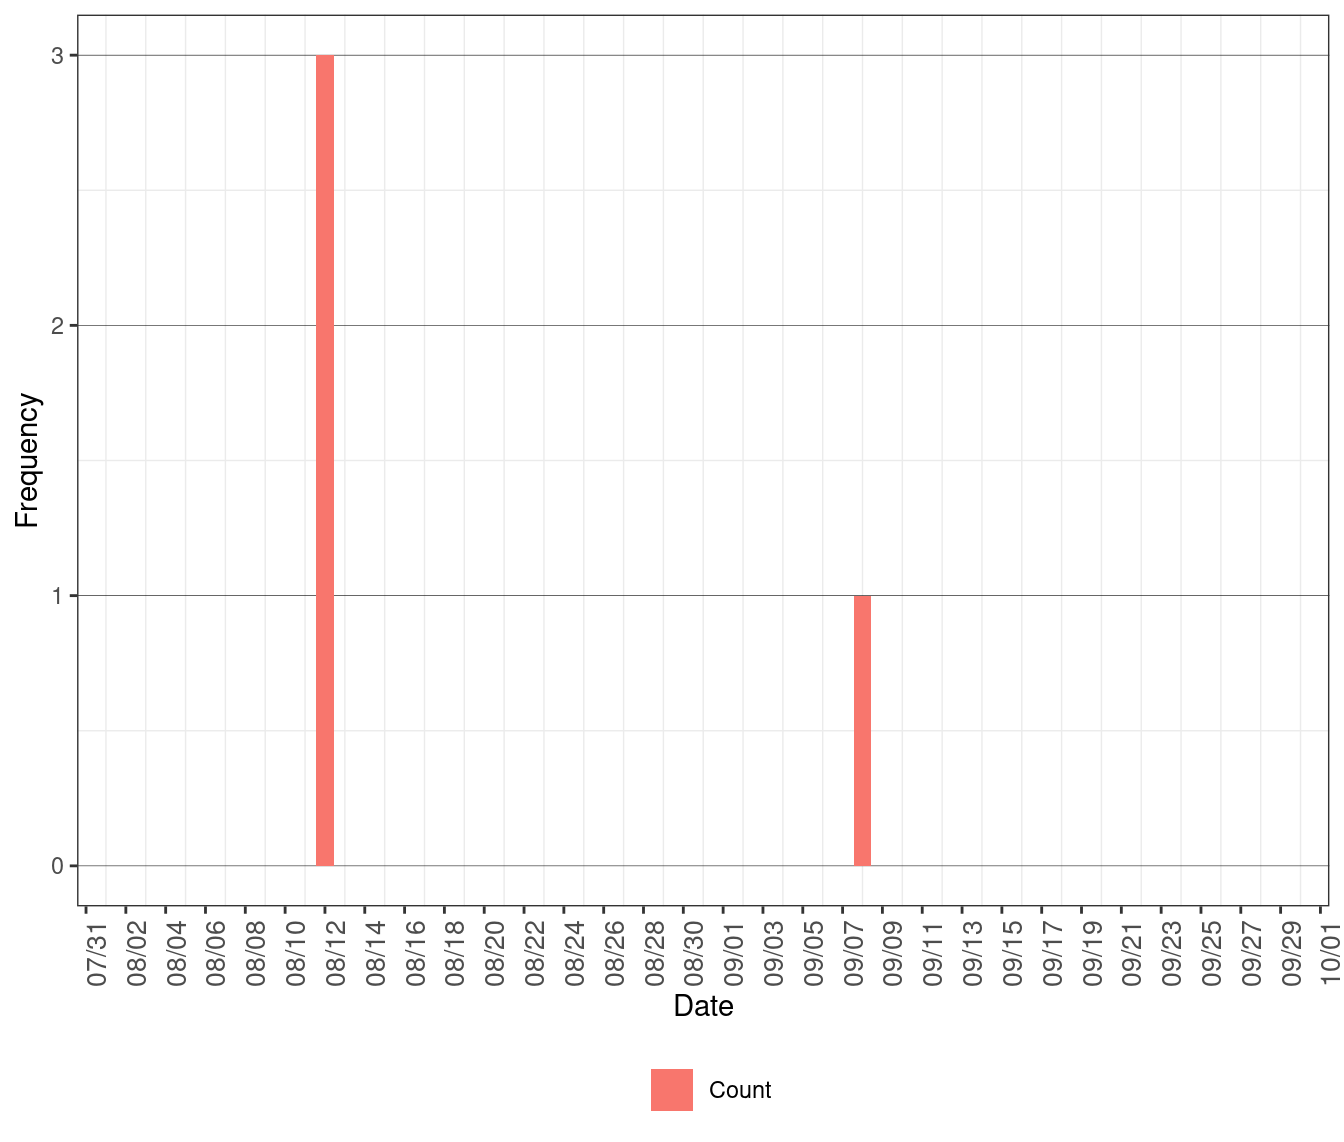
Figure 75: Average MW of Excess
Analysis of Minimum Online Capacity
The ISO utilizes the minimum online capacity (MOC) constraint to address the operational needs of certain operating procedures that require a minimum quantity of committed online resources in order to maintain reliability. MOC was deployed into the software systems with the expectation that it would commit an appropriate set of resources that were previously satisfied by either exceptional dispatch or nomogram enforcement in RUC, thus reducing the potential for overcommitment in RUC. This section studies the unit commitments driven by MOC constraint in IFM for the reporting period. Figure 76 below shows total Pmin and cleared value of the MOC units in the market. Figure 77 summarizes the number of MOC units.
Figure 76: MOC Unit Commitment and Dispatch
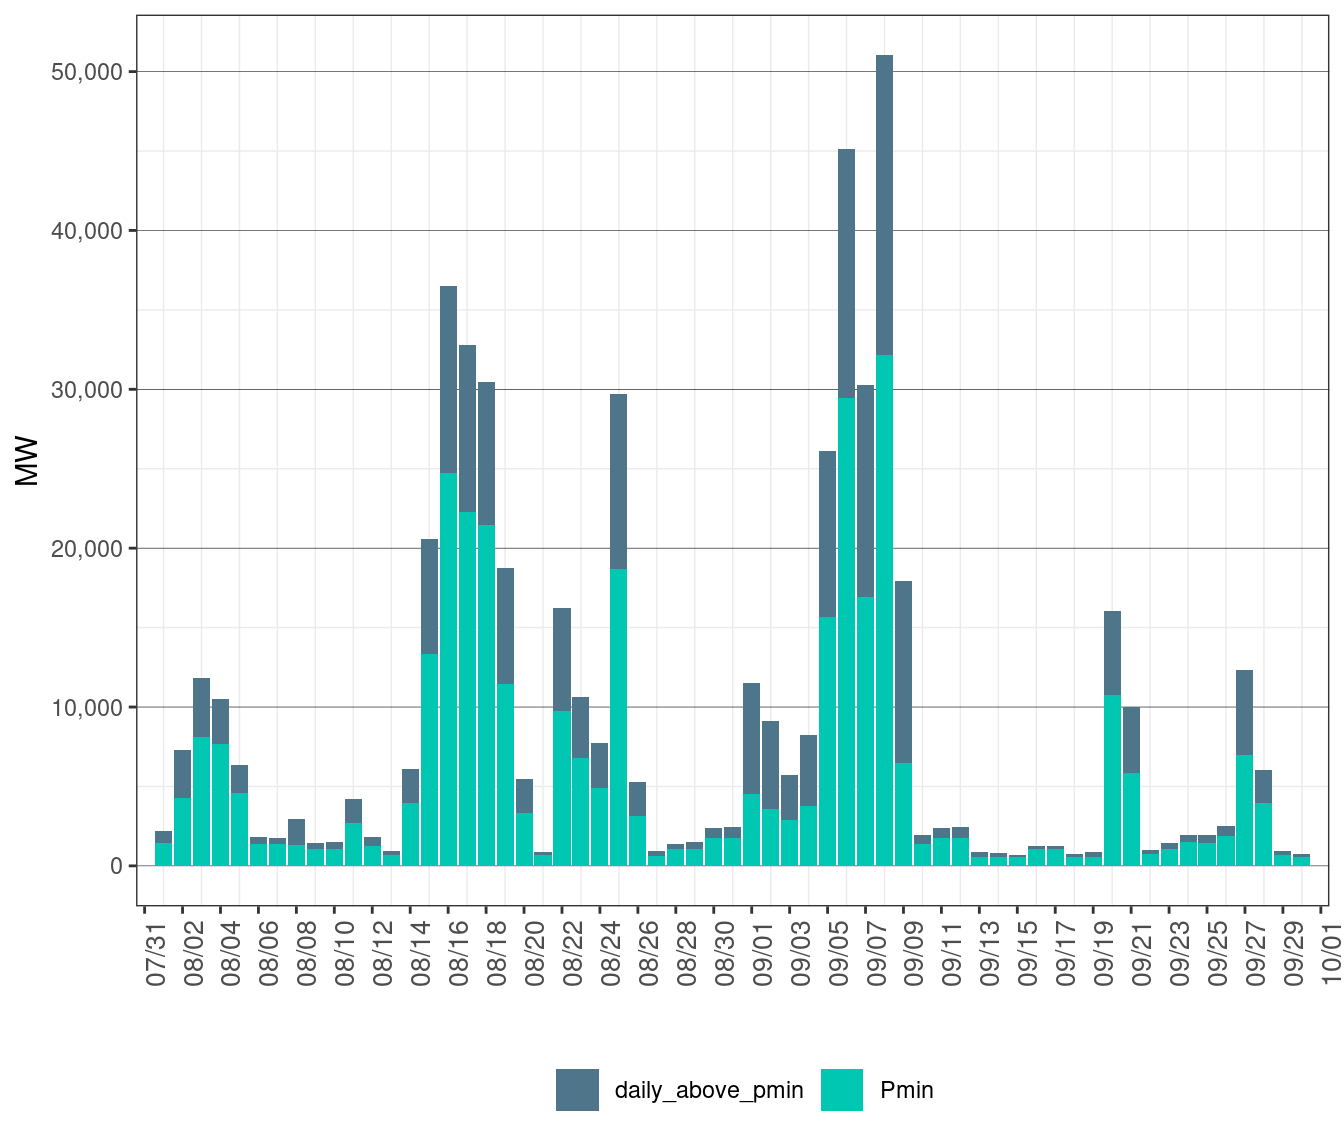
Figure 77: Daily Count of MOC Units