3 Market Performance Metrics
Day-Ahead Prices
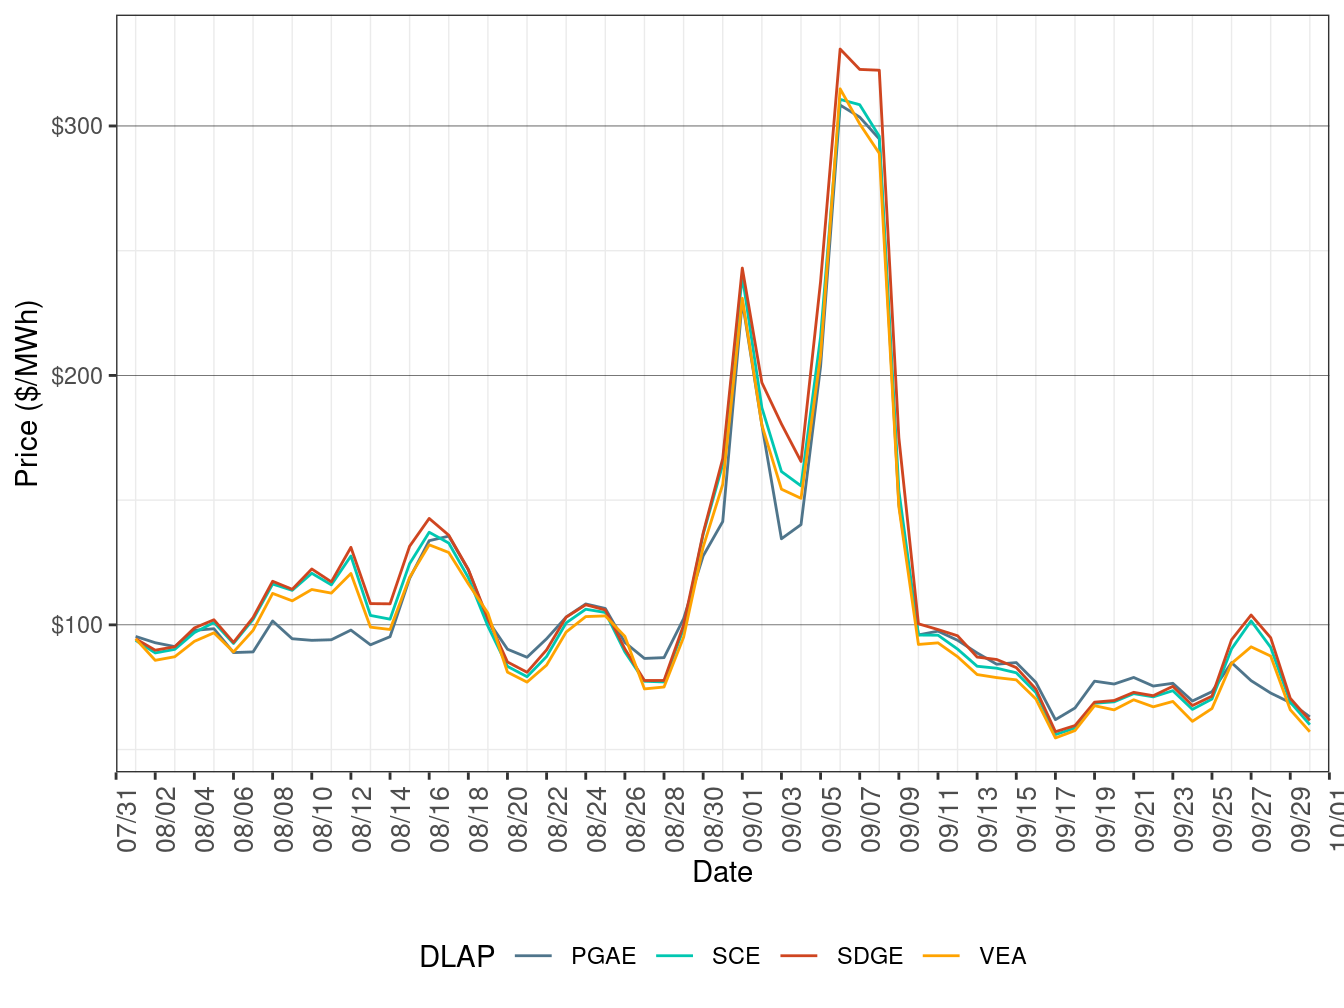
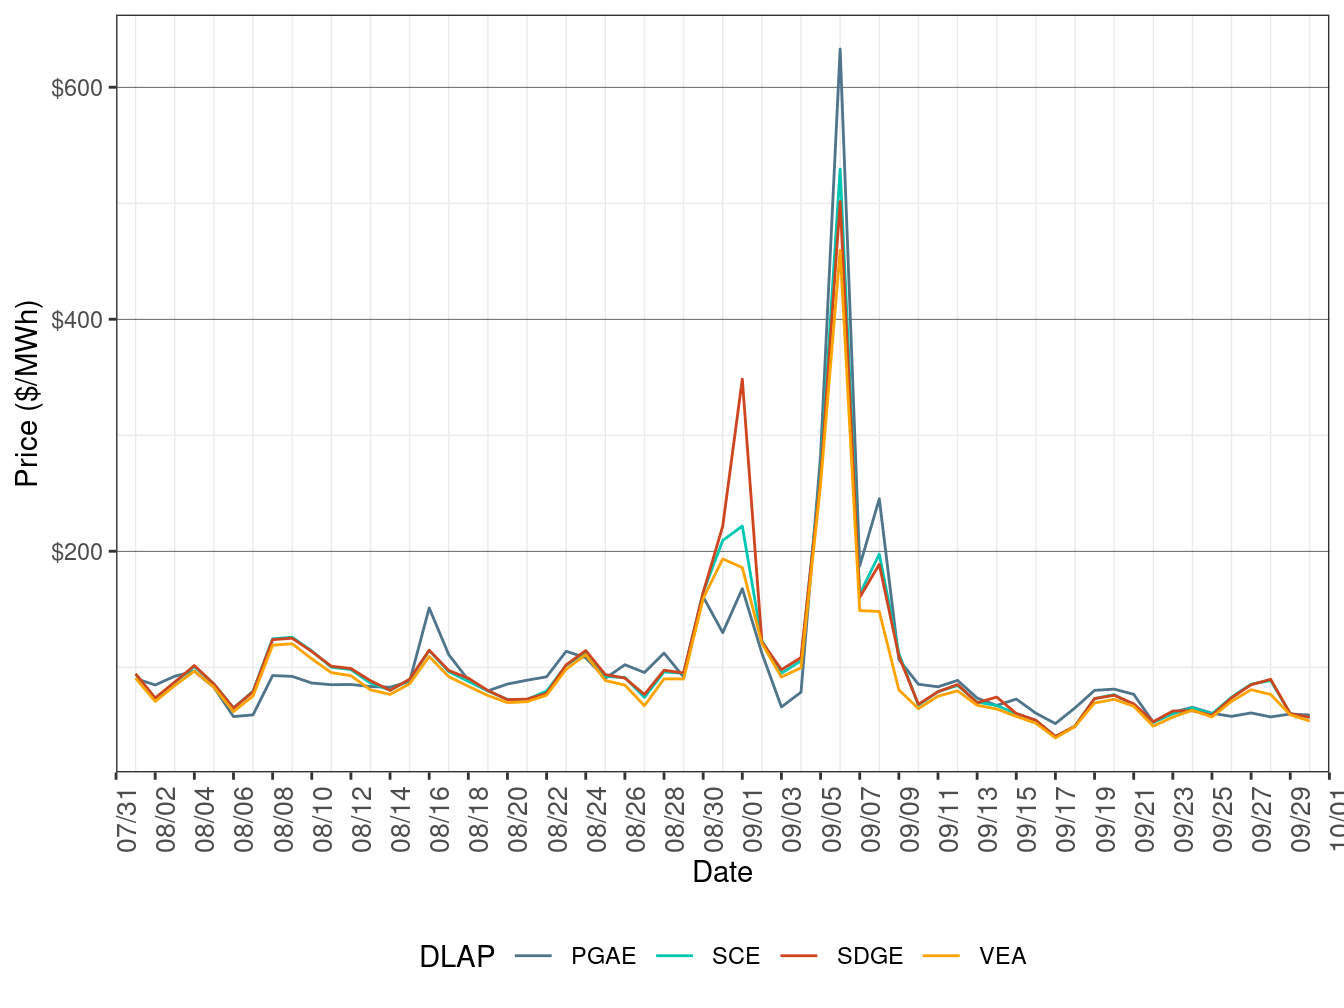
Figure 2 show the daily simple average load-aggregation points (LAP) prices for each of the four default LAPs (PG&E, SCE, SDG&E, and VEA) for all hours. Table 2 below lists the binding constraints along with the associated DLAP locations and the dates when the binding constraints resulted in relatively high or low DLAP prices. All four DLAP LMPs were elevated in the first nine days of September due to high loads driven by the heat wave.
Figure 2: Day-Ahead Simple Average LAP Prices (All Hours)
| DLAP | Dates | Transmission Constraint |
|---|---|---|
| SDGE | September 6-8 | 7430_Summer_KTTLM_GATES_70_1, 7430_Summer_GIFFEN_GIFFENT_70_1 |
Real-Time Price
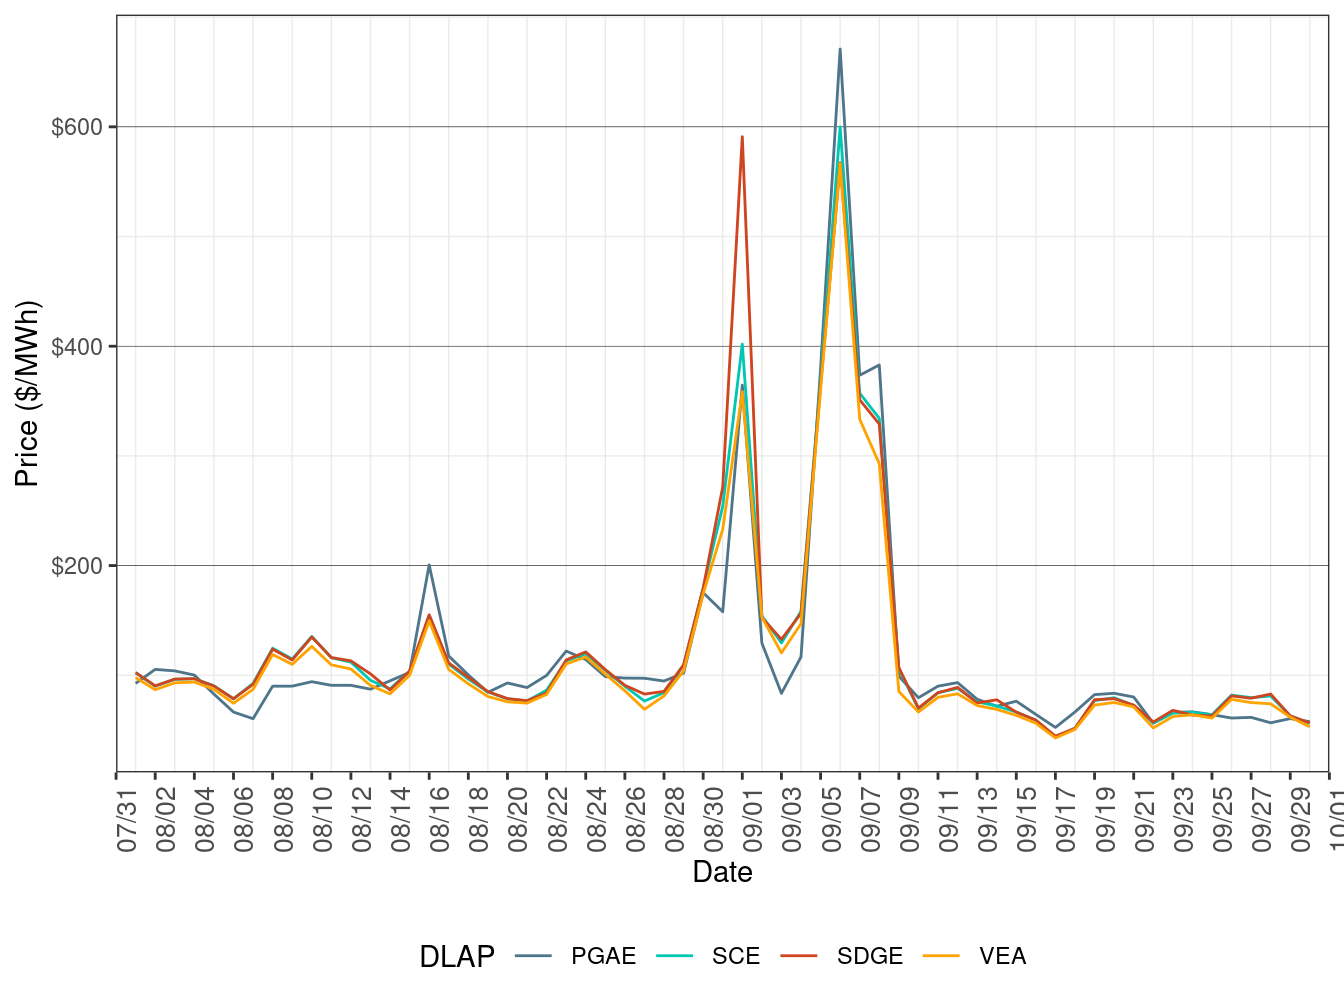
Figure 3 show daily simple average LAP prices for all the default LAPs (PG&E, SCE, SDG&E, and VEA) for all hours respectively in FMM. Table 3 lists the binding constraints along with the associated DLAP locations and the dates when the binding constraints resulted in relatively high or low DLAP prices. The first nine days of September saw elevated prices for all four DLAPs when system loads were high driven by high temperatures.
Figure 3: FMM Simple Average LAP Prices (All Hours)
| DLAP | Dates | Transmission Constraint |
|---|---|---|
| SDGE | September 1 | SUNCREST-SUNCREST-230 XFMR |
| PGAE | September 6 | 6110_COI_N_S |
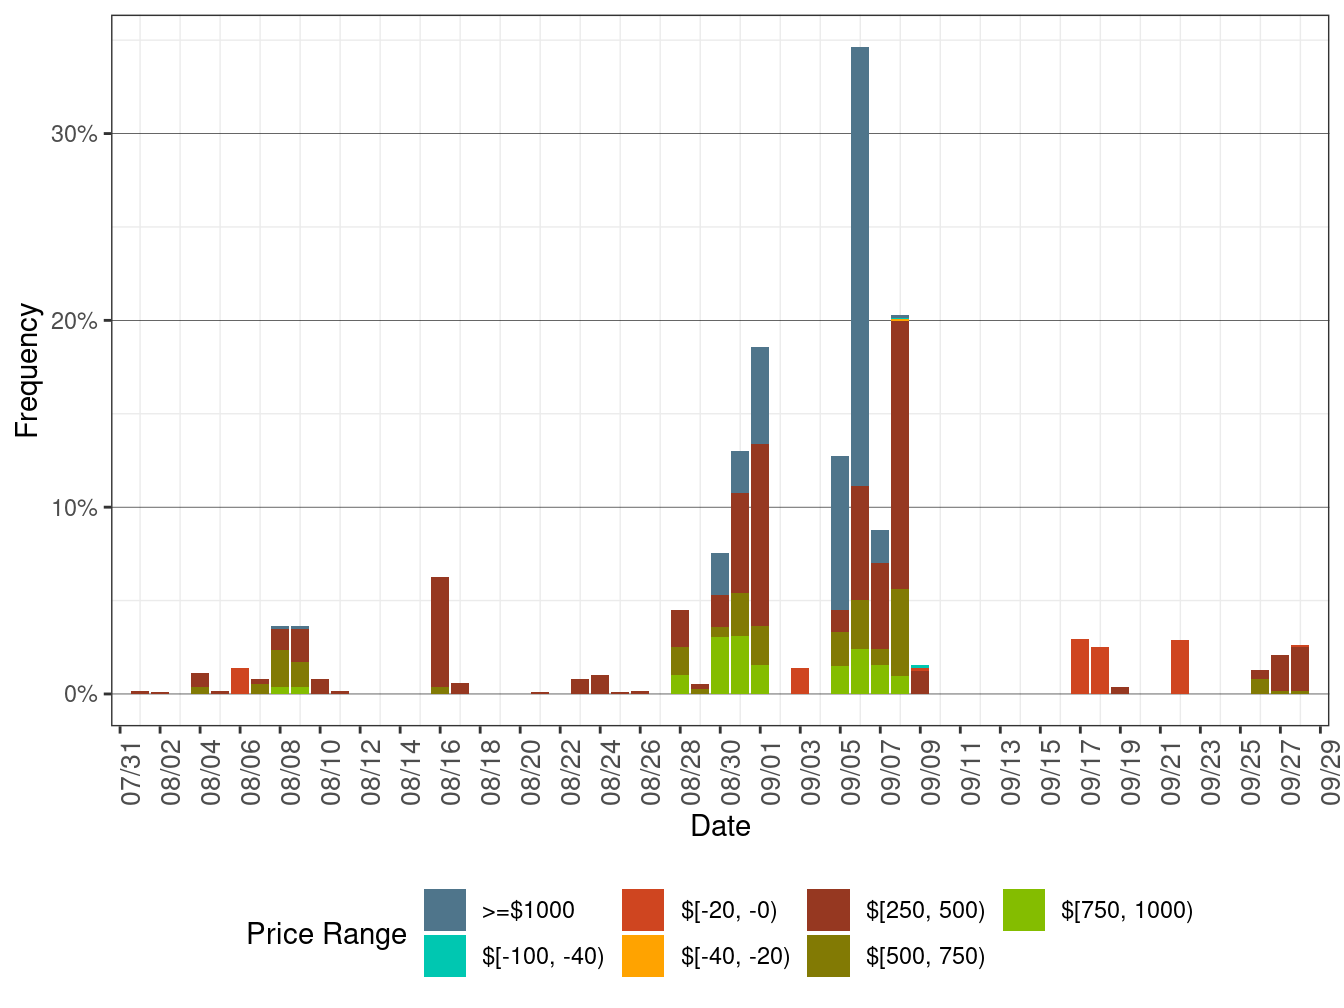
Figure 4 below shows the daily frequency of positive price spikes and negative prices by price range for the default LAPs in the FMM. The cumulative frequency of prices above $250/MWh increased to 4.98 percent in September from 2.32 percent in August. The cumulative frequency of negative prices edged up to 0.02 percent in September from 0.01 percent in August.
Figure 4: Daily Frequency of FMM LAP Positive Price Spikes and Negative Prices
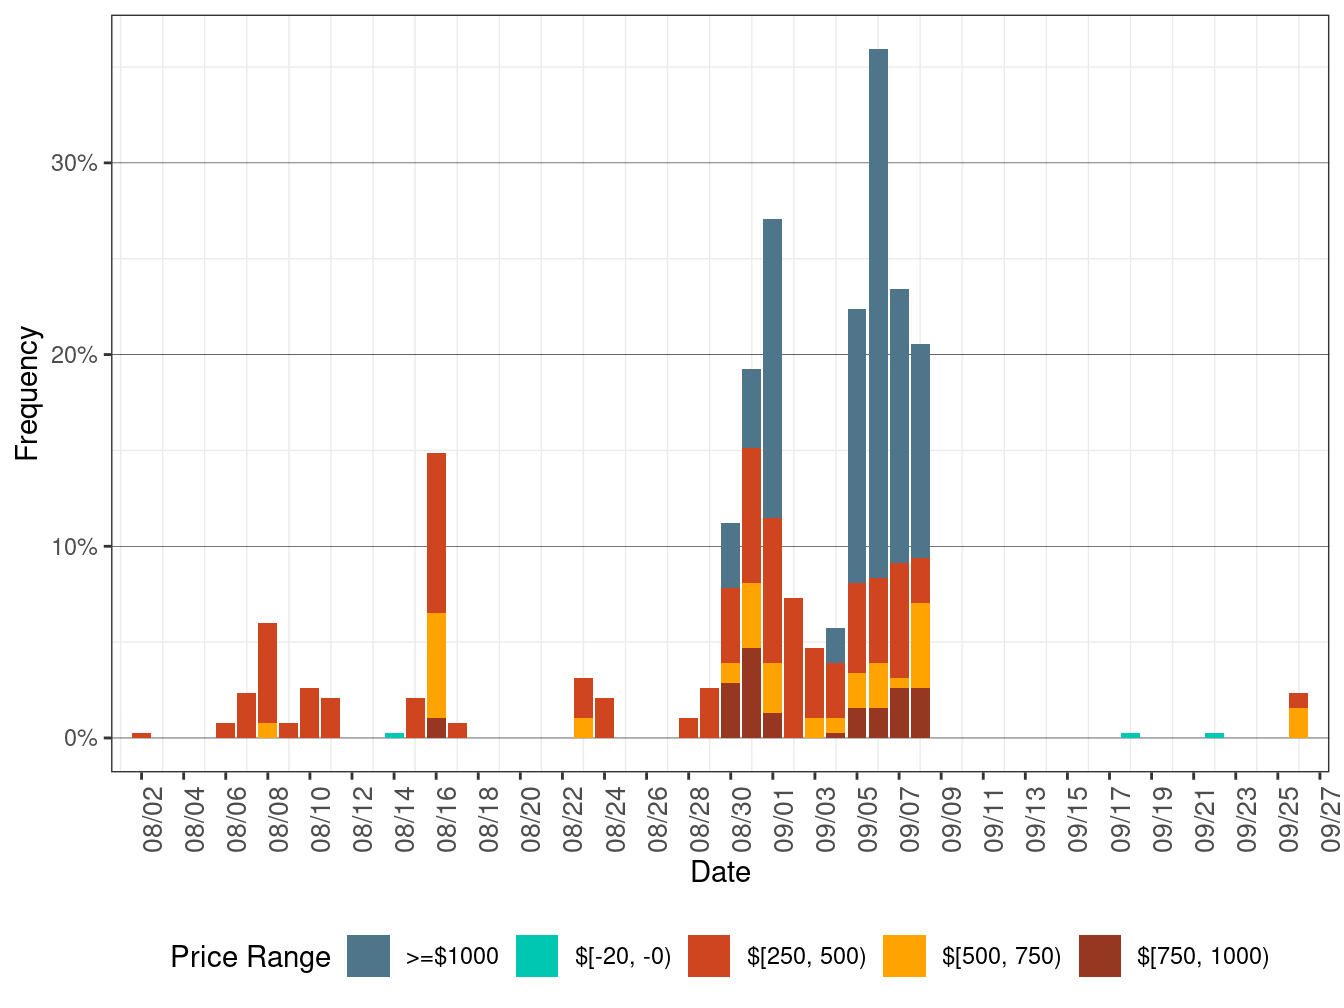
Figure 5 show daily simple average LAP prices for all the default LAPs (PG&E, SCE, SDG&E, and VEA) for all hours respectively in RTD. TABLE 4 lists the binding constraints along with the associated DLAP locations and the dates when the binding constraints resulted in relatively high or low DLAP prices. The prices for all four DLAPs were elevated in the first nine days of September when system loads were high driven by high temperatures.
Figure 5: RTD Simple Average LAP Prices (All Hours)
| DLAP | Dates | Transmission Constraint |
|---|---|---|
| SDGE | September 1 | SUNCREST-SUNCREST-230 XFMR |
| PGAE | September 6 | 6110_COI_N_S |
Figure 4 below shows the daily frequency of positive price spikes and negative prices by price range for the default LAPs in RTD. The cumulative frequency of prices above $250/MWh increased to 3.41 percent in September from 1.46 percent in August. The cumulative frequency of negative prices increased to 0.34 percent in September from 0.04 percent in August.
Figure 6: Daily Frequency of RTD LAP Positive Price Spikes and Negative Prices