1 Market Characteristics
Loads
Figure 1 shows system peak load.
Peak loads for ISO area increased generally in July compared to the previous month driven by hot weather, exceeding 40,000 MW for 15 days in this month
Figure 1: System Peak Load
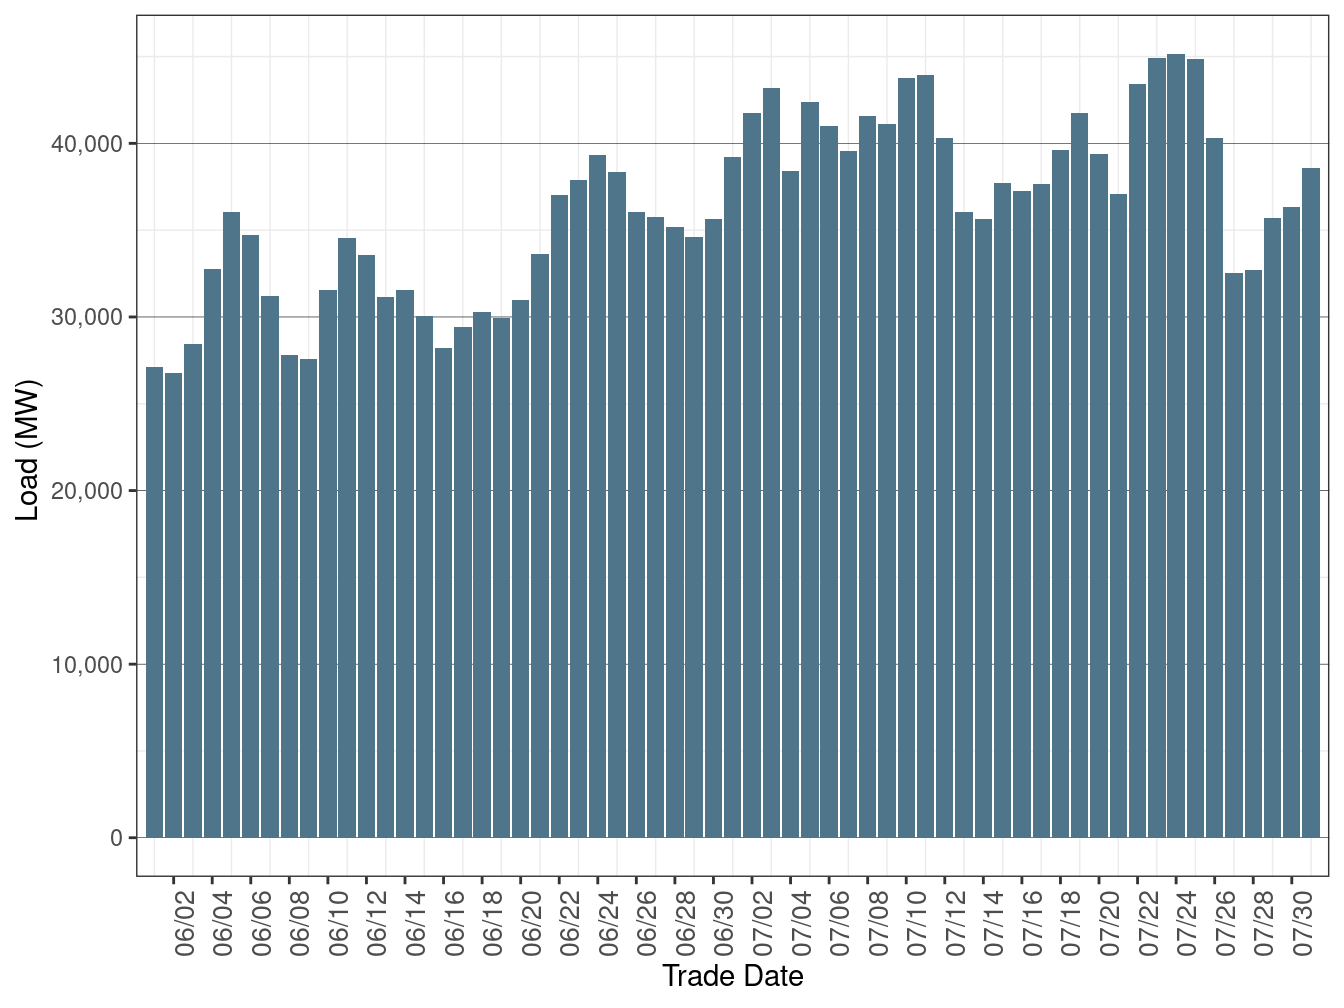
Figure 1 shows system peak load.
Peak loads for ISO area increased generally in July compared to the previous month driven by hot weather, exceeding 40,000 MW for 15 days in this month
Figure 1: System Peak Load