3 Market Performance Metrics
Day-Ahead Prices
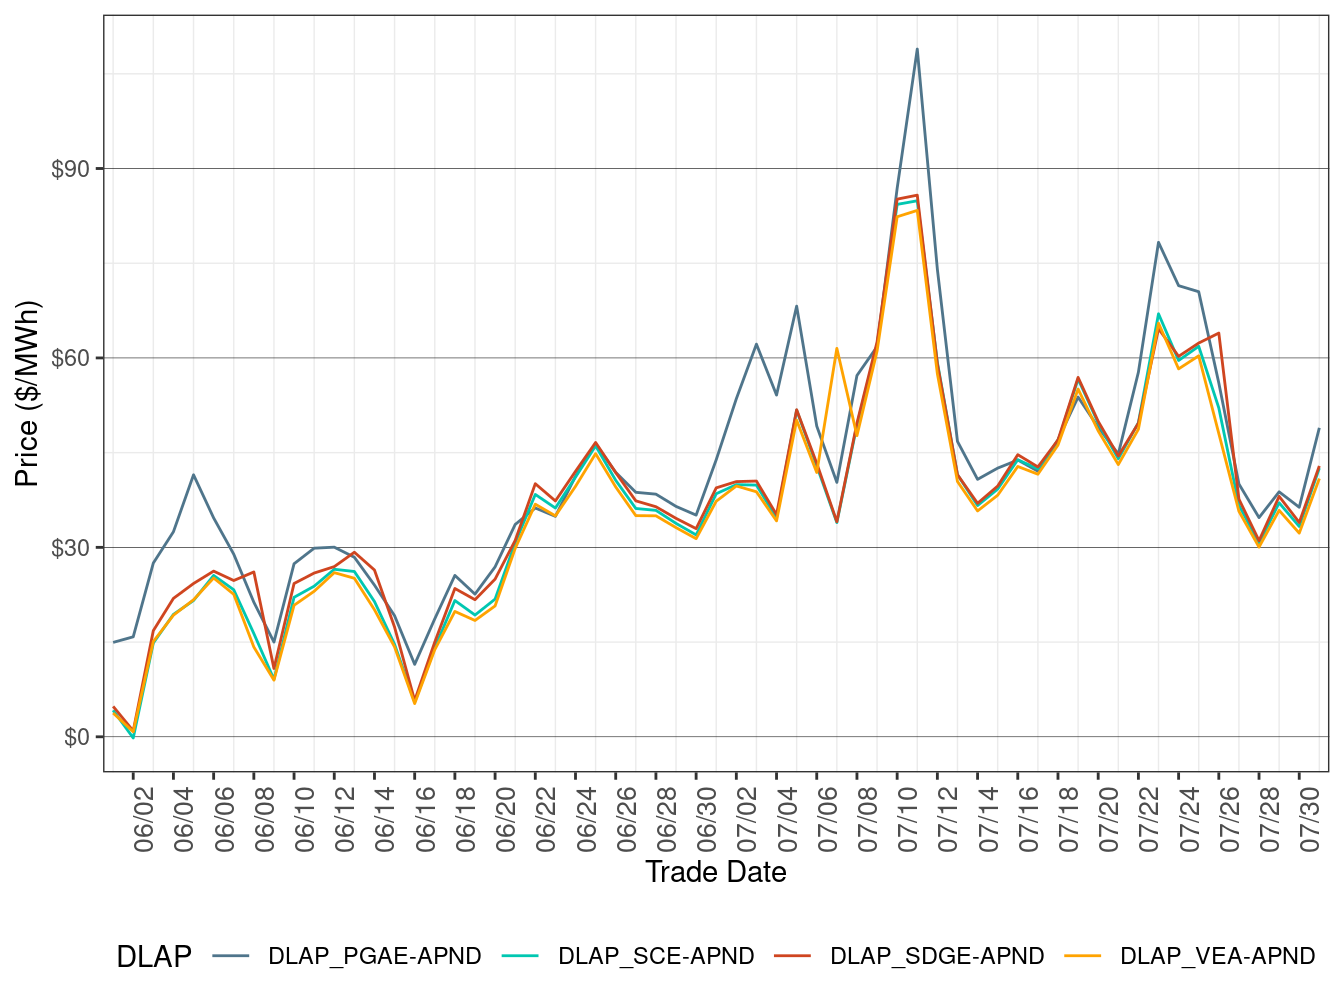
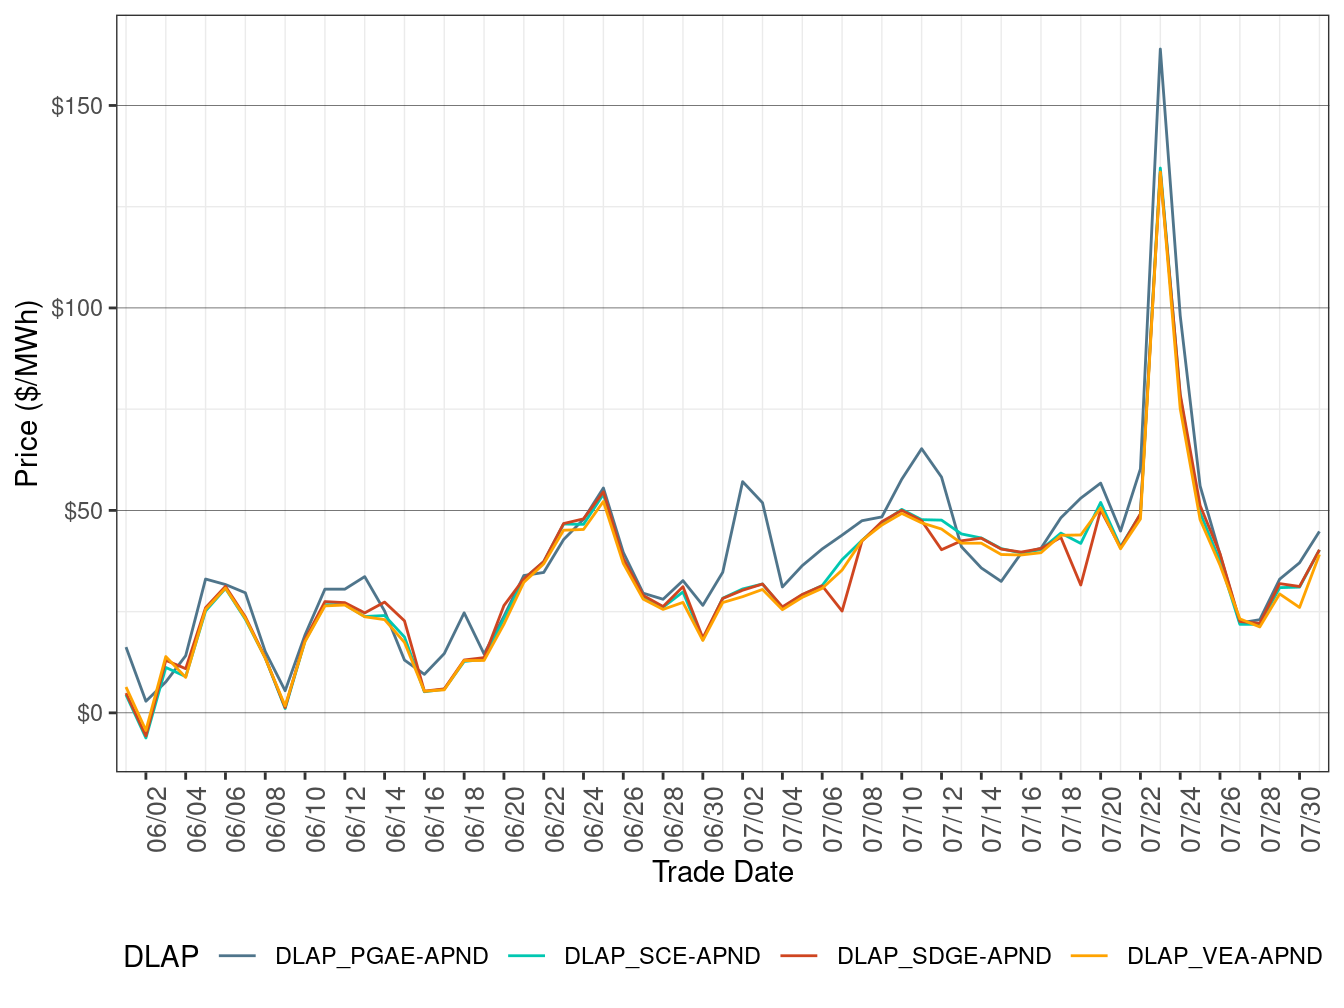
Figure 2 shows the daily simple average prices for all hours in IFM for each of the four default load-aggregation points (DLAP): PG&E, SCE, SDG&E, and VEA.
Day-Ahead DLAP prices on average increased this month compared to June. All four DLAP LMPs increased on July 10 and 11 due to high demand.
TABLE 3 below lists the binding constraints that resulted in relatively high or low DLAP prices on certain dates.
Figure 2: IFM (Day-Ahead) Simple Average DLAP Prices (All Hours)
| DLAP LMPs Affected | Dates | Transmission Constraint |
|---|---|---|
| PGAE | July 3-5, 12, 23-25 | RIO OSO-RIO OSO-115 kV XFMR |
Real-Time Price
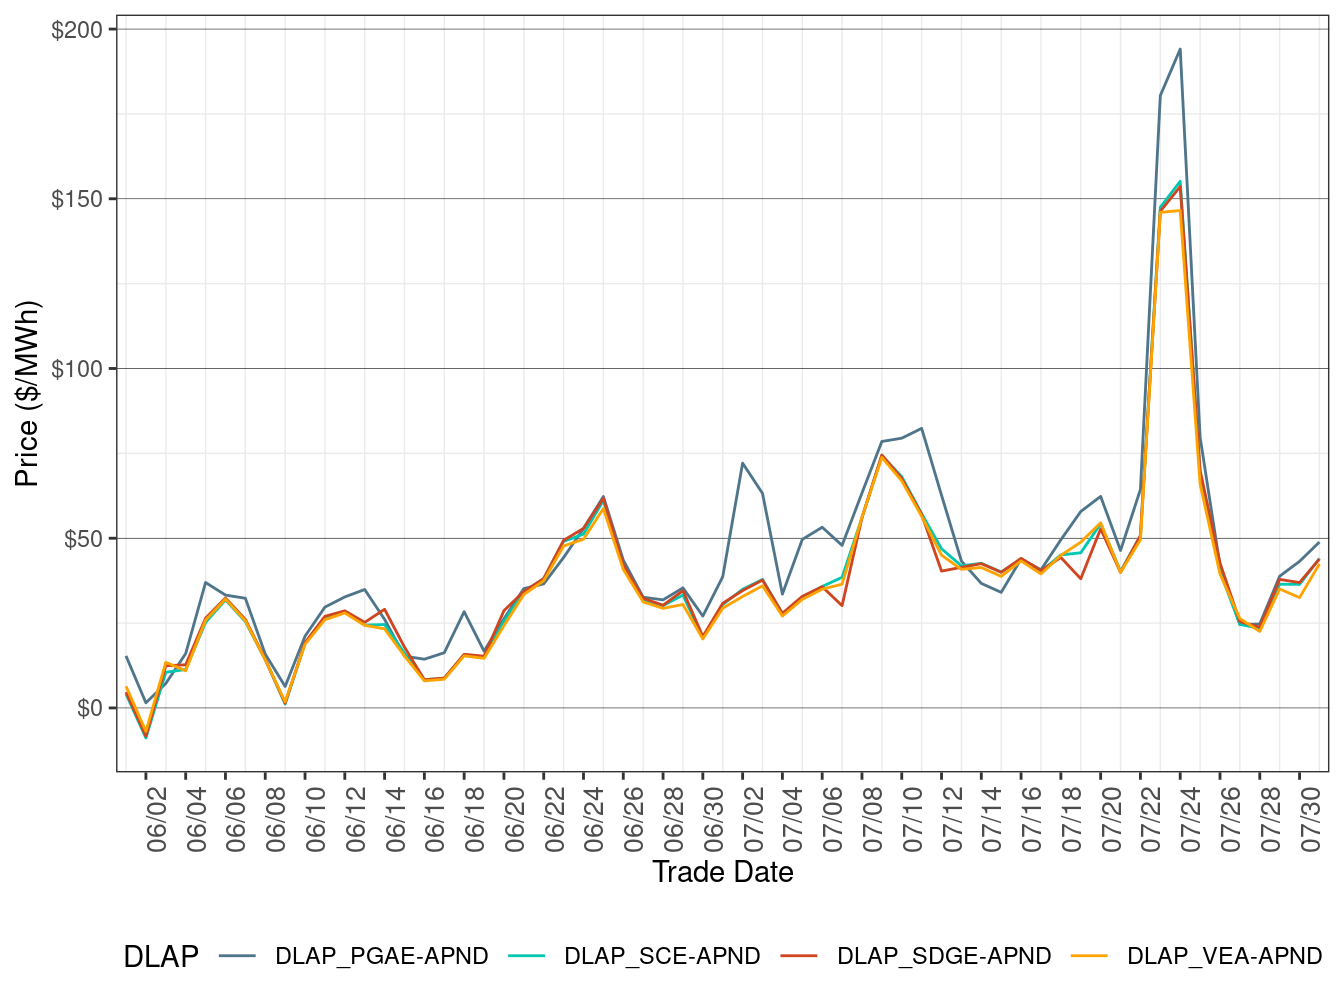
Figure 3 shows daily simple average prices for all four DLAPs (PG&E, SCE, SDG&E, and VEA) for all hours respectively in FMM.
FMM DLAP prices on average increased compared to the previous month. All four DLAP LMPs spiked on July 23 and 24 due to high demand, transmission congestion and tight supply during the the heat wave.
TABLE 4 below lists the binding constraints that resulted in relatively high or low DLAP prices on certain dates.
Figure 3: FMM Simple Average DLAP Prices (All Hours)
| DLAP LMPs Affected | Dates | Transmission Constraint |
|---|---|---|
| PGAE | July 2-3 | COTTNWD-ROUND MT-230kV line; VASONA-METCALF-230kV line |
| PGAE | July 5 | TULUCAY-VACA DIX-230kV line; VASONA-METCALF-230kV line |
| PGAE | July 6 | MOSSLD-LASAGUIL-230kV line; VASONA-METCALF-230kV line |
| PGAE | July 10-12 | 7430_CP6_NG nomogram |
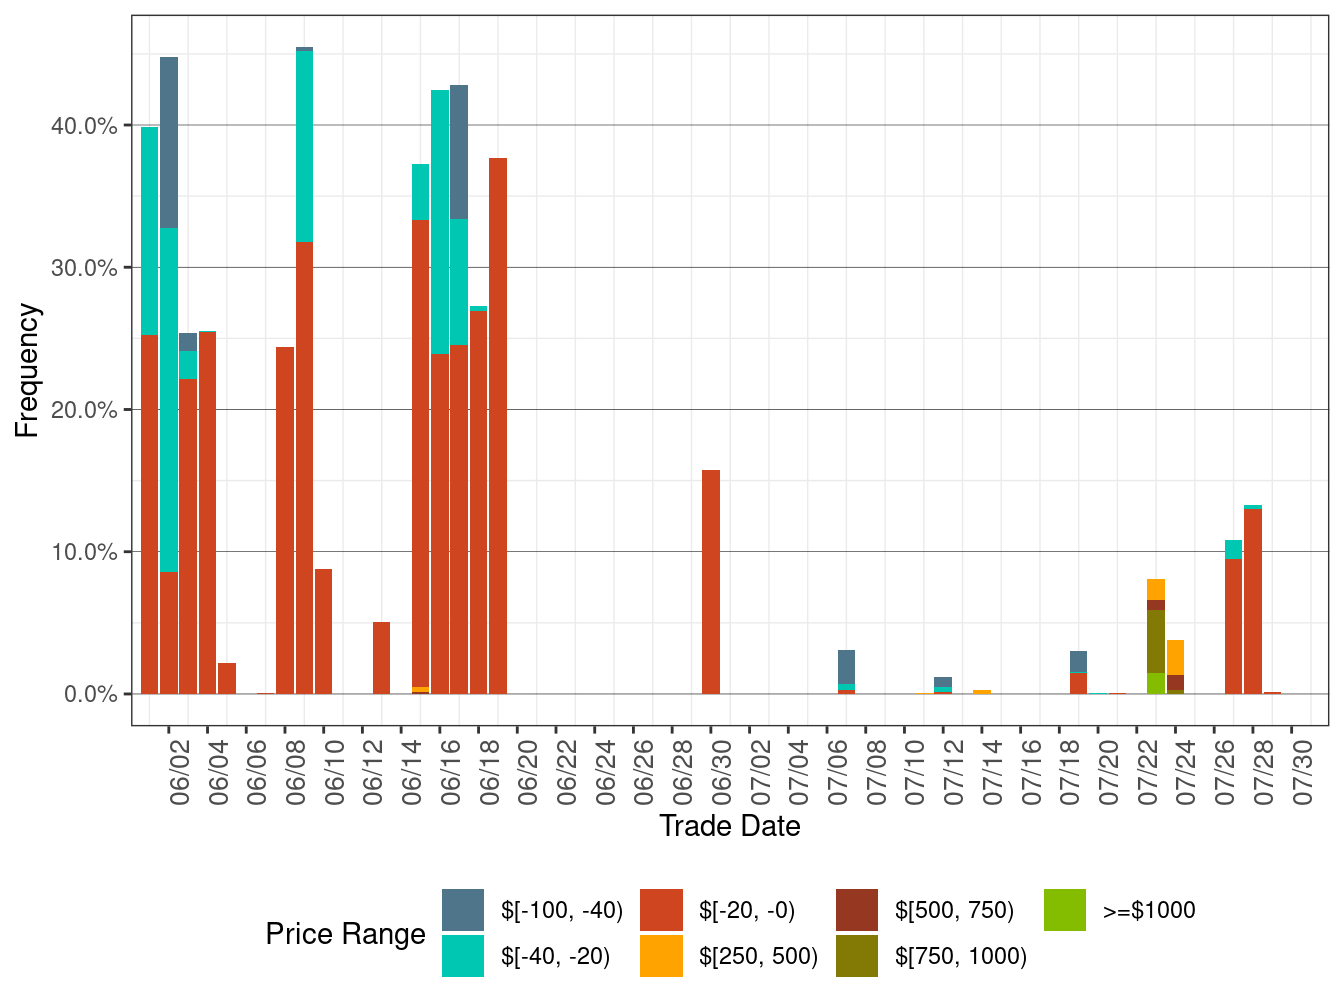
Figure 4 below shows the daily frequency of positive price spikes and negative prices by price range for the DLAPs in the FMM.
The cumulative frequency of prices in FMM above $250/MWh increased to 1.67 percent in July from 0.03 percent in the previous month, while the cumulative frequency of negative prices dropped to 0.72 percent in July from 13.10 percent in the previous month.
Figure 4: Daily Frequency of FMM DLAP Positive Price Spikes and Negative Prices
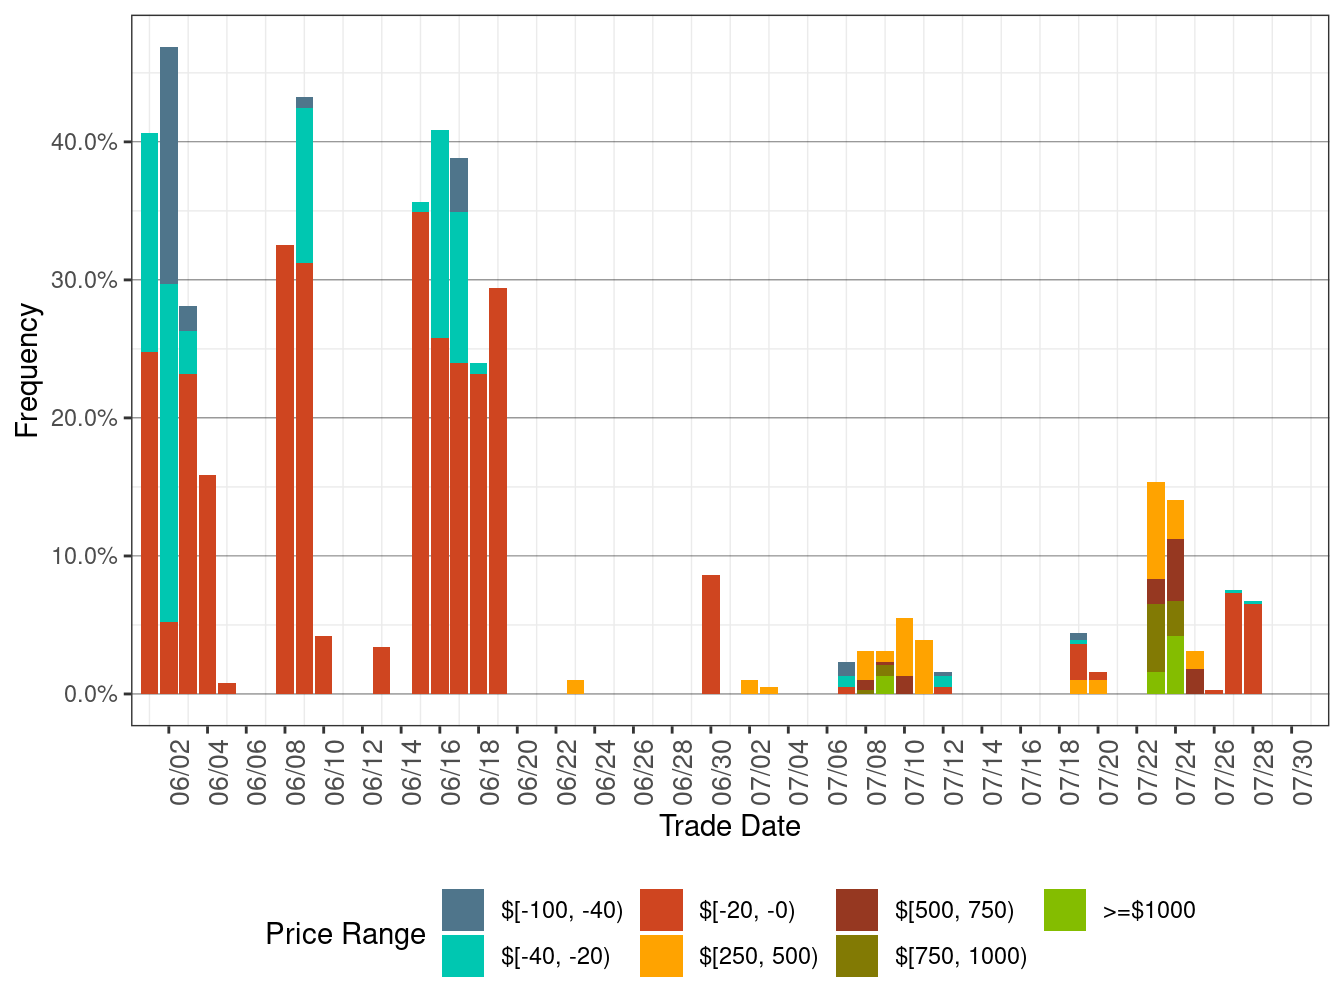
Figure 5 shows daily simple average prices for all the DLAPs (PG&E, SCE, SDG&E, and VEA) for all hours respectively in RTD.
RTD DLAP prices increased in July compared to the previous month. All four DLAP LMPs spiked on July 23 and 24 due to high demand, transmission congestion and tight supply during the the heat wave.
TABLE 5 below lists the binding constraints that resulted in relatively high or low DLAP prices on certain dates.
Figure 5: RTD Simple Average DLAP Prices (All Hours)
| DLAP LMPs Affected | Dates | Transmission Constraint |
|---|---|---|
| PGAE | July 2 | COTTNWD-ROUND MT-230kV line; MUSTANGS-GATES-230kV line |
| PGAE | July 3 | COTTNWD-ROUND MT-230kV line; VASONA-METCALF-230kV line |
| PGAE | July 11-12 | 7430_CP6_NG nomogram |
Figure 6 below shows the daily frequency of positive price spikes and negative prices by price range for the DLAPs in RTD.
The cumulative frequency of prices in RTD above $250/MWh inched up to 0.39 percent in July from 0.02 percent in the previous month, while the cumulative frequency of negative prices fell to 1.03 percent in July from 14.13 percent in the previous month.
Figure 6: Daily Frequency of RTD DLAP Positive Price Spikes and Negative Prices