13 Market Performance Metrics
Day-Ahead Prices
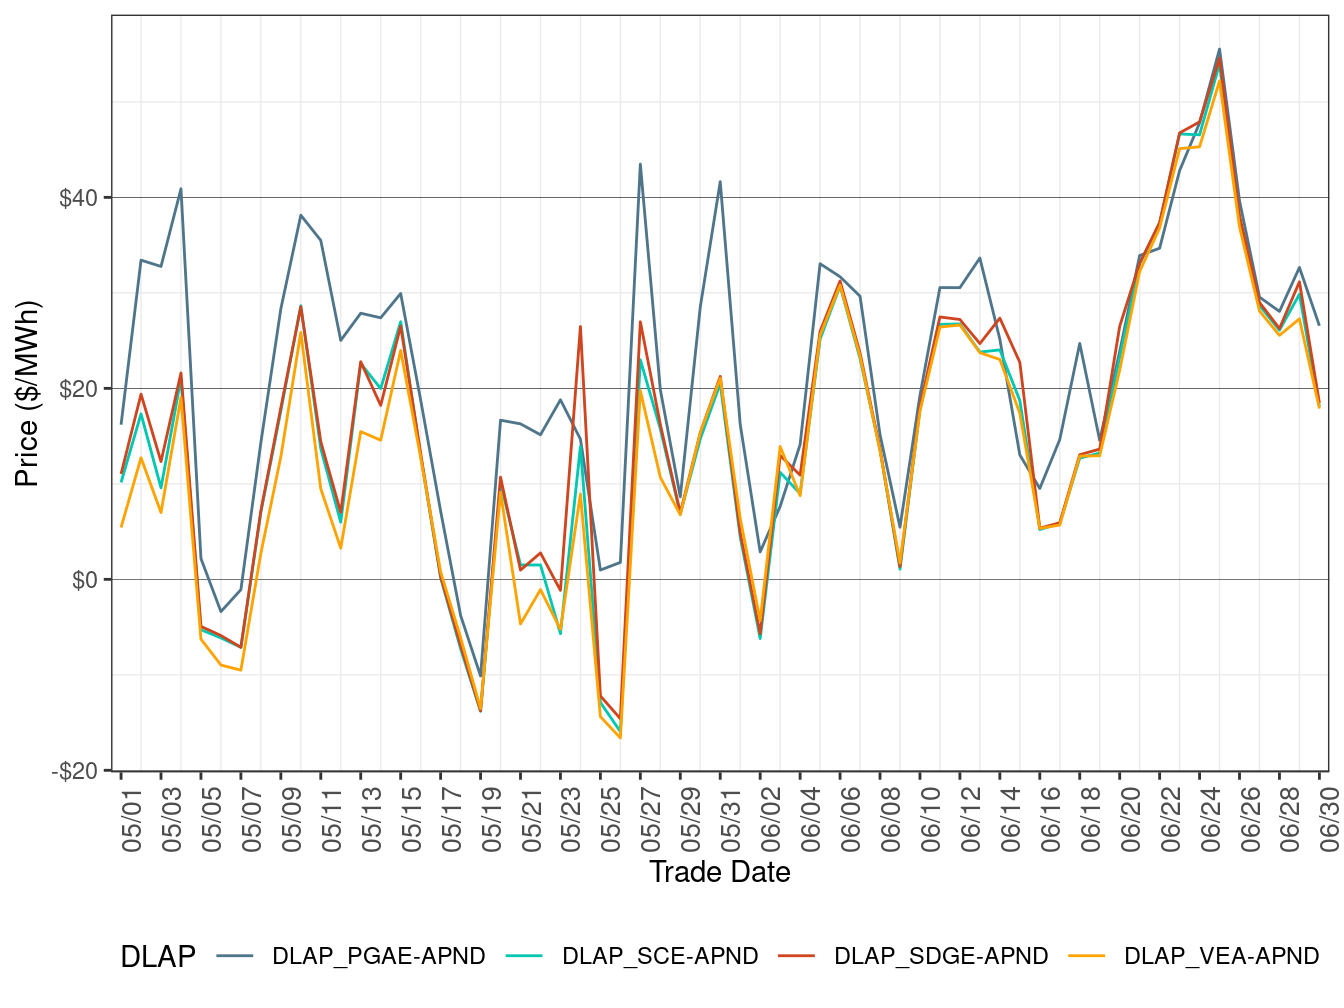
Figure 115, Figure 116 and Figure 117 show the daily simple average prices for peak hours, off-peak hours, and all hours, respectively, in the day-ahead market for each of the four default load-aggregation points (DLAP): PG&E, SCE, SDG&E, and VEA.
Figure 115: Day-Ahead Simple Average DLAP Prices (On-Peak Hours)
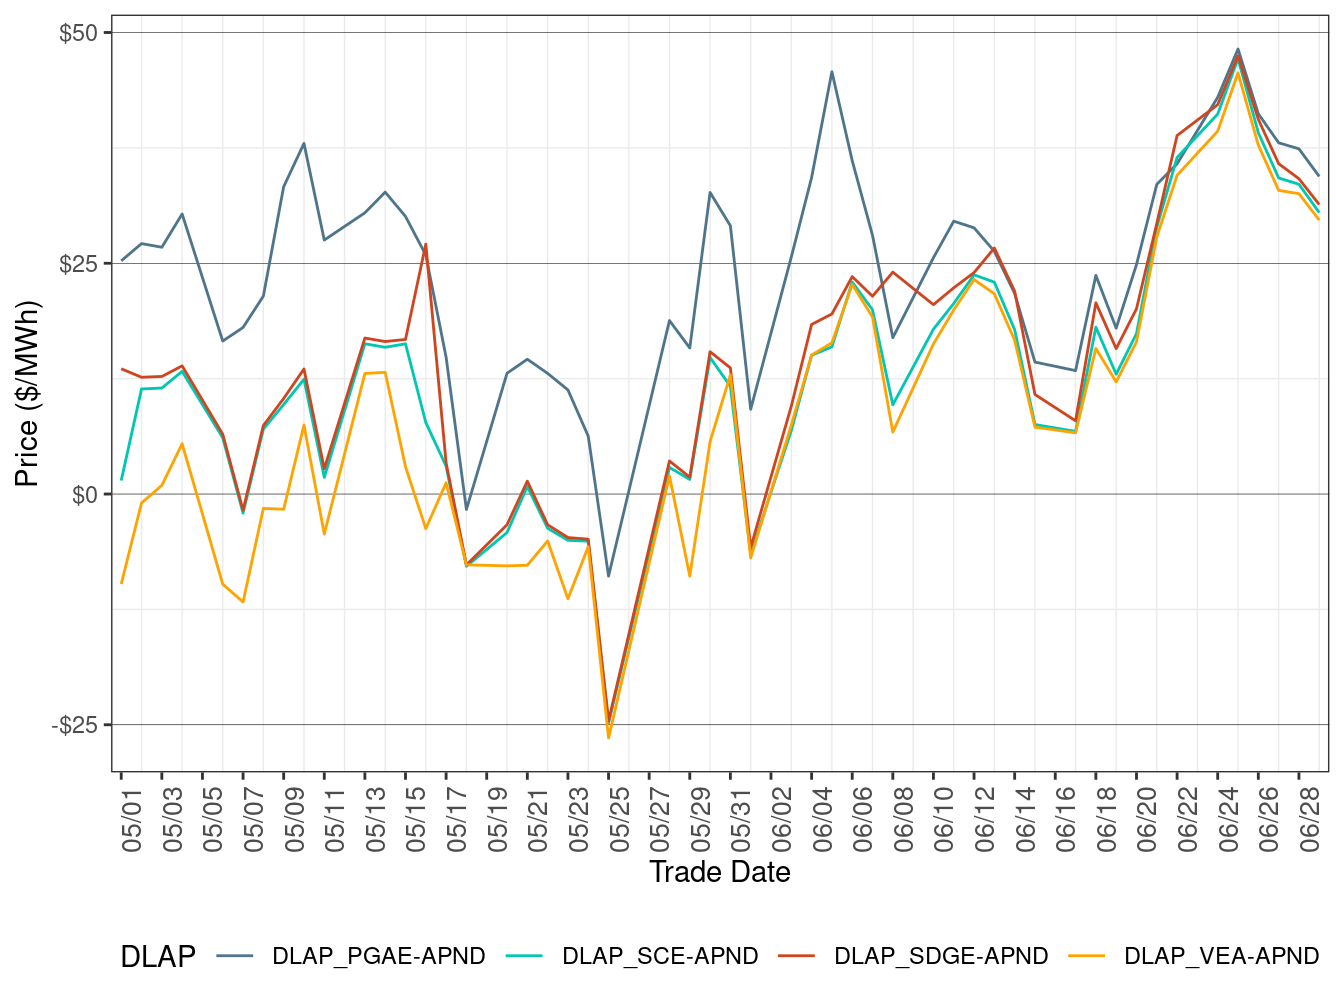
Figure 116: Day-Ahead Simple Average DLAP Prices (Off-Peak Hours)
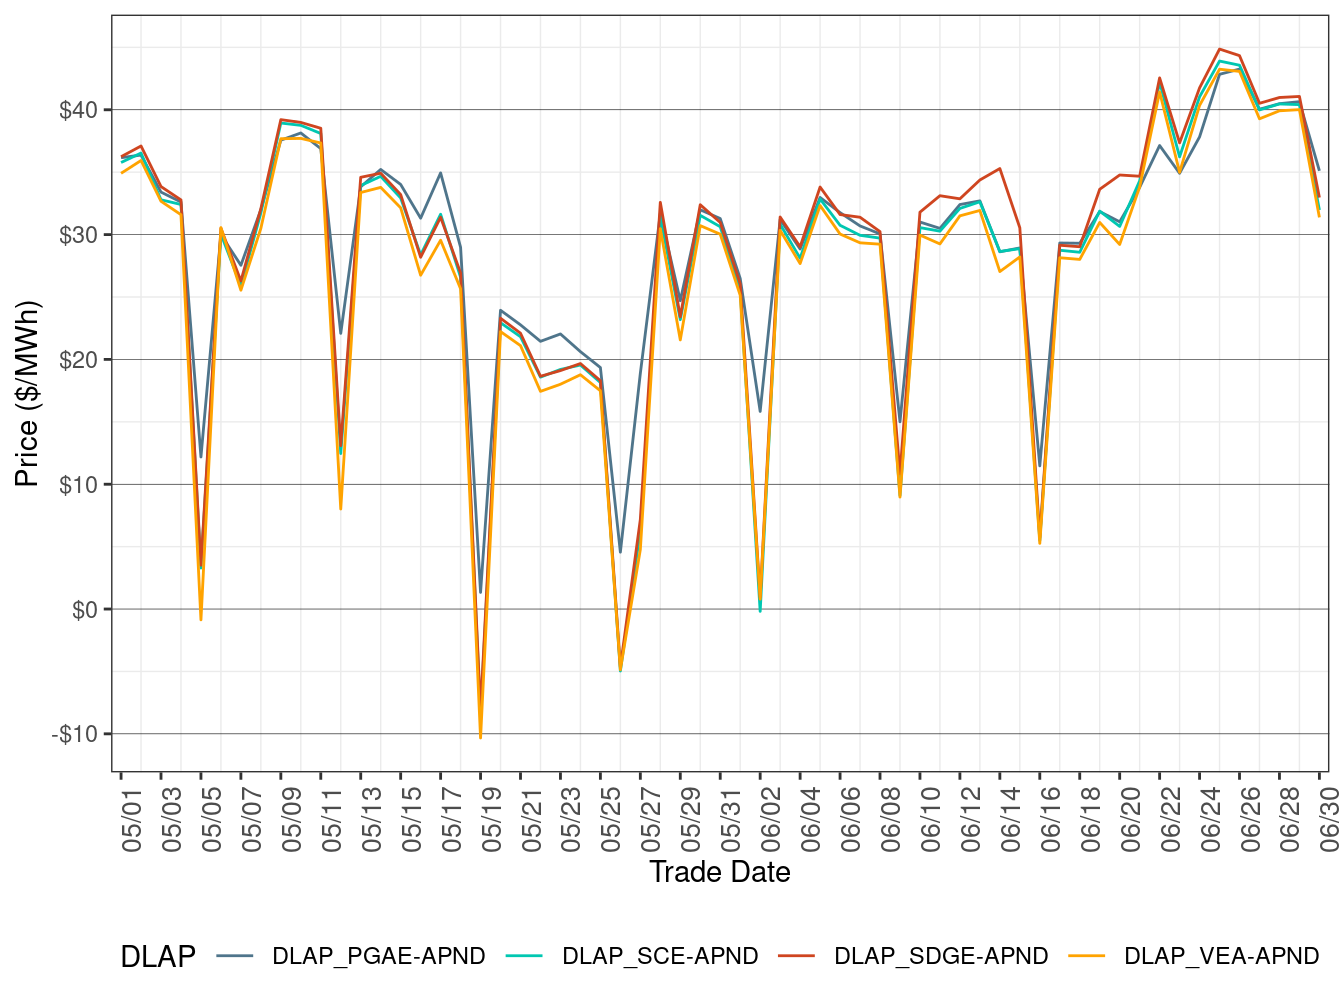
Figure 117: Day-Ahead Simple Average DLAP Prices (All Hours)
Real-Time Prices
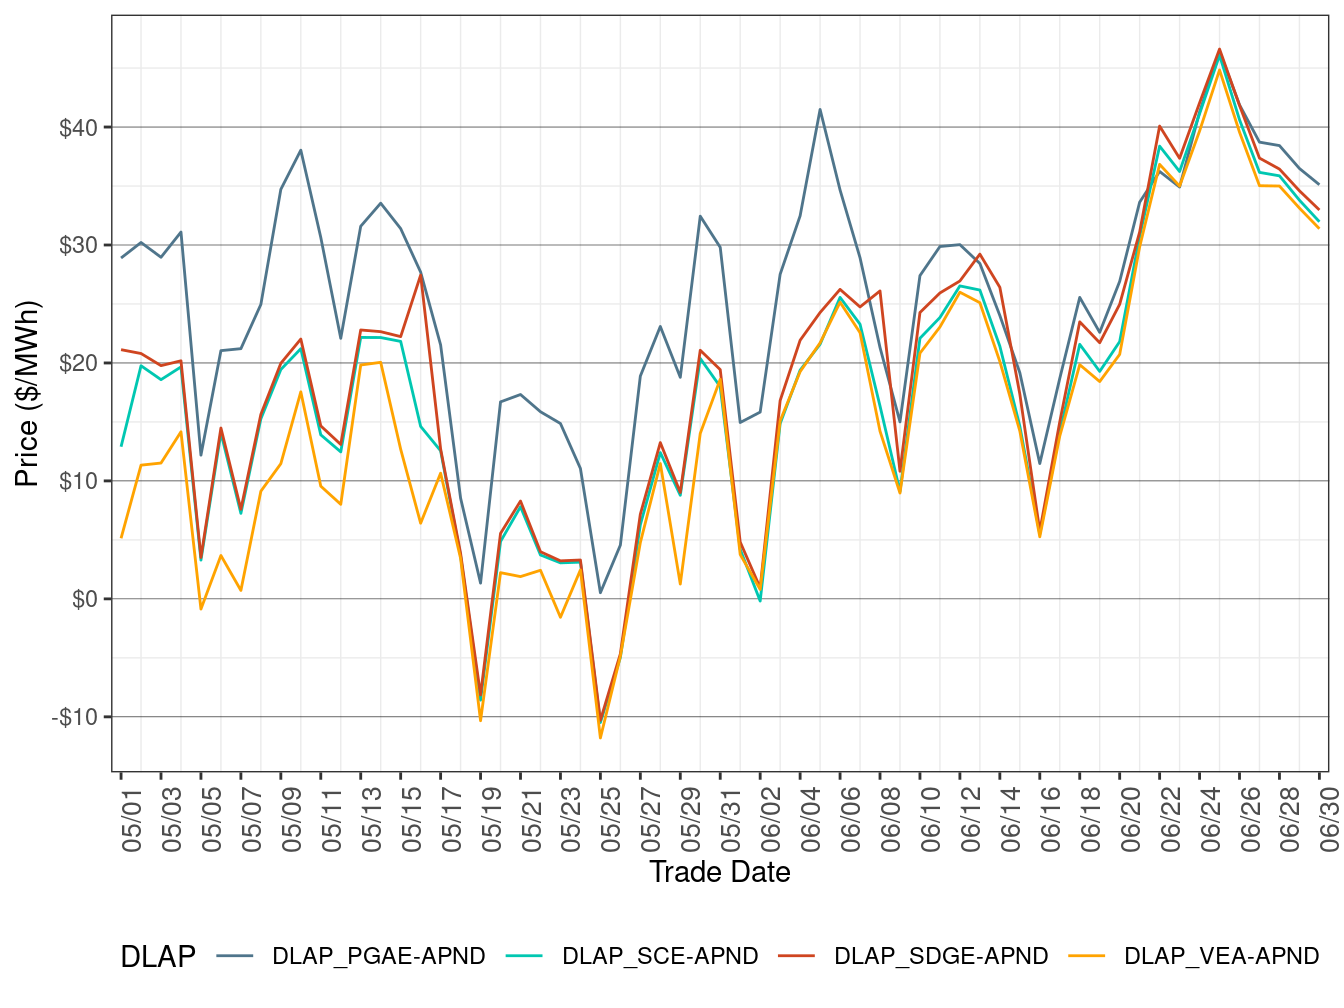
Figure 118, Figure 119 and Figure 120 show daily simple average prices for all four DLAPs for peak hours, off-peak hours, and all hours respectively in FMM.
Figure 121, Figure 122 and Figure 123 show daily simple average prices for each of the four DLAPs for peak hours, off-peak hours, and all hours respectively in RTD.
Figure 118: FMM Simple Average DLAP Prices (On-Peak Hours)
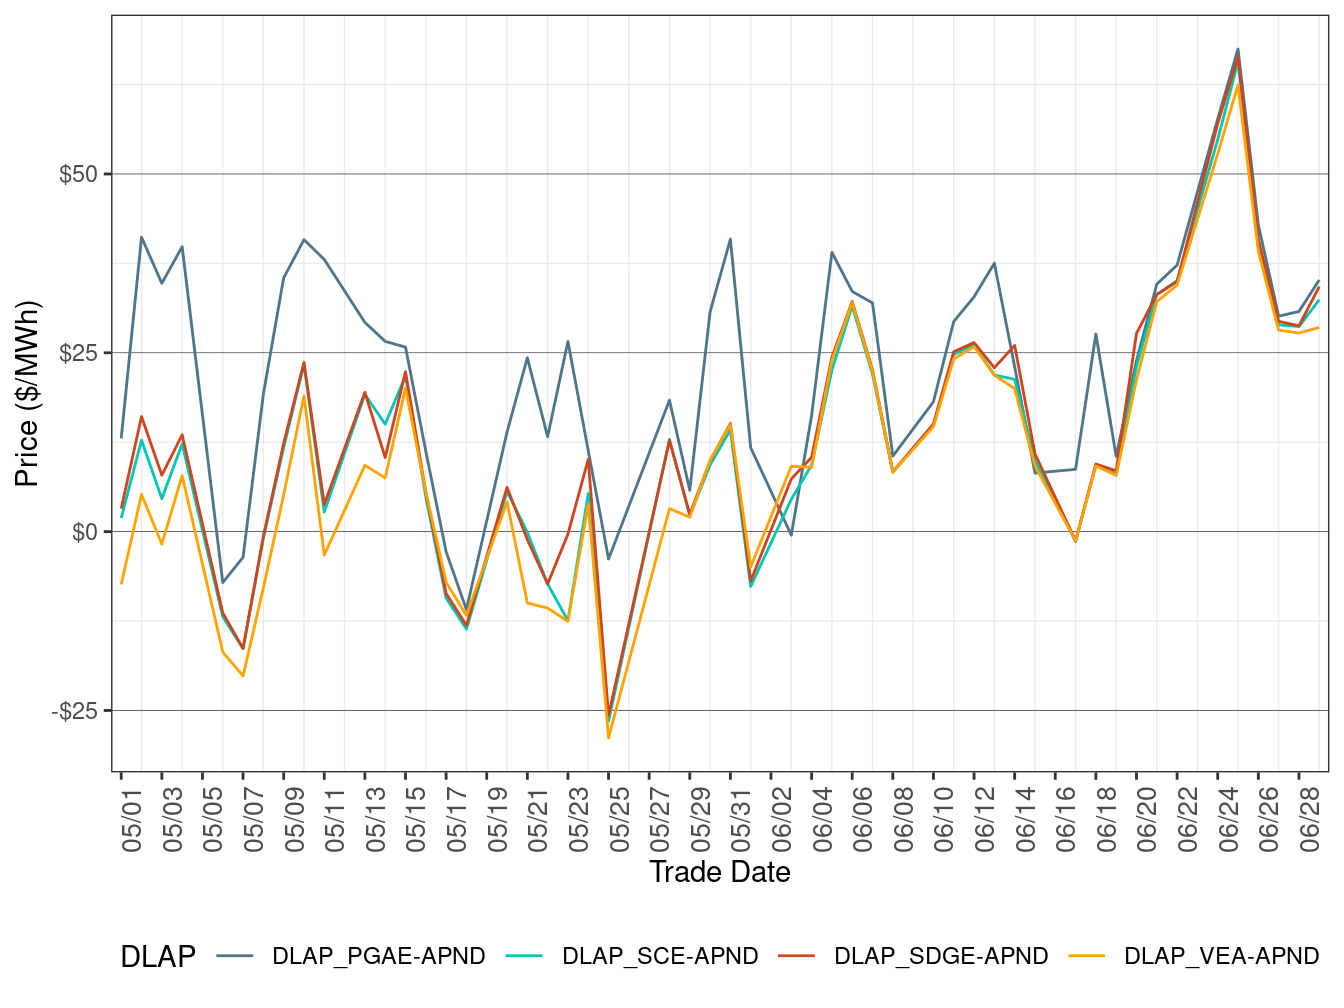
Figure 119: FMM Simple Average DLAP Prices (Off-Peak Hours)
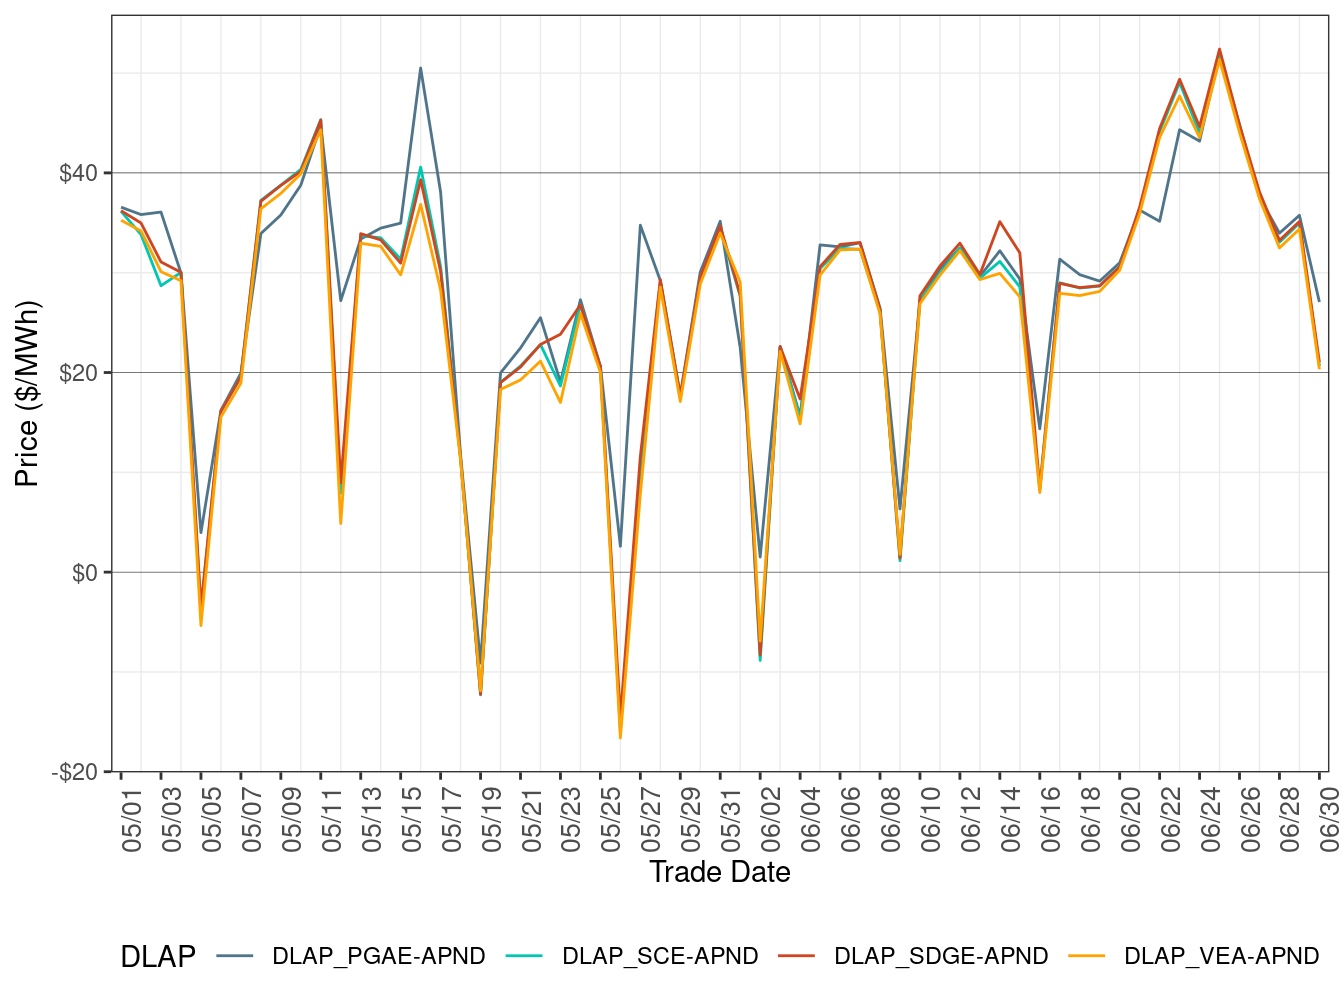
Figure 120: FMM Simple Average DLAP Prices (All Hours)
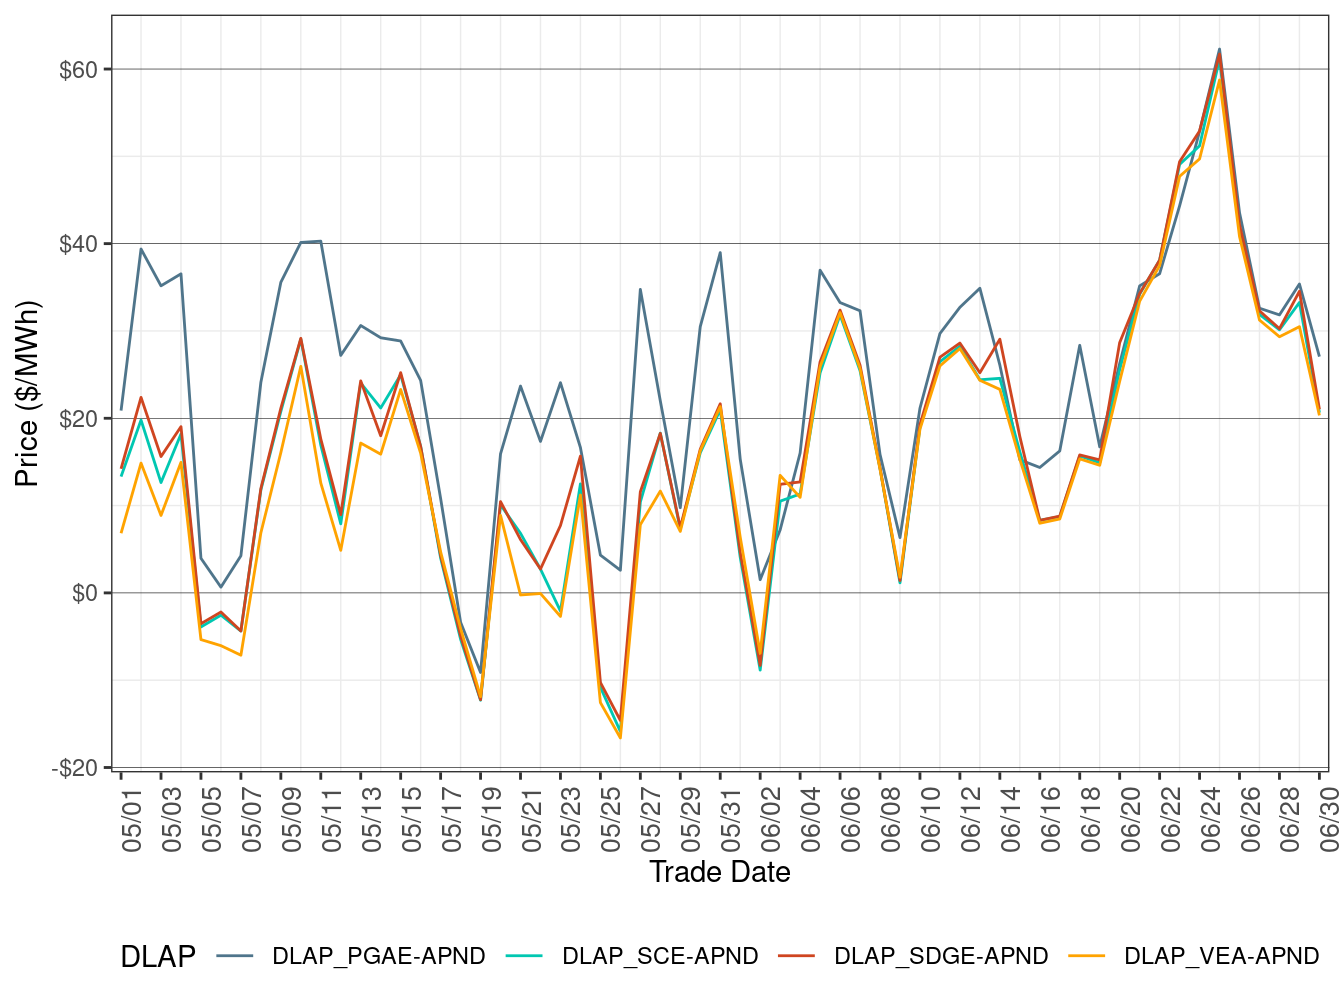
Figure 121: RTD Simple Average DLAP Prices (On-Peak Hours)
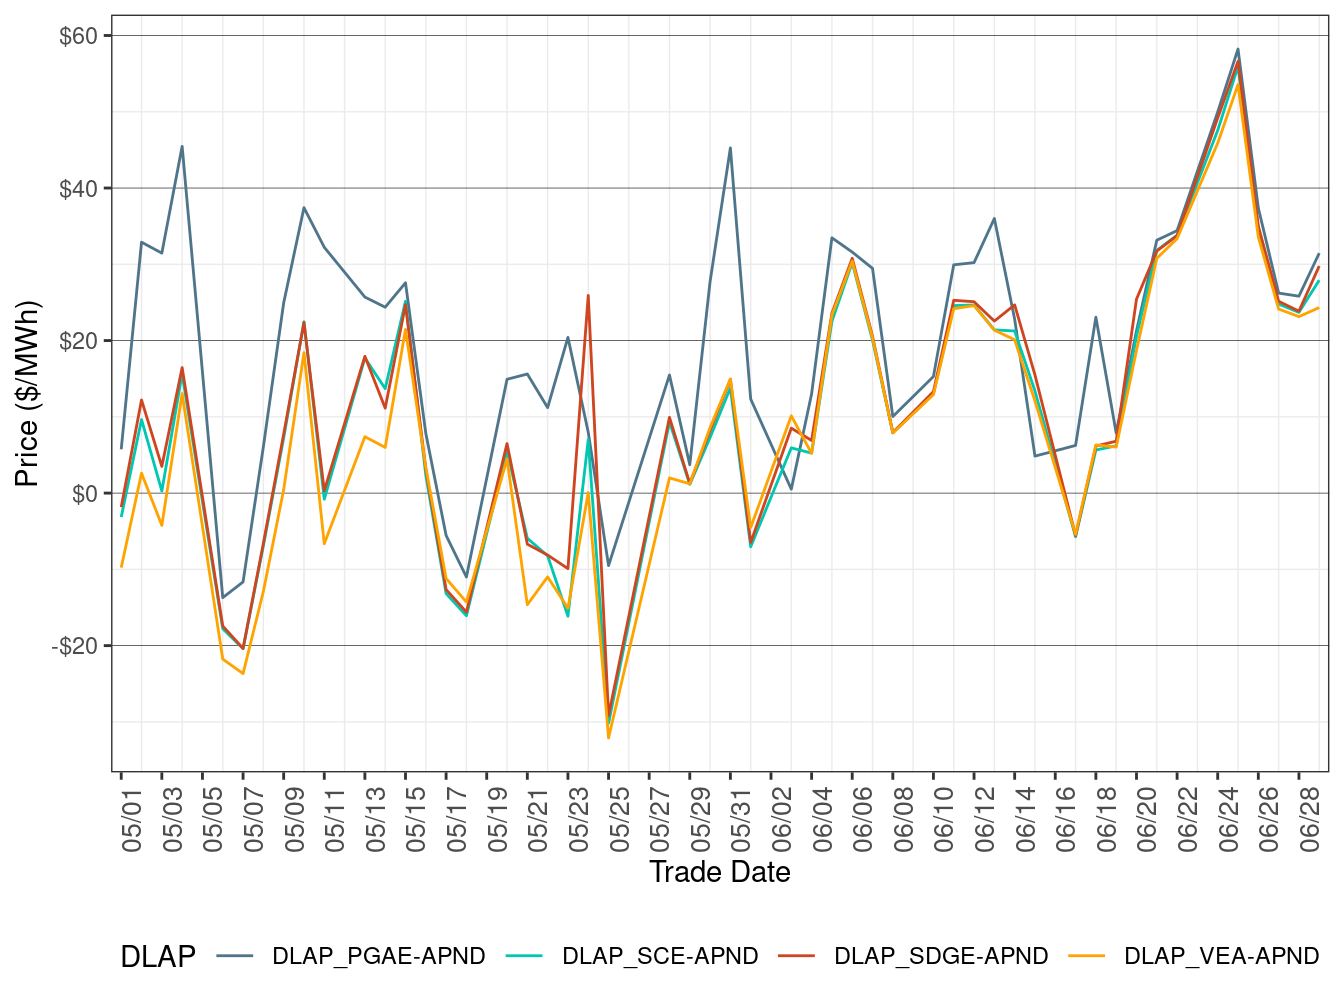
Figure 122: RTD Simple Average DLAP Prices (Off-Peak Hours)
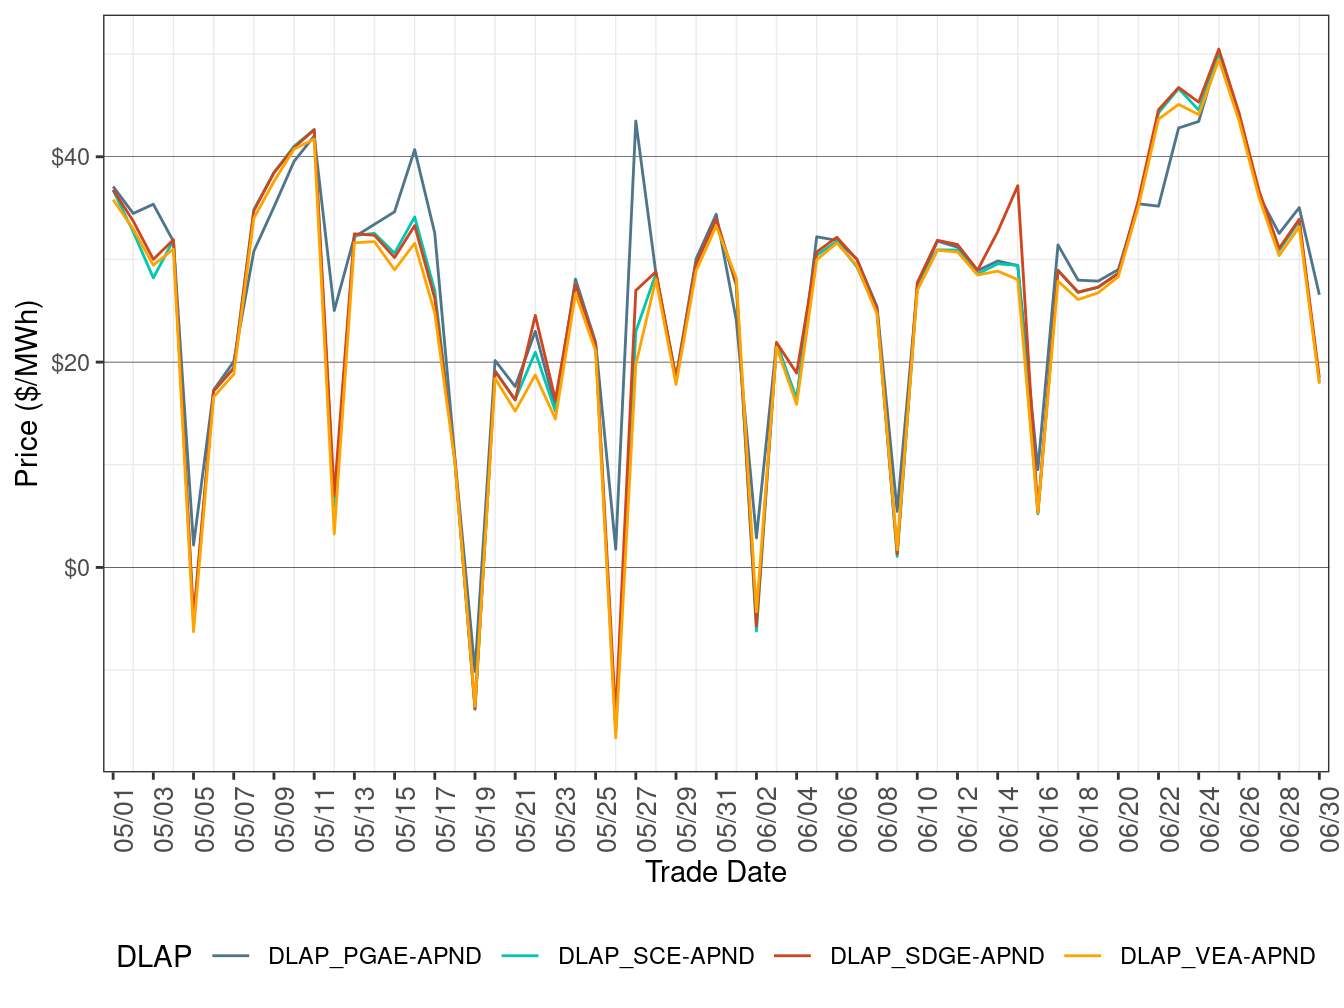
Figure 123: RTD Simple Average DLAP Prices (All Hours)
Price Convergence
Price convergence is measured by the difference between day-ahead (DA) and real-time dispatch (RTD) prices. Generally speaking, the smaller the difference between the prices, the more convergent the prices are. Figure 124, Figure 125, and Figure 126 show the difference between DA daily average price and RTD daily average price for three default LAPs in all hours, peak hours, and off-peak hours respectively. A positive value indicates higher RTD prices compared to DA prices.
DA daily simple average price for each of the three default LAPs is calculated as the following:
\[ \ P_i = \sum_{i}\frac{LMP_{ij}}{K} \quad where \quad i = PGAE , \ SCE \ and\ SDGE \] \(P_i\) is the daily average price for LAP i while j represents the hour (peak, off-peak,or all). K is the count of the hours in one day.
The formula for RTD DLAP daily average price is :
\[ \ P_i = \sum_j\sum_h\frac{LMP_{ijh}}{N} \quad where \quad i = PGAE , \ SCE \ and \ SDGE \] \(P_i\) is the daily average price for LAP i while j represents the hour (peak, off-peak, or all) and h represents 5-minute interval. N is the count of the intervals in one day. The similar methods are applied to calculate the DA and RTD weekly average prices for default LAPs.
Figure 124: Daily DLAP Price Difference (All Hours)
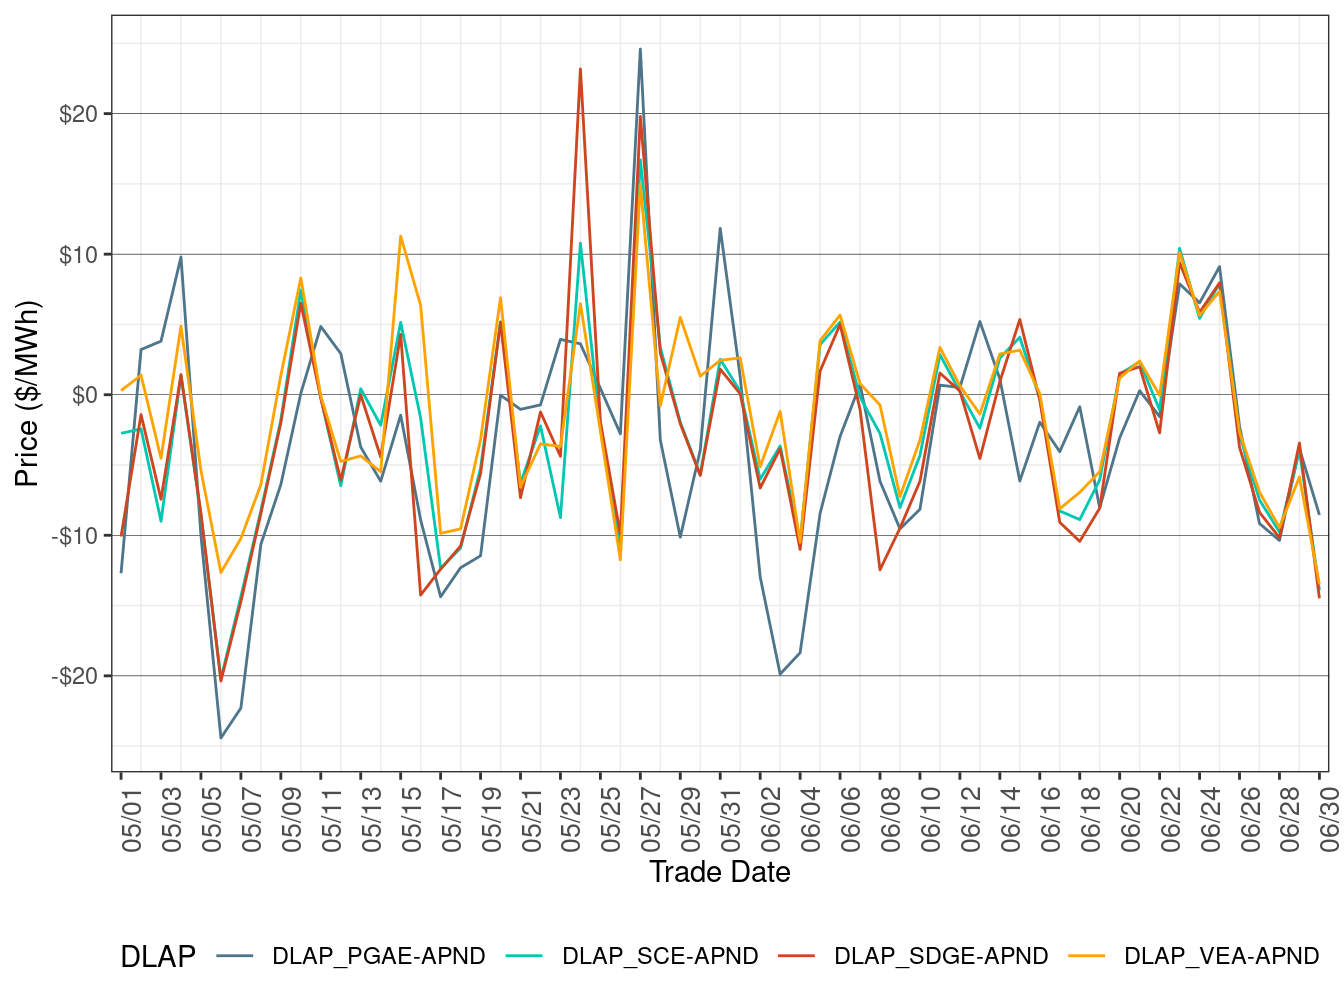
Figure 125: Daily DLAP Price Difference (On-Peak Hours)
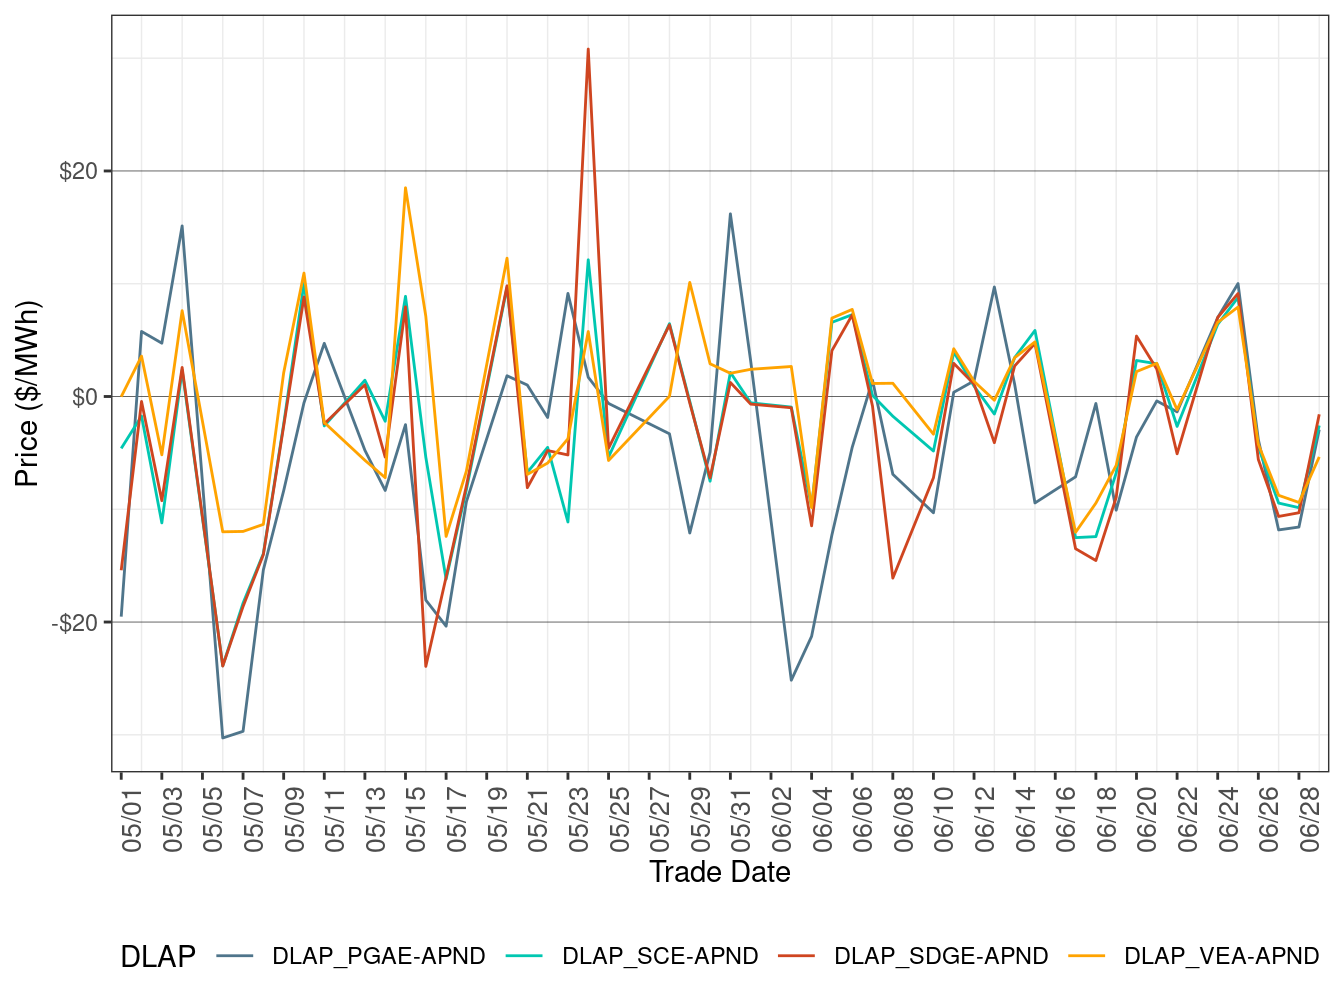
Figure 126: Daily DLAP Price Difference (Off-Peak Hours)
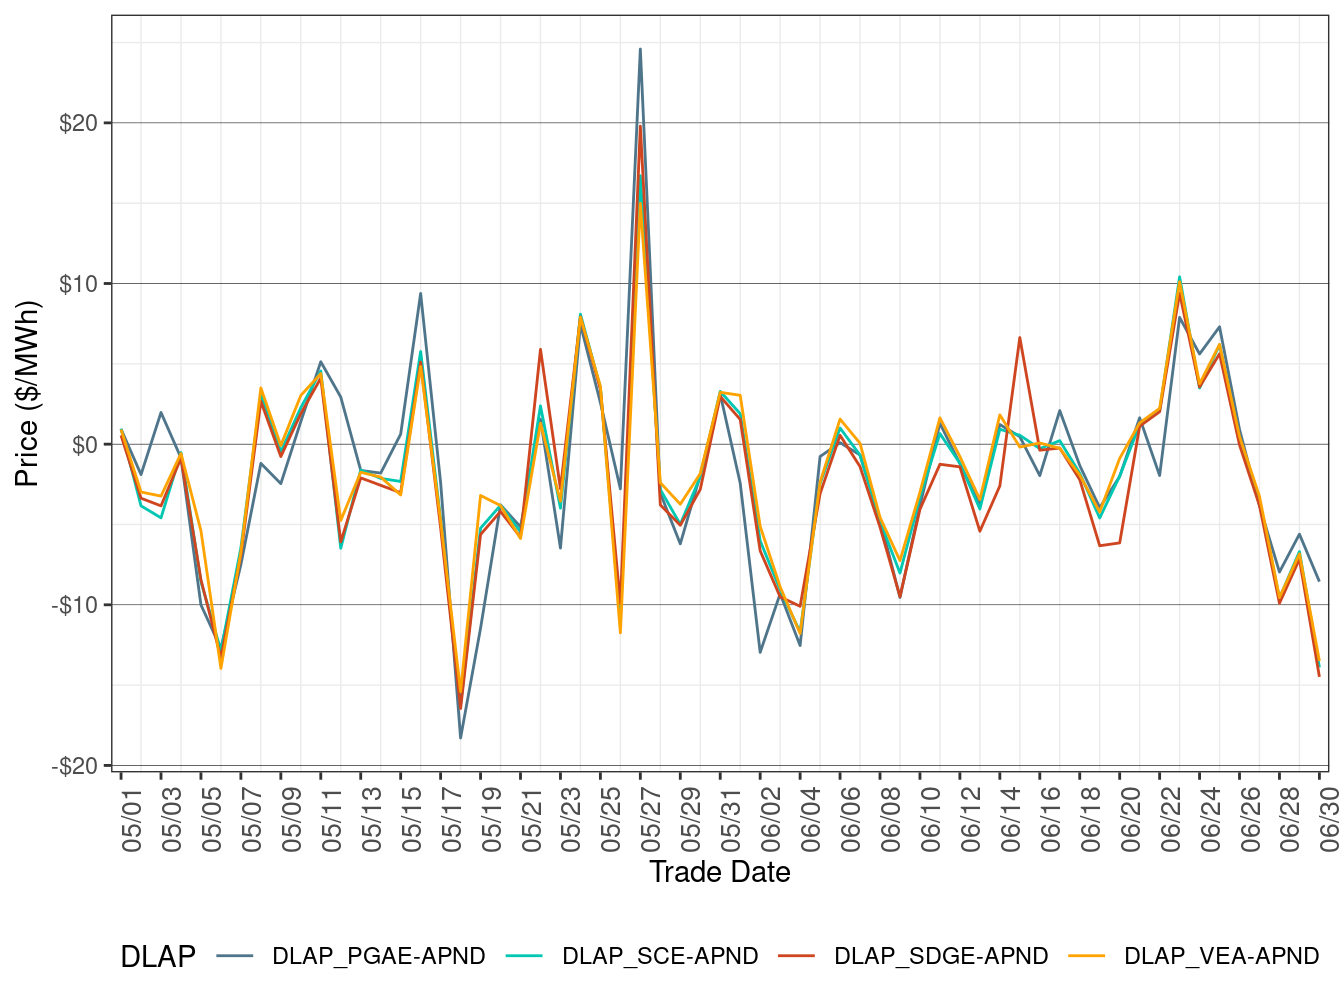
Figure 127, Figure 128, and Figure 129 show the difference between DA daily average price and RTD daily average price for three trading hubs (NP15, SP15, and ZP26) in all hours, peak hours, and off-peak hours respectively. A positive value indicates higher RTD prices compared to DA prices.
DA daily average price for each of the three trading hubs is calculated as below:
\[ \ P_i = \sum_j\frac{LMP_{ij}}{K} \quad where \quad i = NP15 , \ SP15 \ and \ ZP26 \] \(P_i\) is the daily average price for hub i while j represents the hour (peak, off-peak, or all). K is the count of the hours in one day.
The formula for RTD hub daily average price is:
\[ \ P_i = \sum_j\sum_h\frac{LMP_{ijh}}{K} \quad where \quad i = NP15 , \ SP15 \ and \ ZP26 \]
\(P_i\) is the daily average price for hub i while j represents the hour (peak, off-peak, or all) and h represents 5-minute interval. N is the count of the intervals in one day. The similar methods are applied to calculate the DA and RTD weekly average prices for trading hubs.
Figure 127: Daily Trading Hub Price Difference (All Hours)
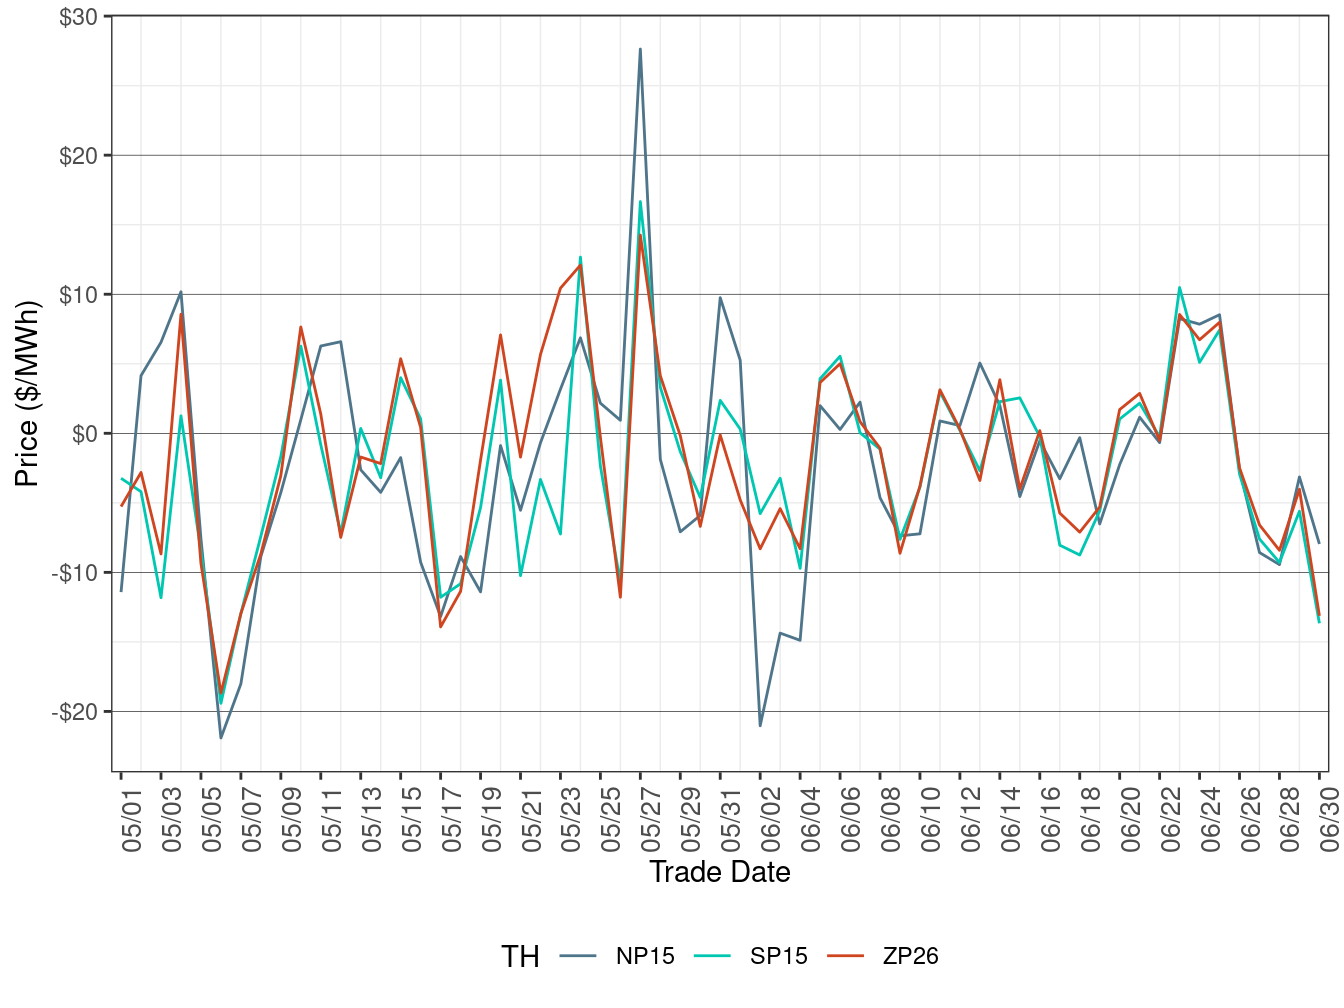
Figure 128: Daily Trading Hub Price Difference (On-Peak Hours)
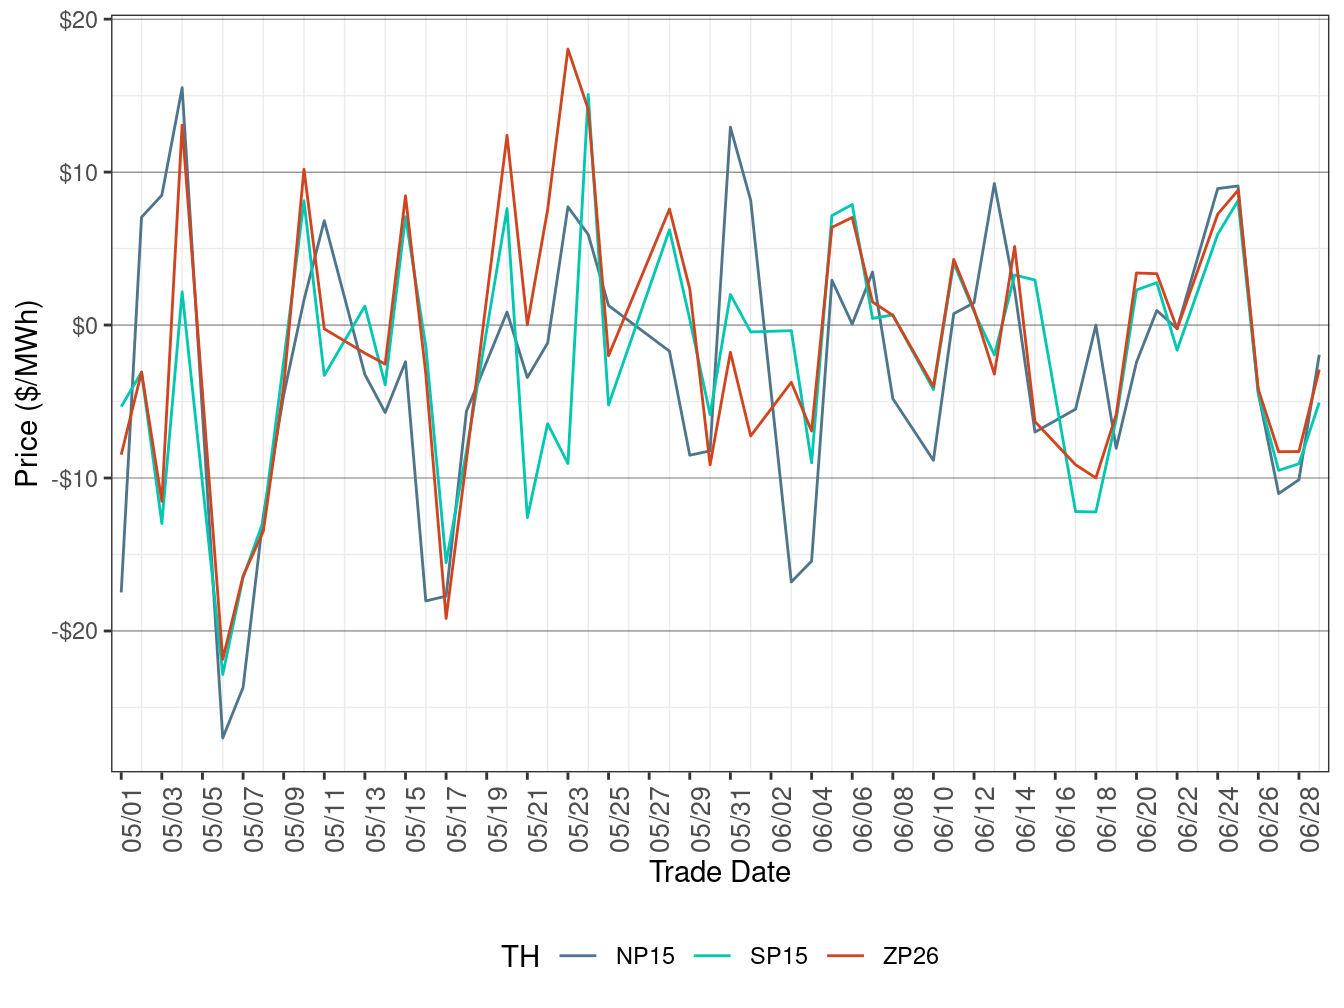
Figure 129: Daily Trading Hub Price Difference (Off-Peak Hours)
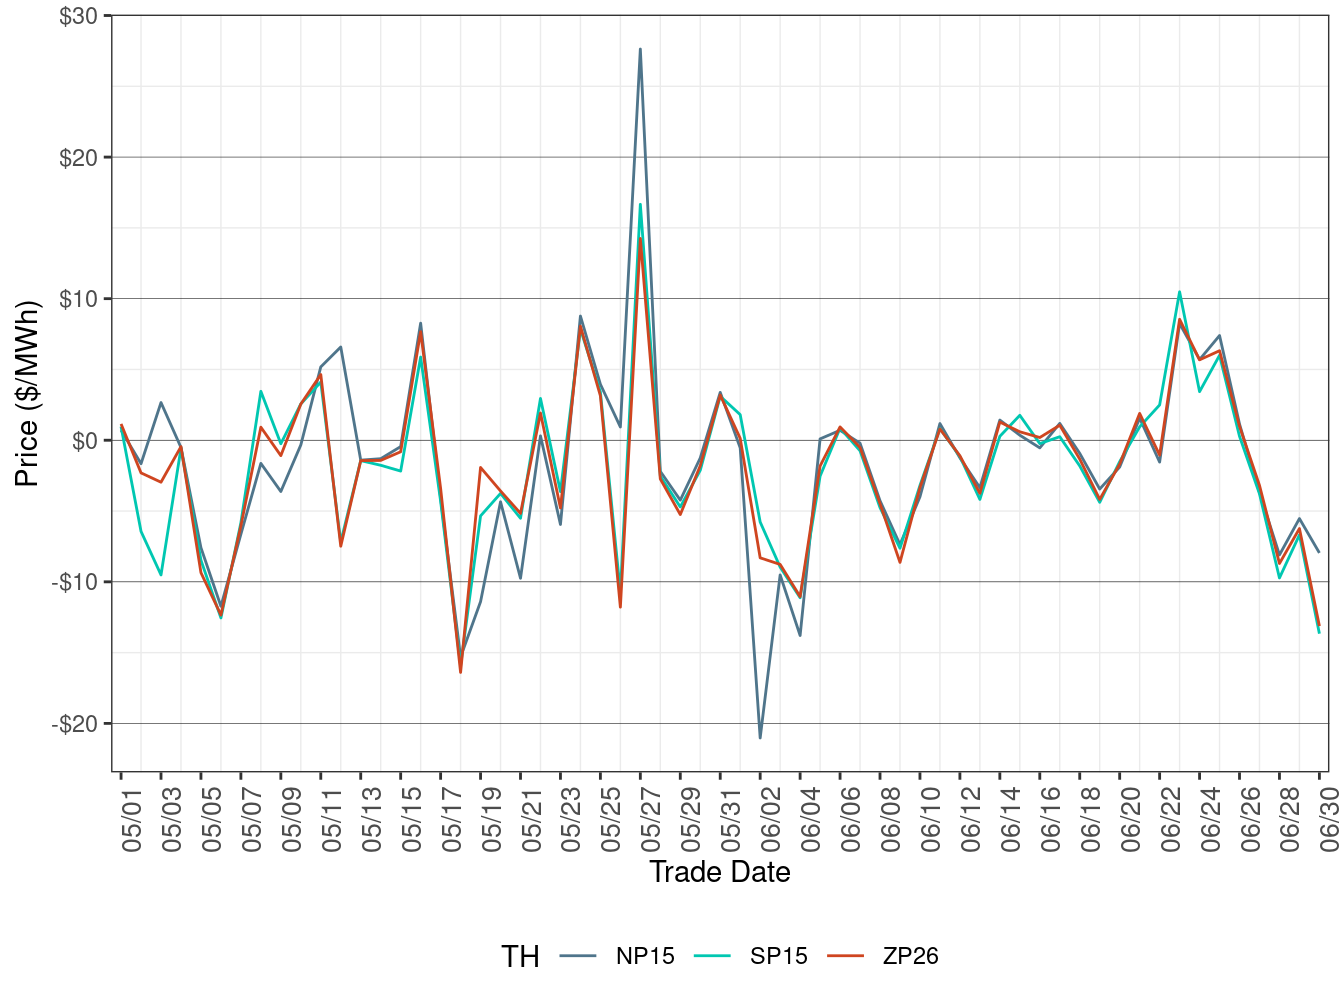
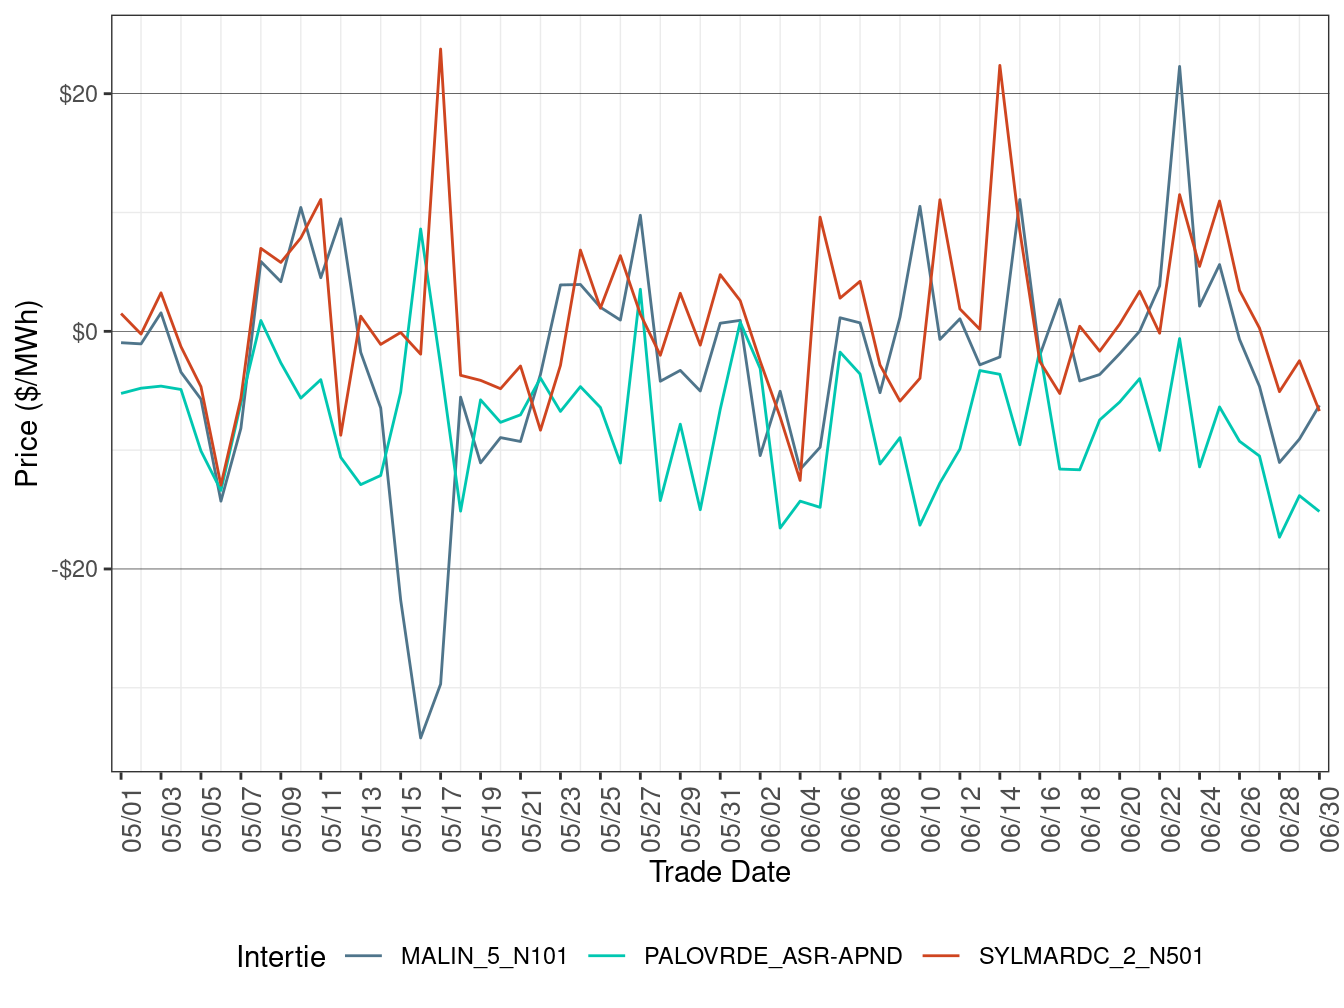
Figure 130, Figure 131, and Figure 132 show the difference between DA daily average price and FMM daily average price for three selected interties (Malin, Palo Verde, and Sylmar) in all hours, peak hours, and off-peak hours respectively. A positive value indicates higher FMM prices compared to DA prices.
DA daily simple average price for each of the three selected Scheduling points is calculated as the follows:
$ P_i = _j where i = Malin , Palo Verde and Sylmar $
\(P_i\) is the daily average price for intertie i while j represents the hour (peak, off-peak, or all). K is the count of the hours in one day.
The formula for FMM intertie daily average price is: \[ \ P_i = \sum_j\sum_h\frac{LMP_{ijh}}{N} \quad where \quad i = Malin , \ Palo Verde \ and \ Sylmar \]
\(P_i\) is the daily average price for intertie i while j represents the hour (peak, off-peak, or all) and h represents 15-minute interval. N is the count of the intervals in one day.
Figure 130: Daily Intertie Price Difference (All Hours)
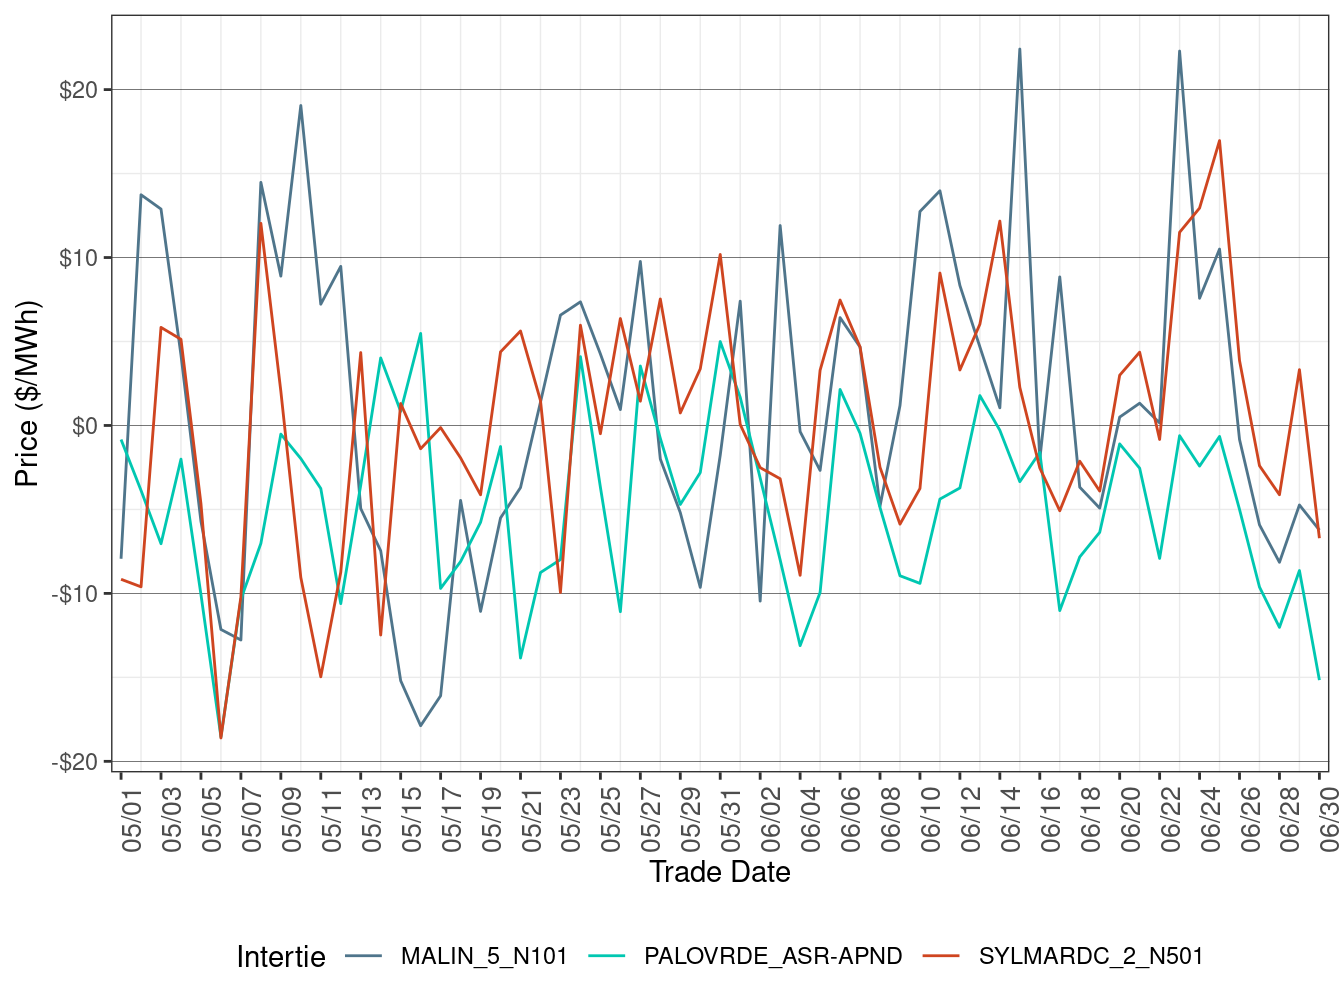
Figure 131: Daily Intertie Price Difference (On-Peak Hours)
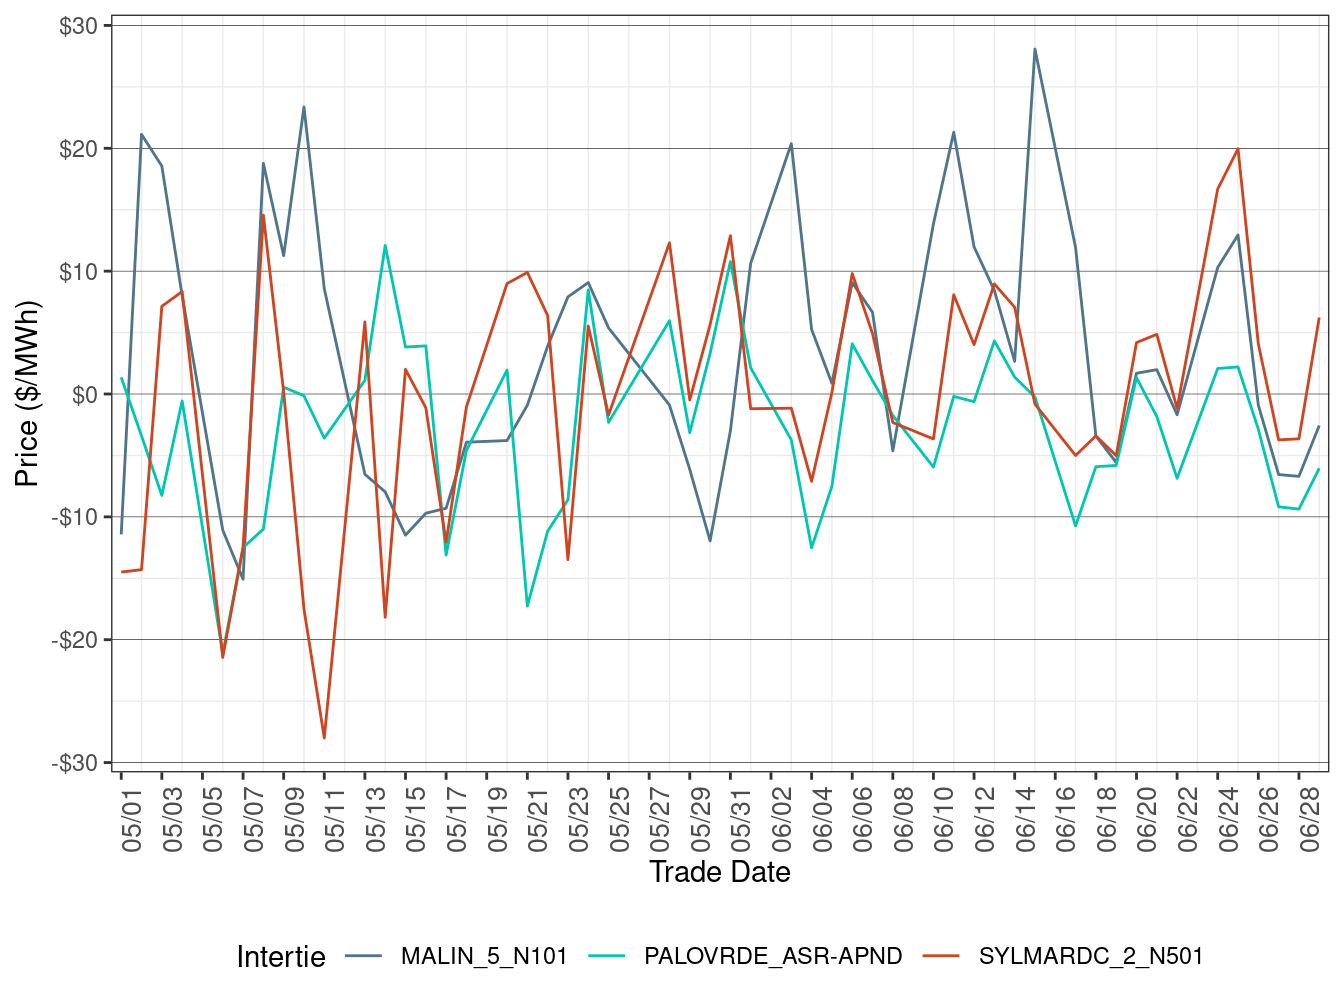
Figure 132: Daily Intertie Price Difference (Off-Peak Hours)
Real-Time Price Volatility
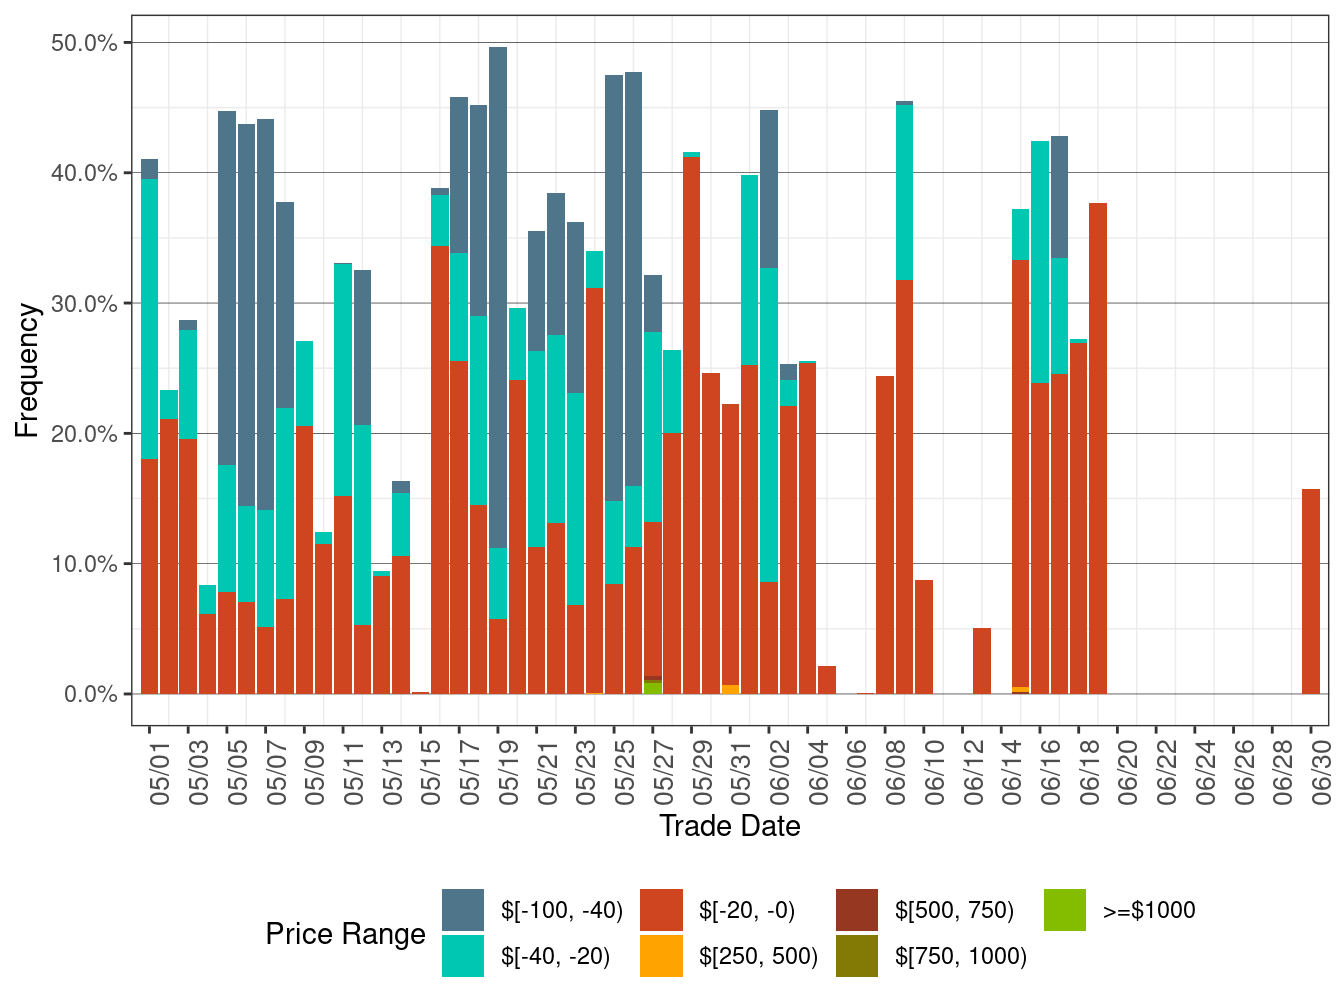
Figure 133 shows the daily price frequency for prices above $250/MWh and below $0/MWh in FMM. Prices are for all default LAPs. The graph may provide a trend of price spikes over time.
Figure 133: Daily Frequency of FMM LAP Positive Price Spikes and Negative Prices
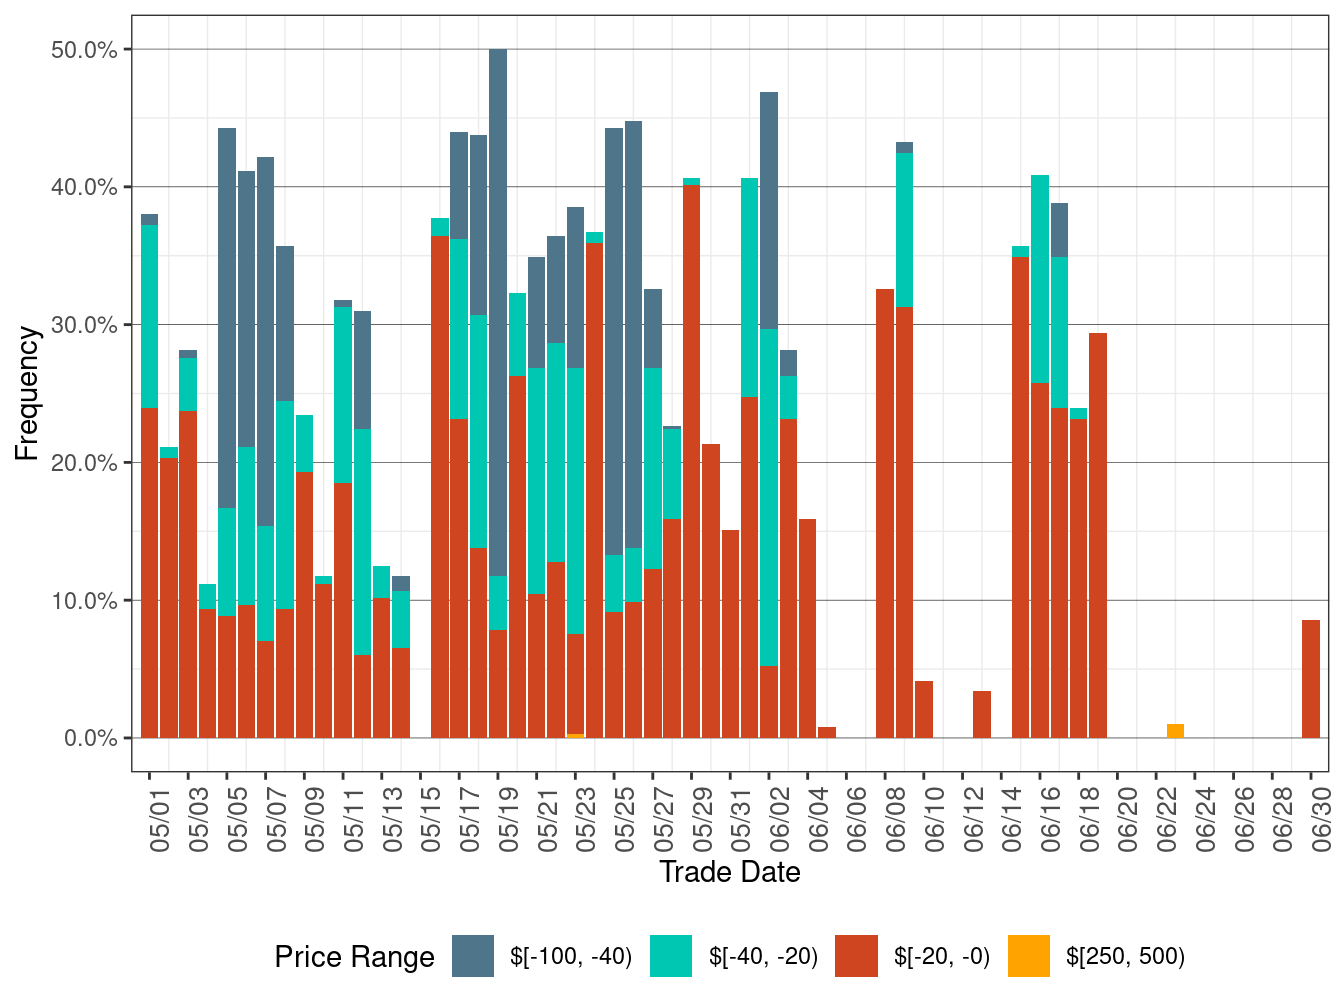
Figure 134 shows the frequency of prices of the default LAP prices in the real-time market (RTD). Prices are grouped in several bins. This plot provides a breakdown of the frequency of all prices, with granularity for prices that fall between $0/MWh and $250/MWh. This frequency includes both time of uses, on-peak and off-peak, and is aggregated by default LAP on a monthly basis.
Figure 134: Frequency of RTD LAP Prices (All Hours)
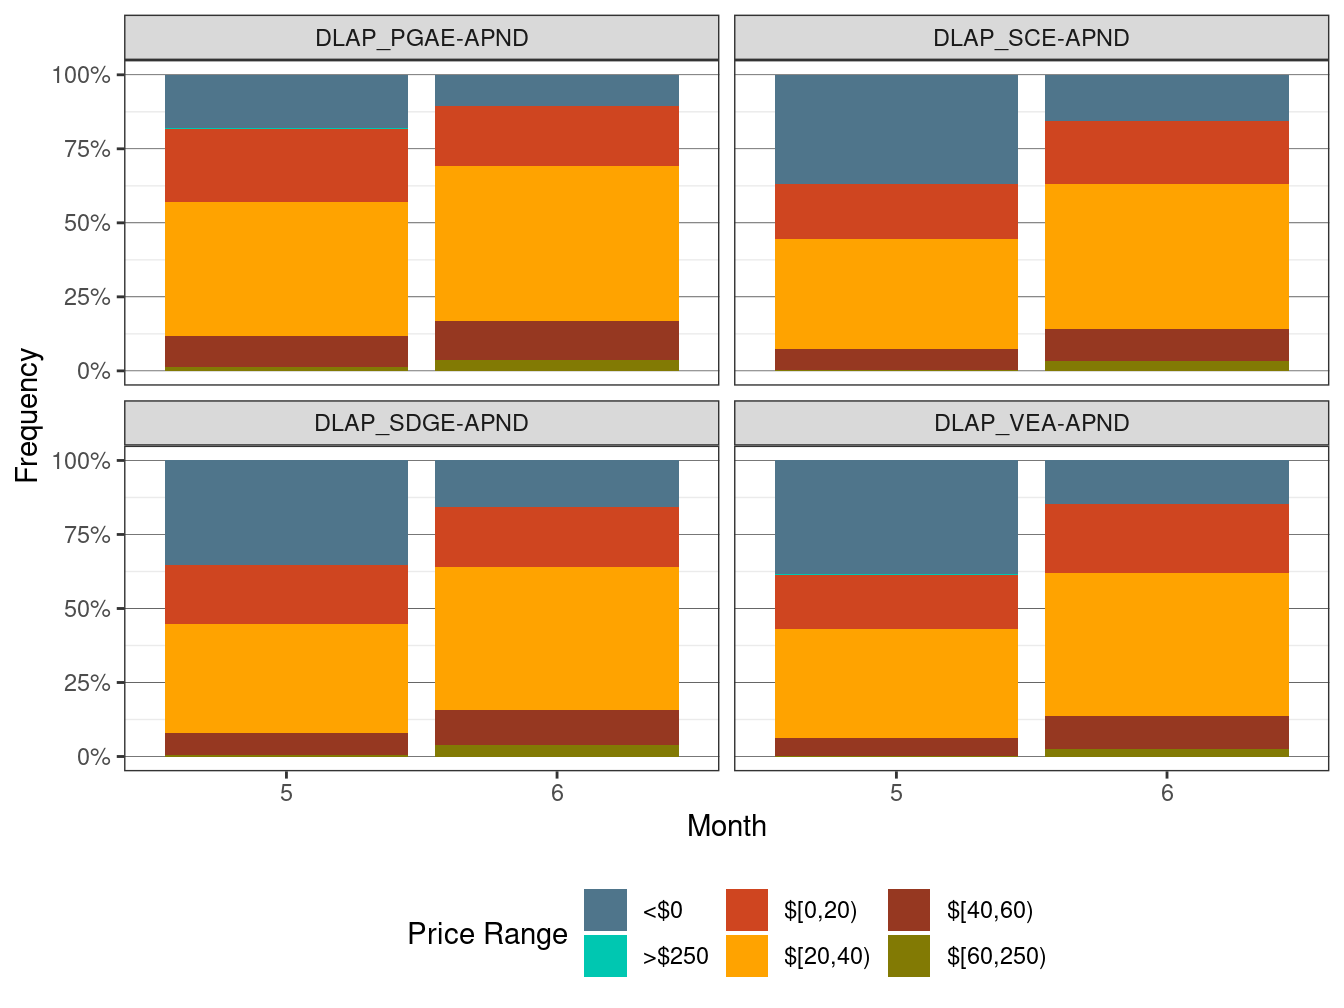
Figure 135 shows the monthly frequency of price spikes for RTD default LAP prices i.e. those that are above $250/MWh, and also negative prices. The prices are aggregated on a monthly basis for each default LAP.
Figure 135: Frequency of RTD LAP Price Spikes and Negative Prices
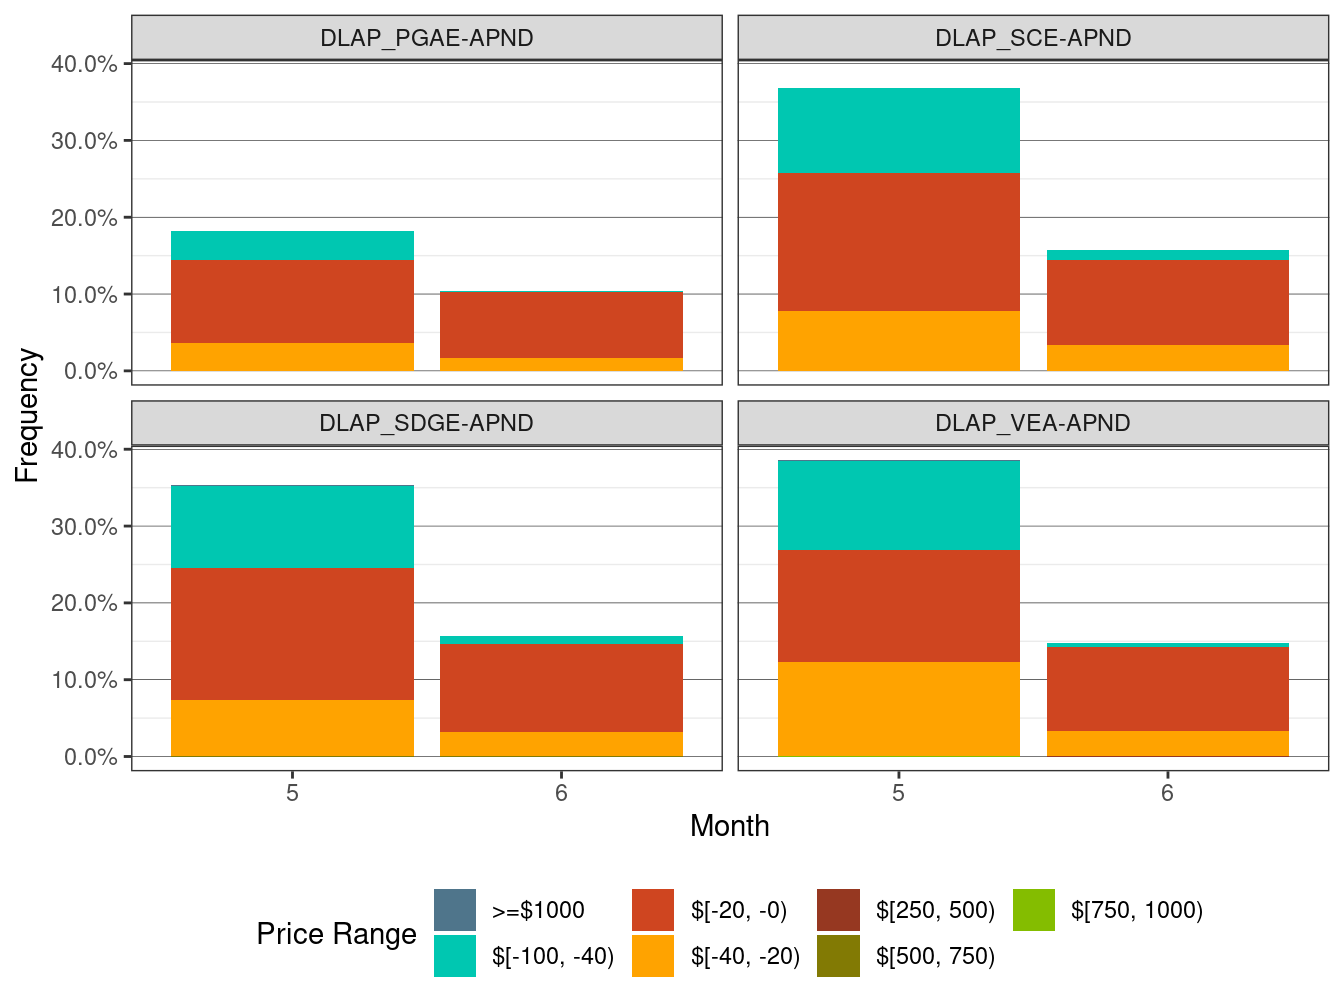
Figure 136 shows the daily price frequency for prices above $250/MWh and below $0/MWh. Prices are for all four default LAPs. The graph may provide a trend of price spikes over time.
Figure 136: Daily Frequency of RTD LAP Positive Price Spkies and Negative Prices