3 Market Performance Metrics
Day-Ahead Prices
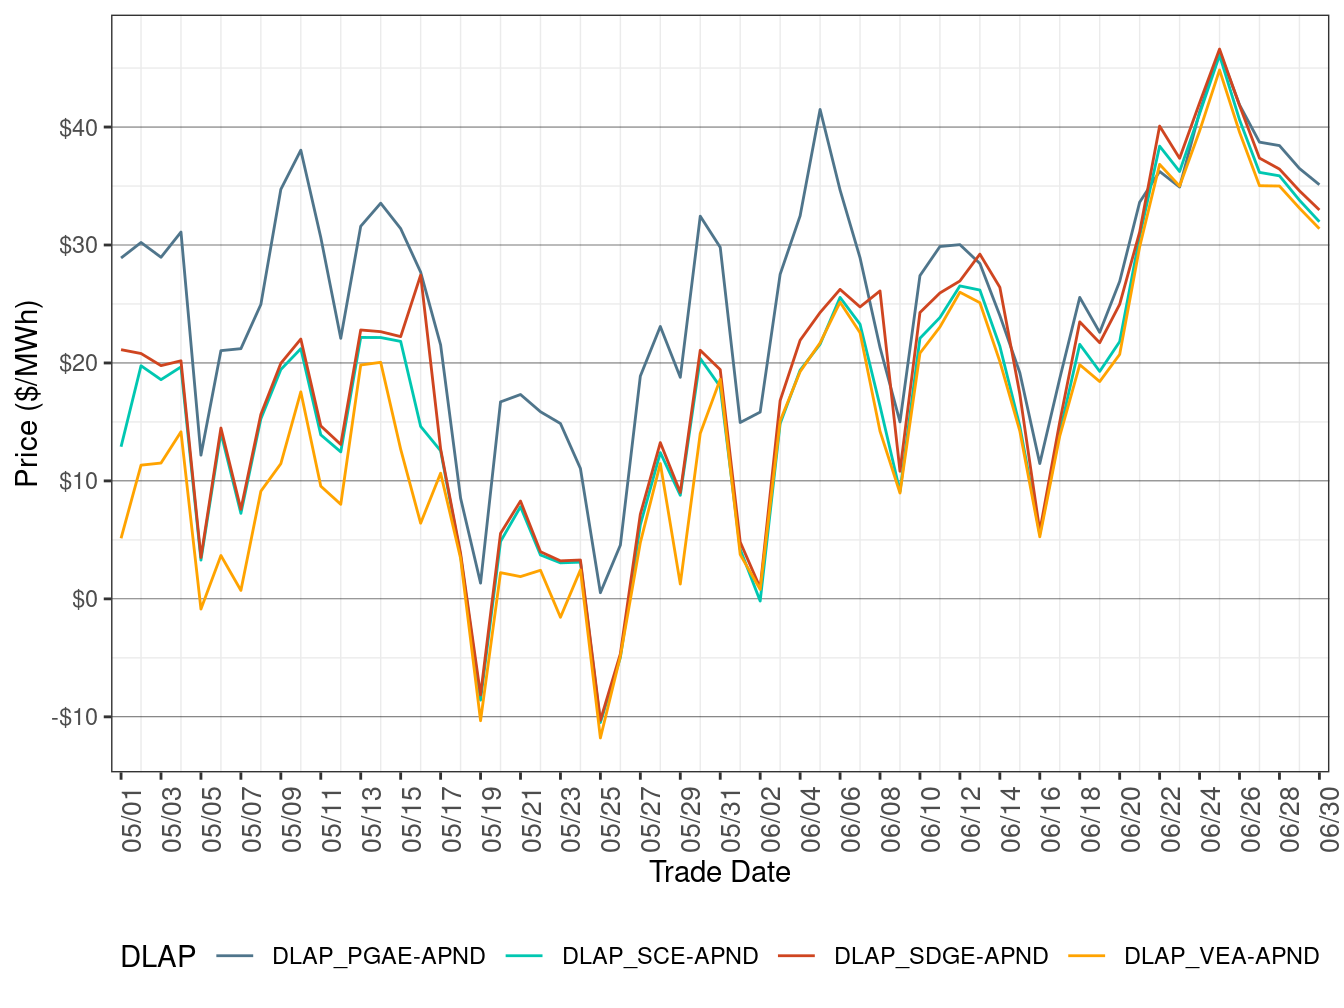
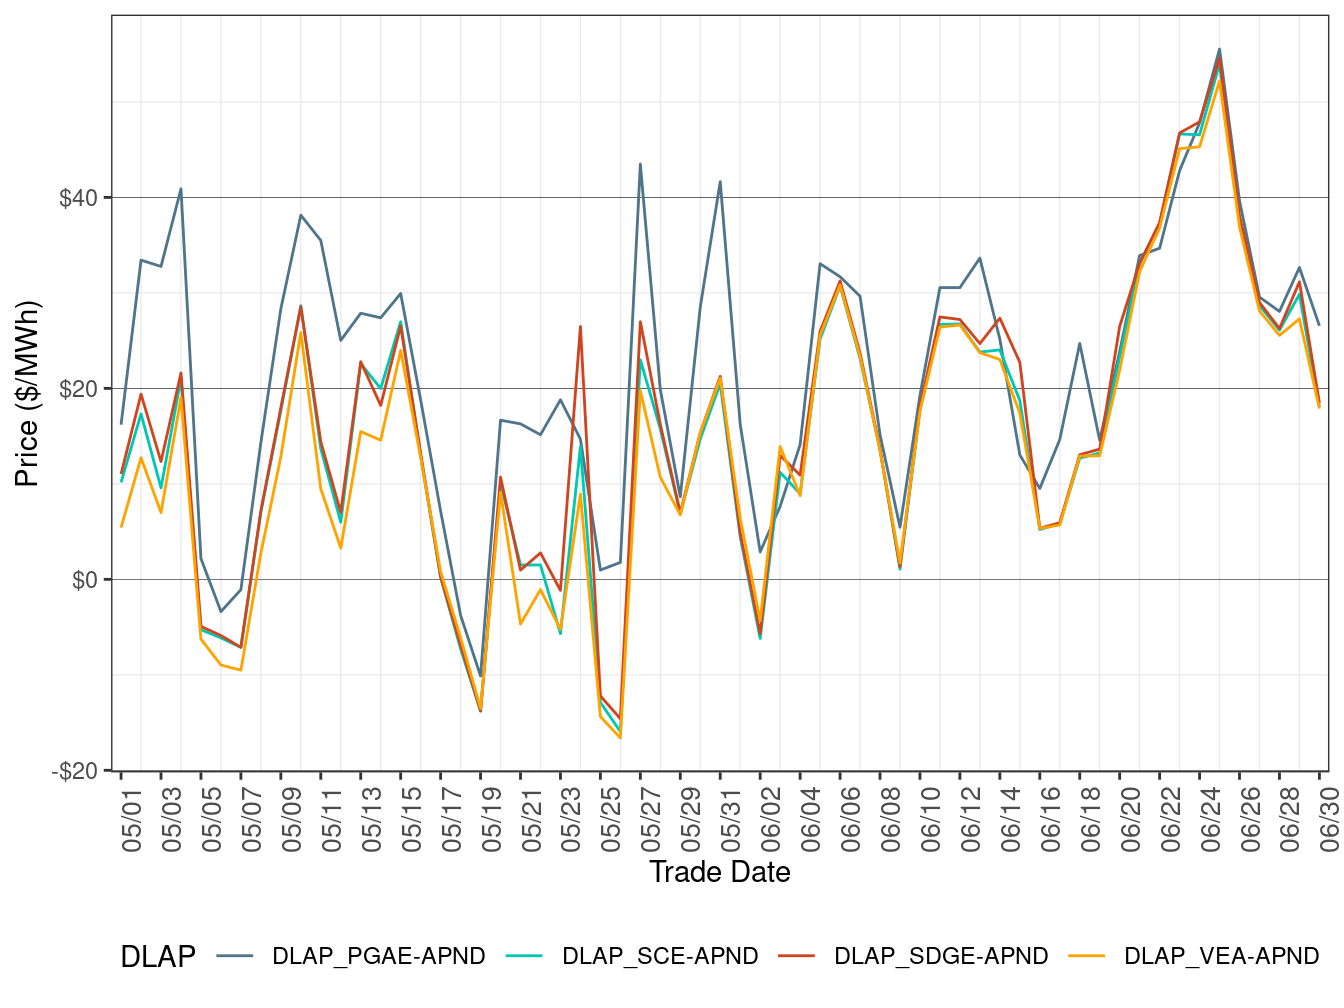
Figure 2 shows the daily simple average prices for all hours in IFM for each of the four default load-aggregation points (DLAP): PG&E, SCE, SDG&E, and VEA.
Day-Ahead DLAP prices on average increased this month compared to May. All four DLAP LMPs rose in June 24-26 due to high demand.
TABLE 3 below lists the binding constraints that resulted in relatively high or low DLAP prices on certain dates.
Figure 2: IFM (Day-Ahead) Simple Average DLAP Prices (All Hours)
| DLAP LMPs Affected | Dates | Transmission Constraint |
|---|---|---|
| PGAE | June 1, 3-7, 9 | MOSSLD-LASAGUIL-230kV line |
| PGAE | June 2 | MOSSLD-LASAGUIL-230kV line; LOSBANOS-PANOCHE-230kV line; LOSBANOS-GATES1 500kV line |
| PGAE; SDGE | June 8 | MOSSLD-LASAGUIL-230kV line; LOSBANOS-GATES1 500kV line; 7820_TL23040_IV_SPS_NG nomogram |
Real-Time Price
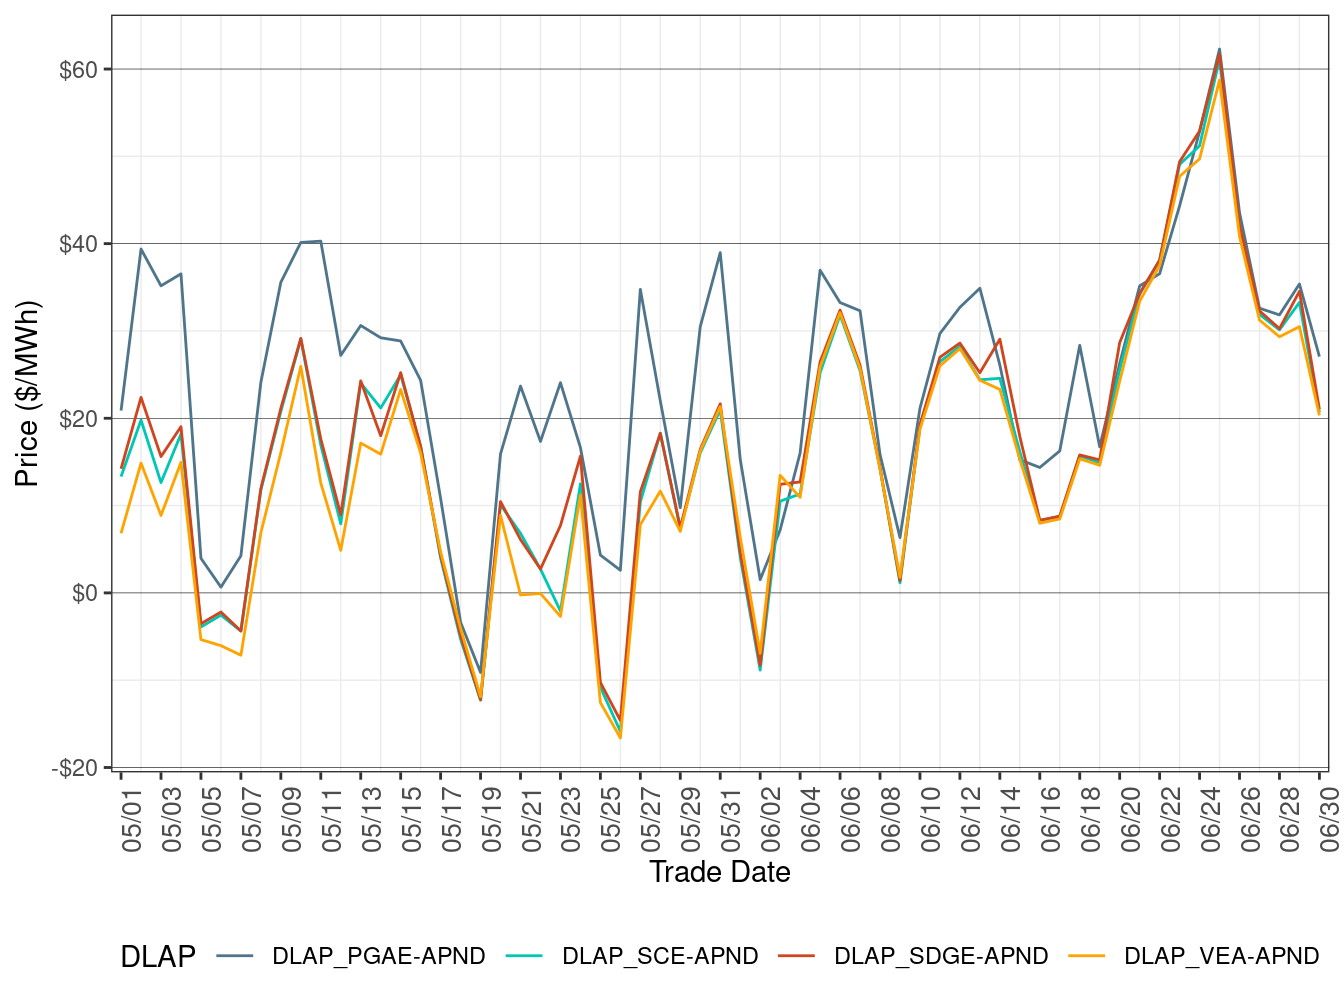
Figure 3 shows daily simple average prices for all four DLAPs (PG&E, SCE, SDG&E, and VEA) for all hours respectively in FMM.
FMM DLAP prices were generally quiet in June, on average increasing compared to the previous month. All four DLAP LMPs increased in June 23-26 due to high demand.
TABLE 4 below lists the binding constraints that resulted in relatively high or low DLAP prices on certain dates.
Figure 3: FMM Simple Average DLAP Prices (All Hours)
| DLAP LMPs Affected | Dates | Transmission Constraint |
|---|---|---|
| PGAE | June 1 | LASAGUIL-PANOCHE-230kV line; MOSSLD-LASAGUIL-230kV line |
| PGAE | June 2 | MOSSLD-LASAGUIL-230kV line; 7450_CUYMAS_TAFT_70_1 nomogram |
| PGAE | June 5 | 7430_CP6_NG nomogram; COTTNWD_ROUND-MT 230kV line |
| PGAE | June 7 | MOSSLD-LASAGUIL-230kV line; TESLA-LOSBANOS-500kV line |
| PGAE | June 13 | MOSSLD-LASAGUIL-230kV line |
| PGAE | June 16-18 | MOSSLD-LASAGUIL-230kV line; COTTNWD_ROUND-MT 230kV line |
Figure 4 below shows the daily frequency of positive price spikes and negative prices by price range for the DLAPs in the FMM.
The cumulative frequency of prices in FMM above $250/MWh edged up to 0.03 percent in June from 0.01 percent in the previous month, while the cumulative frequency of negative prices fell to 13.10 percent in June from 30.95 percent in the previous month.
Figure 4: Daily Frequency of FMM DLAP Positive Price Spikes and Negative Prices
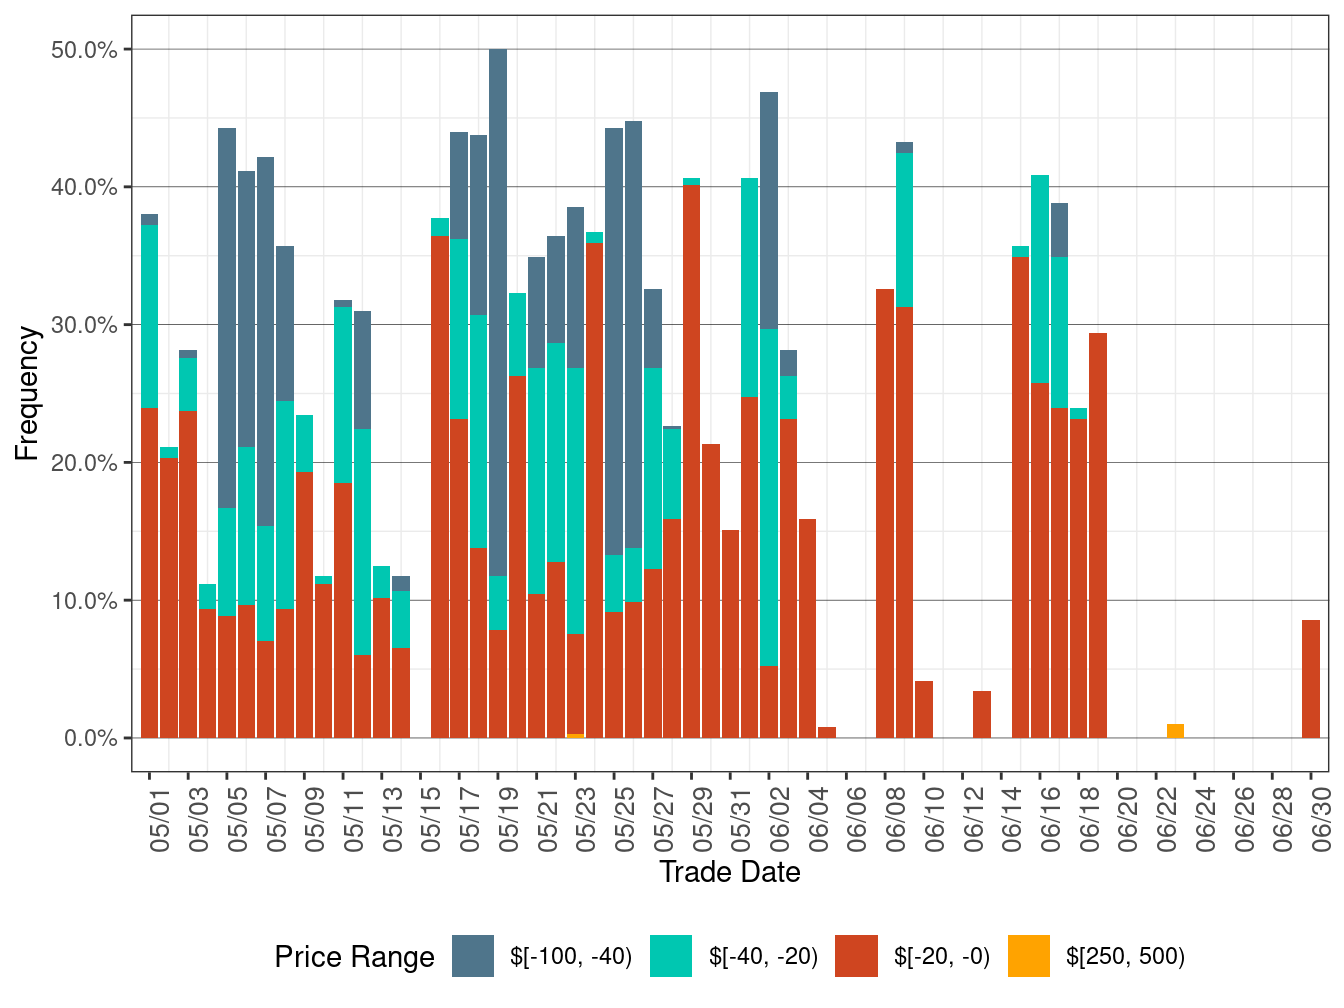
Figure 5 shows daily simple average prices for all the DLAPs (PG&E, SCE, SDG&E, and VEA) for all hours respectively in RTD.
RTD DLAP prices were generally quiet in June, on average increasing compared to the previous month. All four DLAP LMPs rose in June 23-26 due to high demand.
TABLE 5 below lists the binding constraints that resulted in relatively high or low DLAP prices on certain dates.
Figure 5: RTD Simple Average DLAP Prices (All Hours)
| DLAP LMPs Affected | Dates | Transmission Constraint |
|---|---|---|
| PGAE | June 1 | LASAGUIL-PANOCHE-230kV line; MOSSLD-LASAGUIL-230kV line |
| PGAE | June 2 | MOSSLD-LASAGUIL-230kV line; 7450_CUYMAS_TAFT_70_1 nomogram |
| PGAE | June 5 | 7430_CP6_NG nomogram |
| PGAE | June 7 | MOSSLD-LASAGUIL-230kV line; TESLA-LOSBANOS-500kV line |
| PGAE | June 13, 16-18 | MOSSLD-LASAGUIL-230kV line |
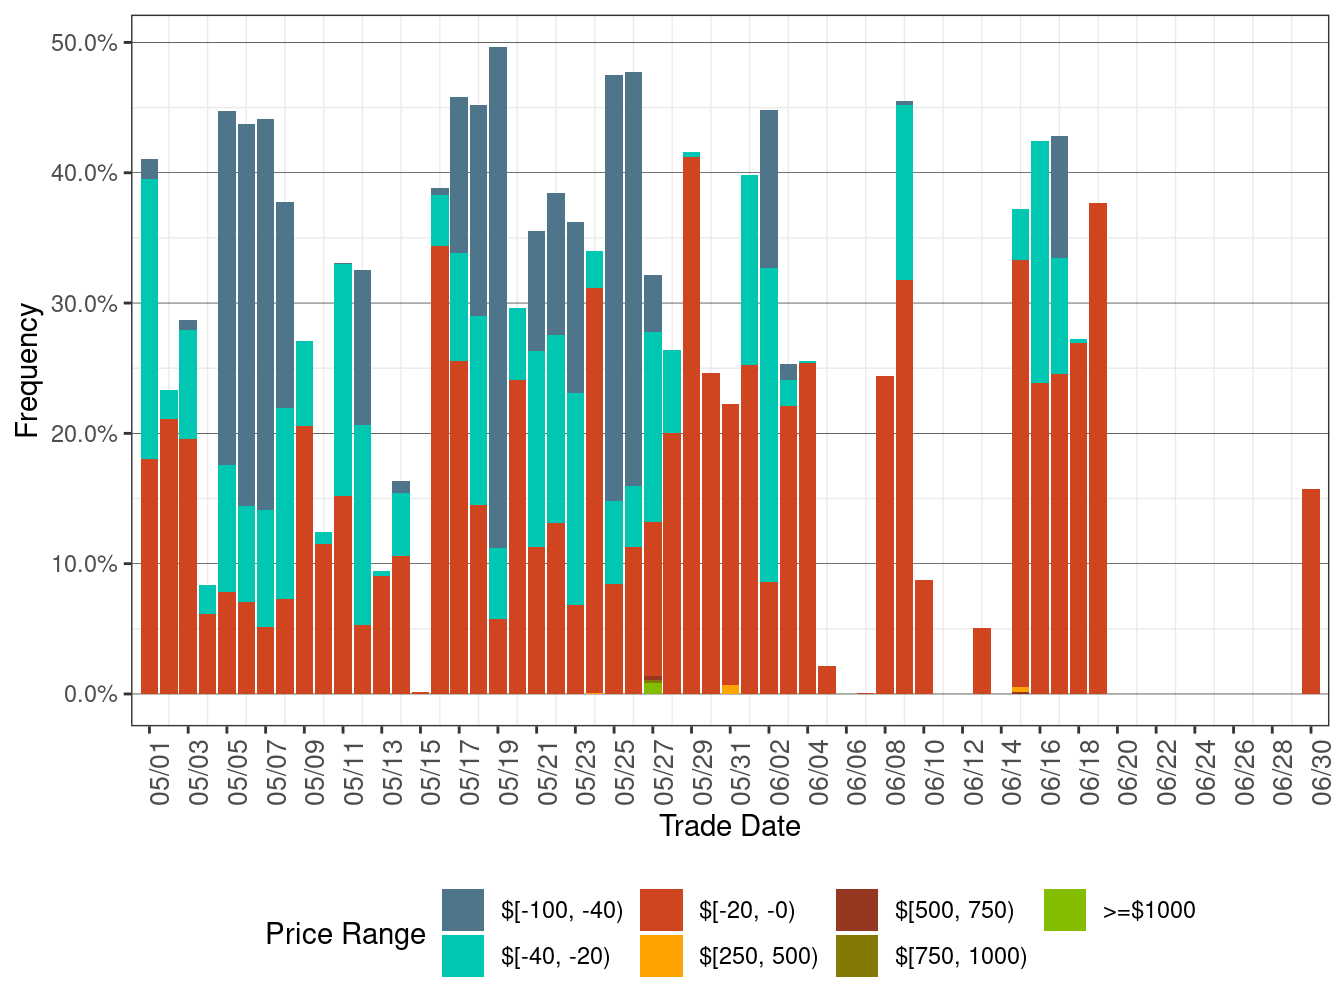
Figure 6 below shows the daily frequency of positive price spikes and negative prices by price range for the DLAPs in RTD.
The cumulative frequency of prices in RTD above $250/MWh edged down to 0.02 percent in June from 0.07 percent in the previous month, while the cumulative frequency of negative prices decreased to 14.13 percent in June from 32.13 percent in the previous month.
Figure 6: Daily Frequency of RTD DLAP Positive Price Spikes and Negative Prices