Section 6 Ancillary Services
IFM Procurement and Prices
Table 6.1 shows the monthly IFM average ancillary service procurement and Table 6.2 shows the monthly IFM average ancillary service prices.
In May, the monthly IFM average procurement decreased for regulation up, regulation down, and non-spinning reserves, while increasing for spinning reserves compared to the previous month. The monthly IFM average prices increased for regulation up, regulation down, and non-spinning reserves, while decreasing for spinning reserves compared to the previous month.
| Month | April 2026 | May 2026 | Percent Change |
|---|---|---|---|
| Regulation_Up | 860 | 749 | -12.9% |
| Regulation_Down | 943 | 884 | -6.3% |
| Spin | 576 | 651 | 13.0% |
| Non_Spin | 1129 | 1079 | -4.4% |
| Ancillary Service | April 2026 | May 2026 | Percent Change |
|---|---|---|---|
| Regulation_Up | $3.03 | $3.76 | 24.0% |
| Regulation_Down | $4.31 | $5.18 | 20.1% |
| Spin | $1.00 | $0.90 | -9.8% |
| Non_Spin | $0.71 | $0.74 | 3.8% |
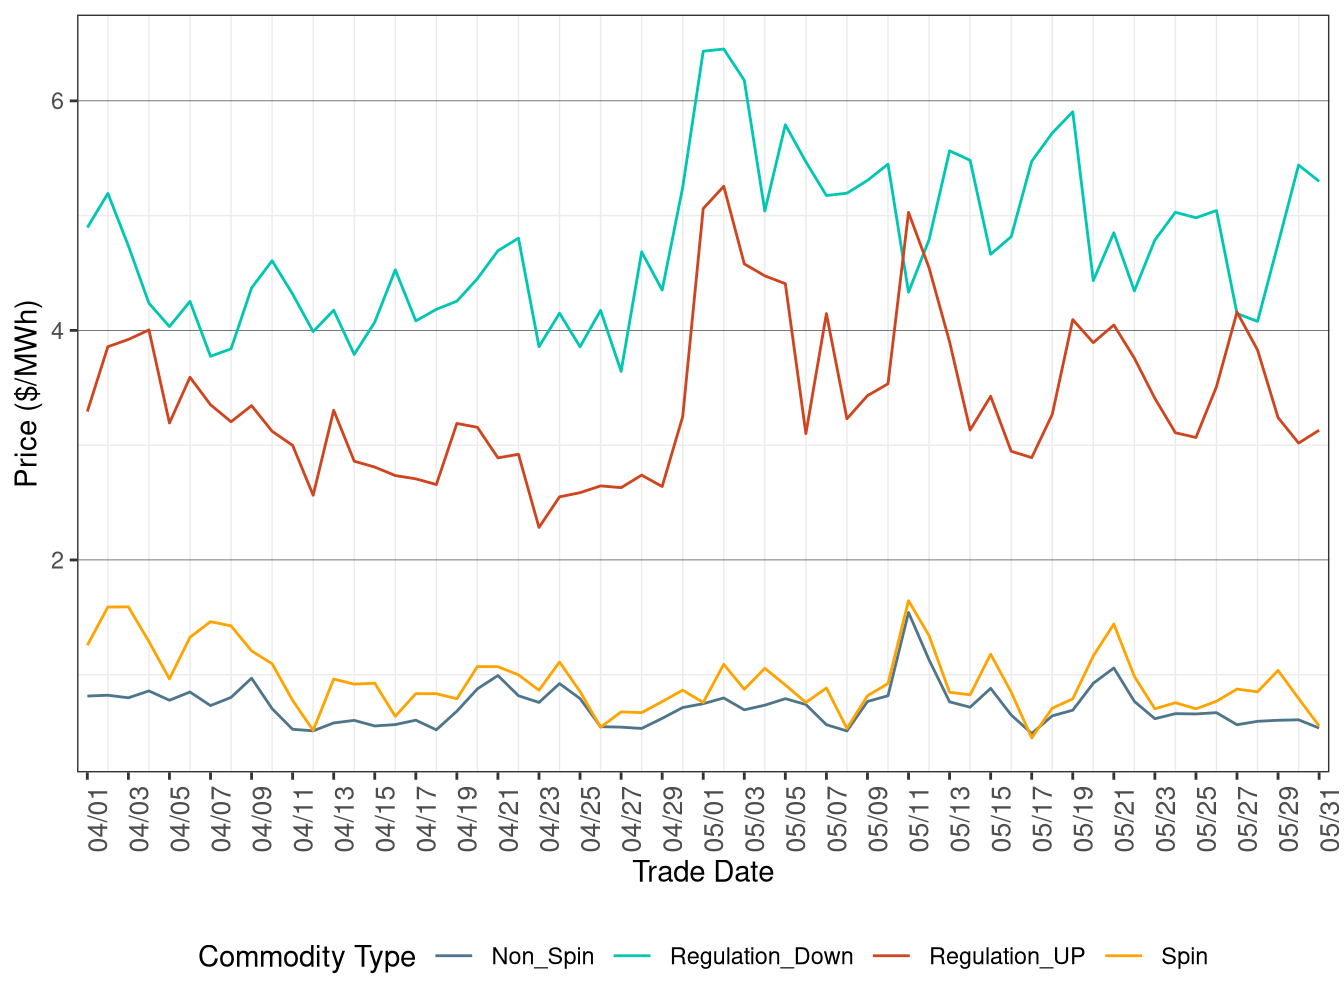
Figure 6.1 shows the daily IFM average ancillary service prices.
Day-ahead ancillary service prices remained volatile in May.
Figure 6.1: IFM (Day-Ahead) Ancillary Service Average Price
Daily average ancillary procurement and prices in the real-time market (FMM) are shown in the Appendix.
Scarcity Events
The ancillary services scarcity pricing mechanism is triggered when the ISO is not able to procure the target quantity of one or more ancillary services in the IFM and real-time market runs. The scarcity events in this month are shown in Table 6.3 below.
| Date | Hour Ending | Interval | Ancillary Service | Region | Shortfall | Percentage of requirement |
|---|---|---|---|---|---|---|