Section 3 Market Performance Metrics
Day-Ahead Prices
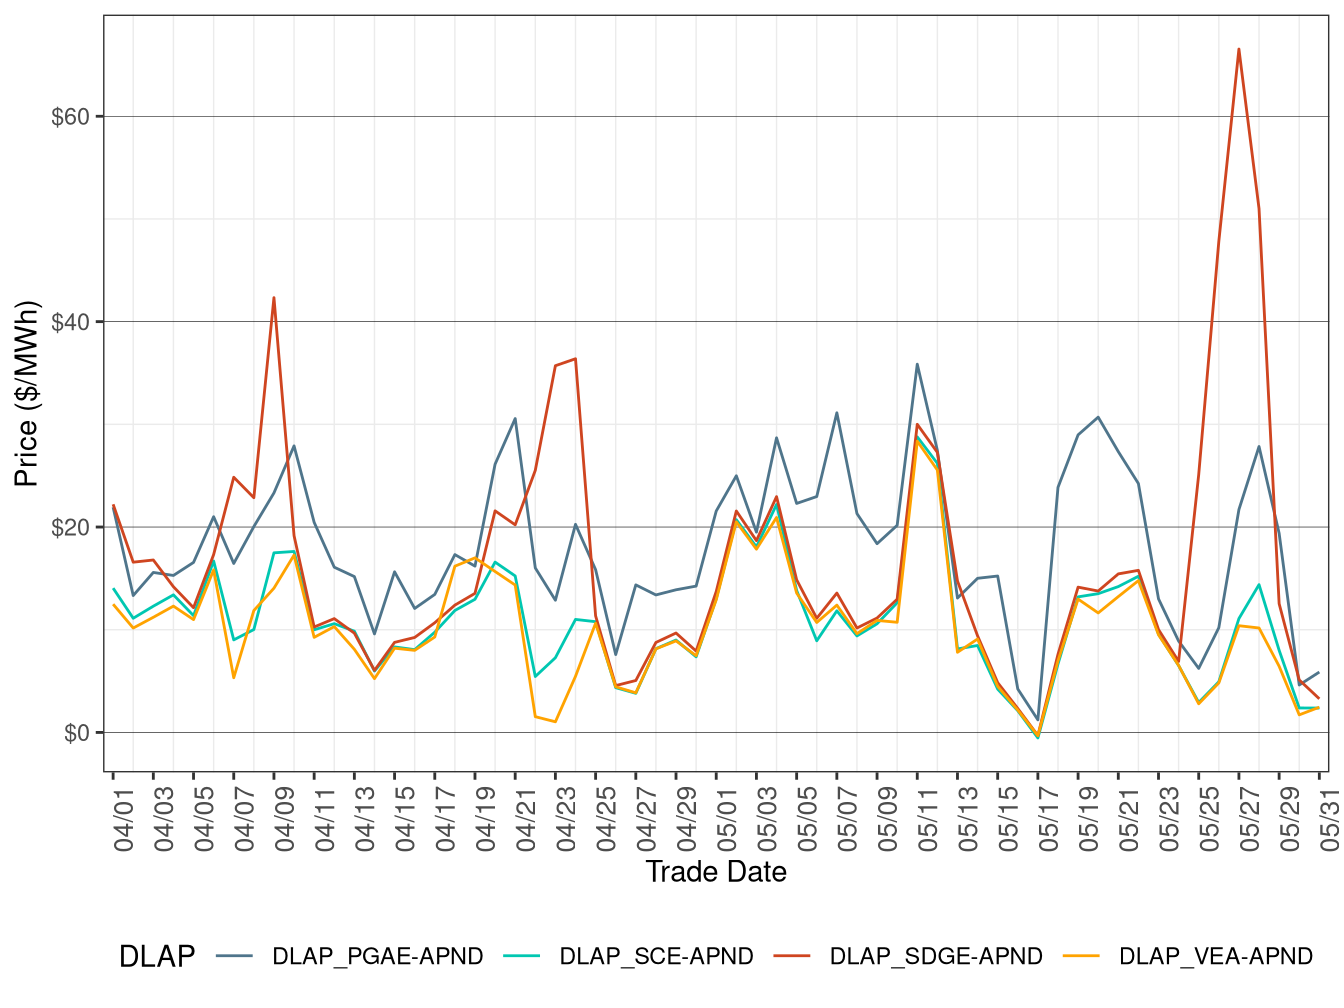
Figure 3.1 shows the daily simple average prices for all hours in IFM for each of the four default load-aggregation points (DLAP): PG&E, SCE, SDG&E, and VEA.
Average Day-Ahead DLAP prices across PGAE, SCE, SDGE, and VEA increased relative to the previous month.
Figure 3.1: IFM (Day-Ahead) Simple Average DLAP Prices (All Hours)
Real-Time Price
Figure 3.2 shows daily simple average prices for all four DLAPs (PG&E, SCE, SDG&E, and VEA) for all hours respectively in FMM.
Average FMM DLAP prices increased for PGAE, SCE, VEA, while SDGE experienced a decrease relative to the previous month.
Figure 3.2: FMM Simple Average DLAP Prices (All Hours)
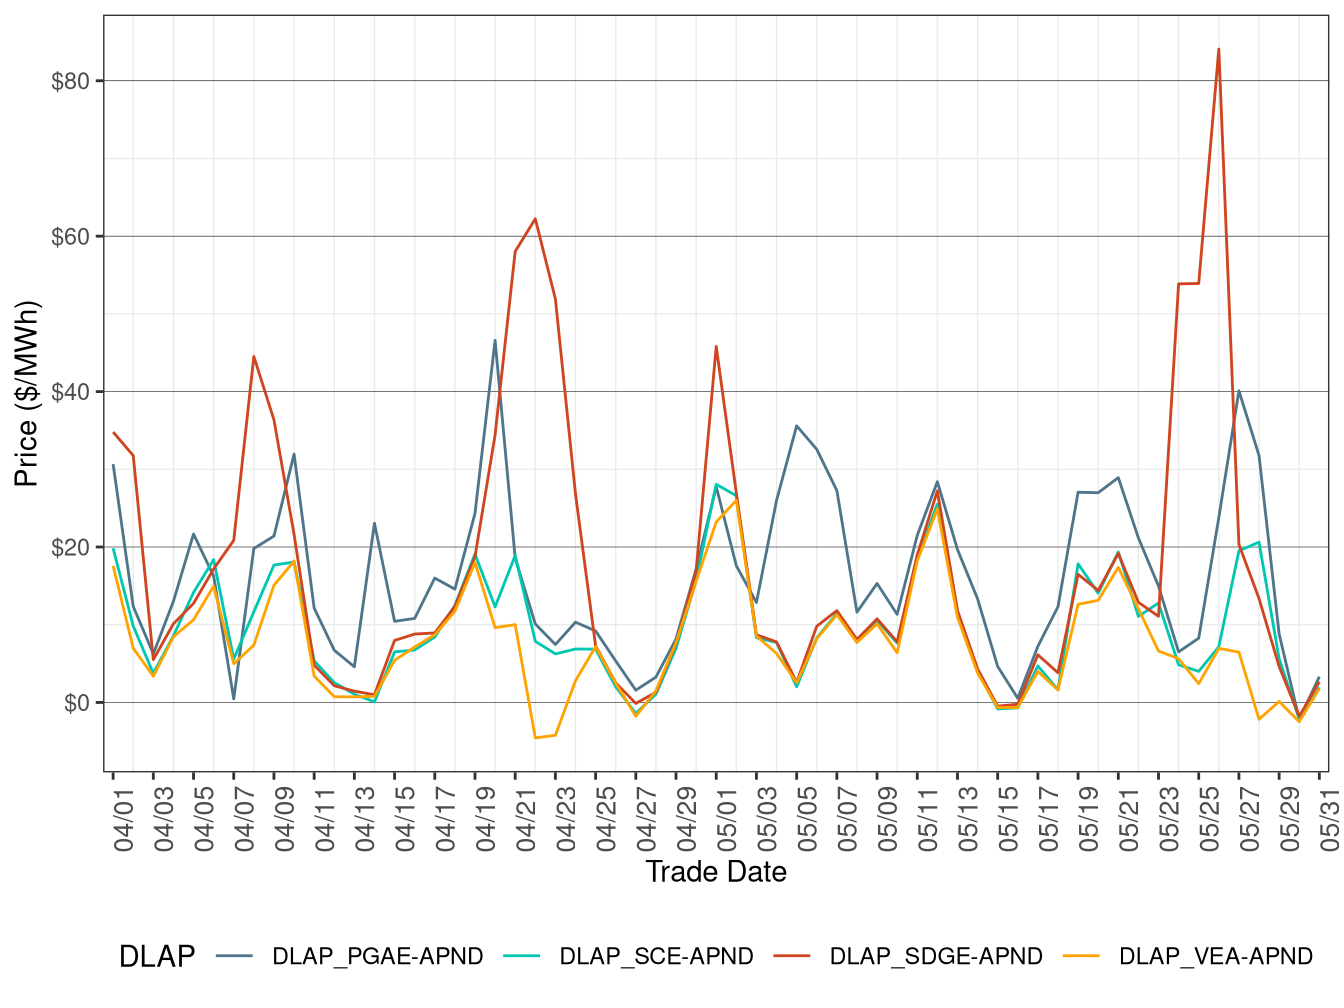
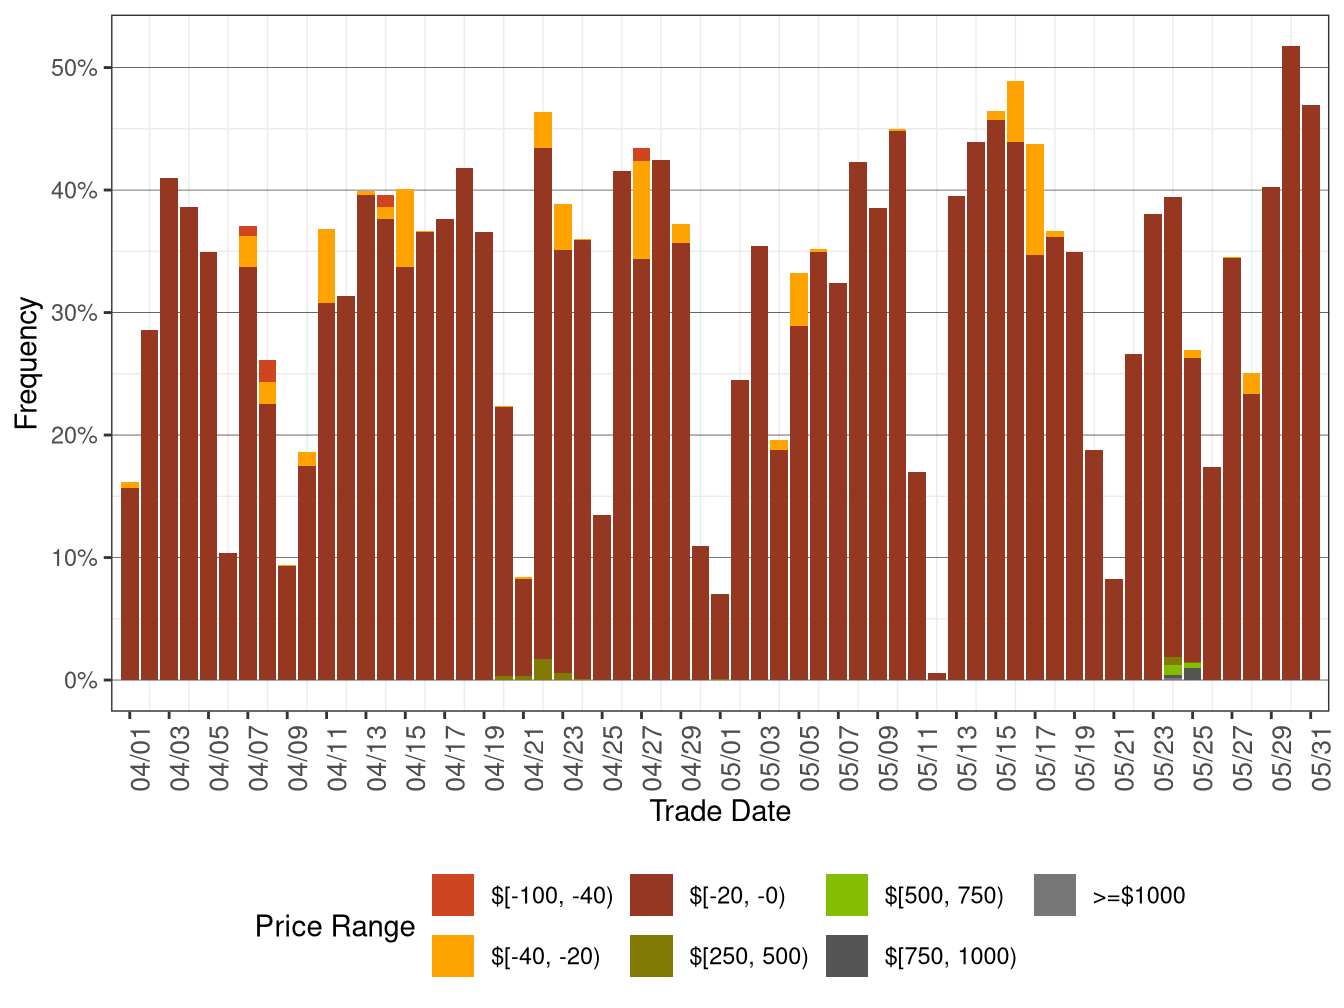
Figure 3.3 below shows the daily frequency of positive price spikes and negative prices by price range for the DLAPs in the FMM.
The cumulative frequency of prices in FMM above $250/MWh decreased from 0.10 percent in April 2026 to 0.06 percent in May 2026, while the cumulative frequency of negative prices increased from 30.61 percent in April 2026 to 31.33 percent in May 2026.
Figure 3.3: Daily Frequency of FMM DLAP Positive Price Spikes and Negative Prices
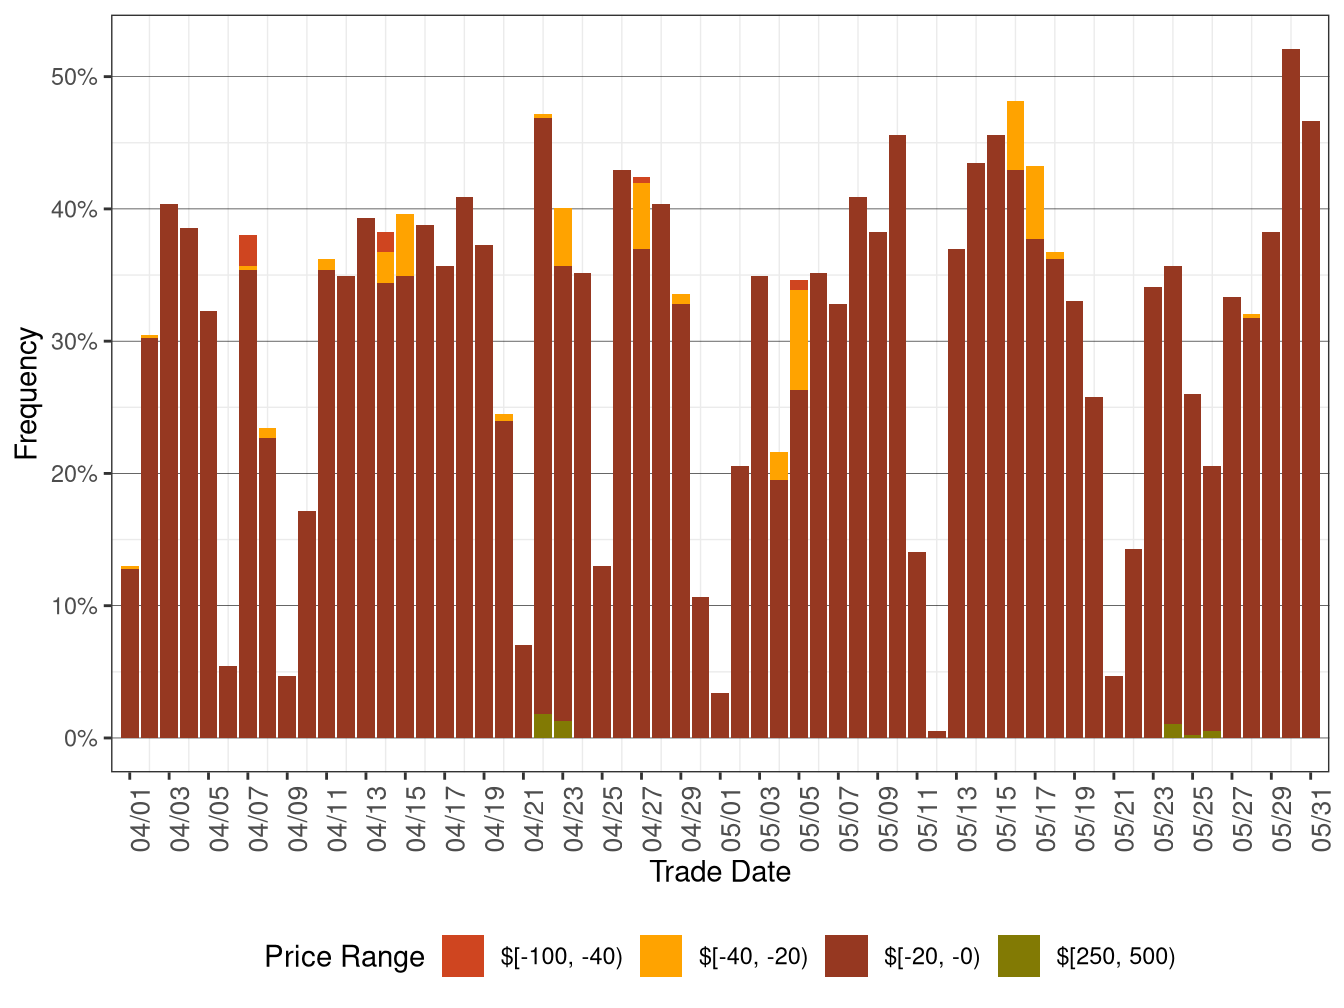
Figure 3.4 shows daily simple average prices for all the DLAPs (PG&E, SCE, SDG&E, and VEA) for all hours respectively in RTD.
Average RTD DLAP prices across PGAE, SCE, SDGE, and VEA increased relative to the previous month.
Figure 3.4: RTD Simple Average DLAP Prices (All Hours)
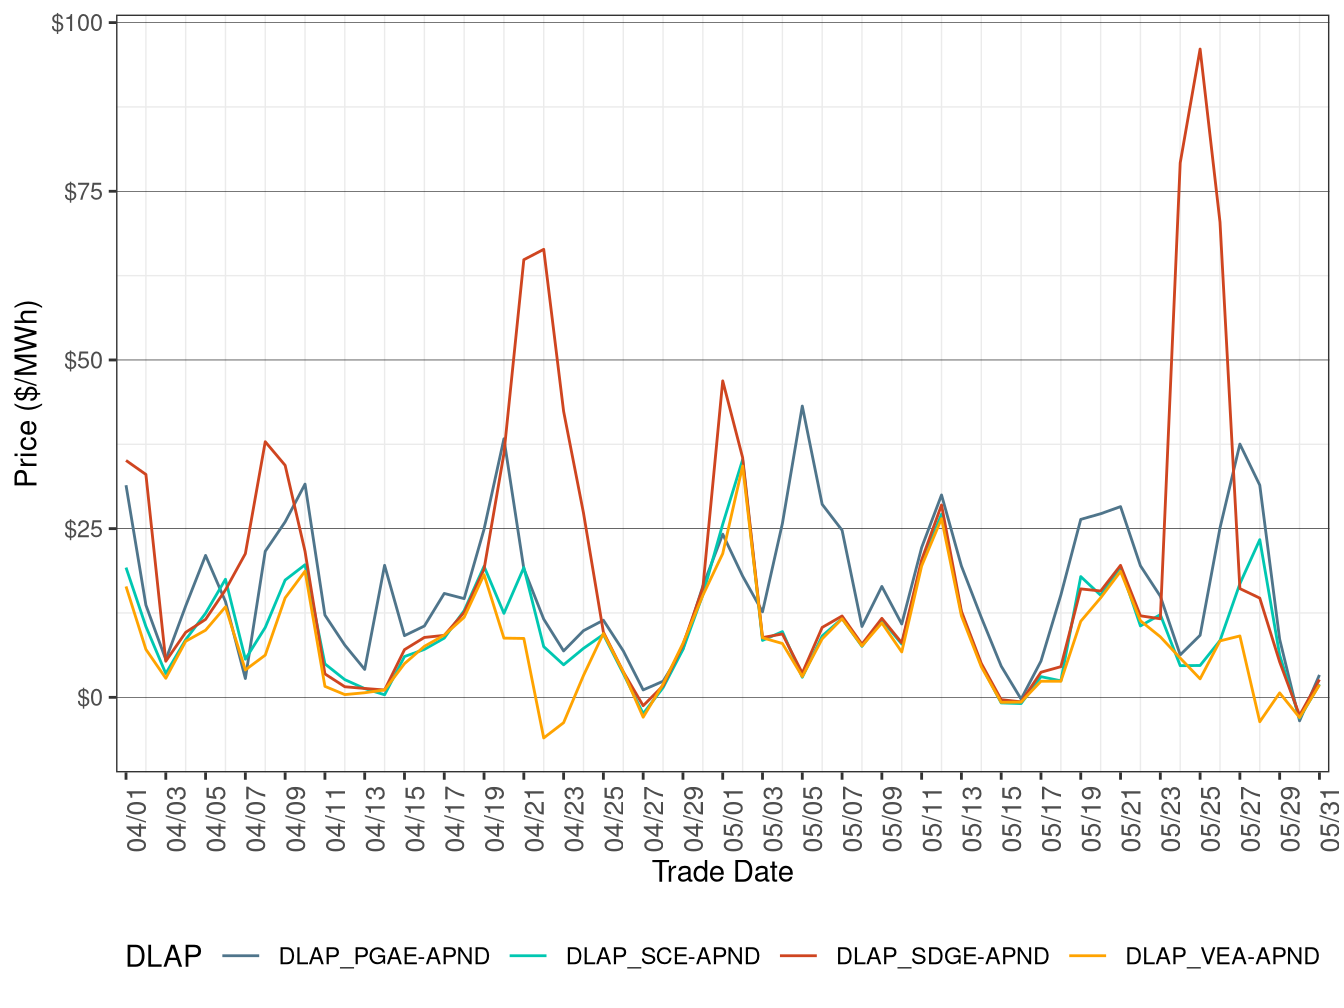
Figure 3.5 below shows the daily frequency of positive price spikes and negative prices by price range for the DLAPs in RTD.
The cumulative frequency of prices in RTD above $250/MWh increased from 0.10 percent in April 2026 to 0.11 percent in May 2026, while the cumulative frequency of negative prices increased from 31.31 percent in April 2026 to 32.11 percent in May 2026.
Figure 3.5: Daily Frequency of RTD DLAP Positive Price Spikes and Negative Prices