Section 1 Market Characteristics
Loads
Figure 1.1 shows system peak load.
Peak loads for the ISO area increased in May compared to the previous month.
Figure 1.1: System Peak Load
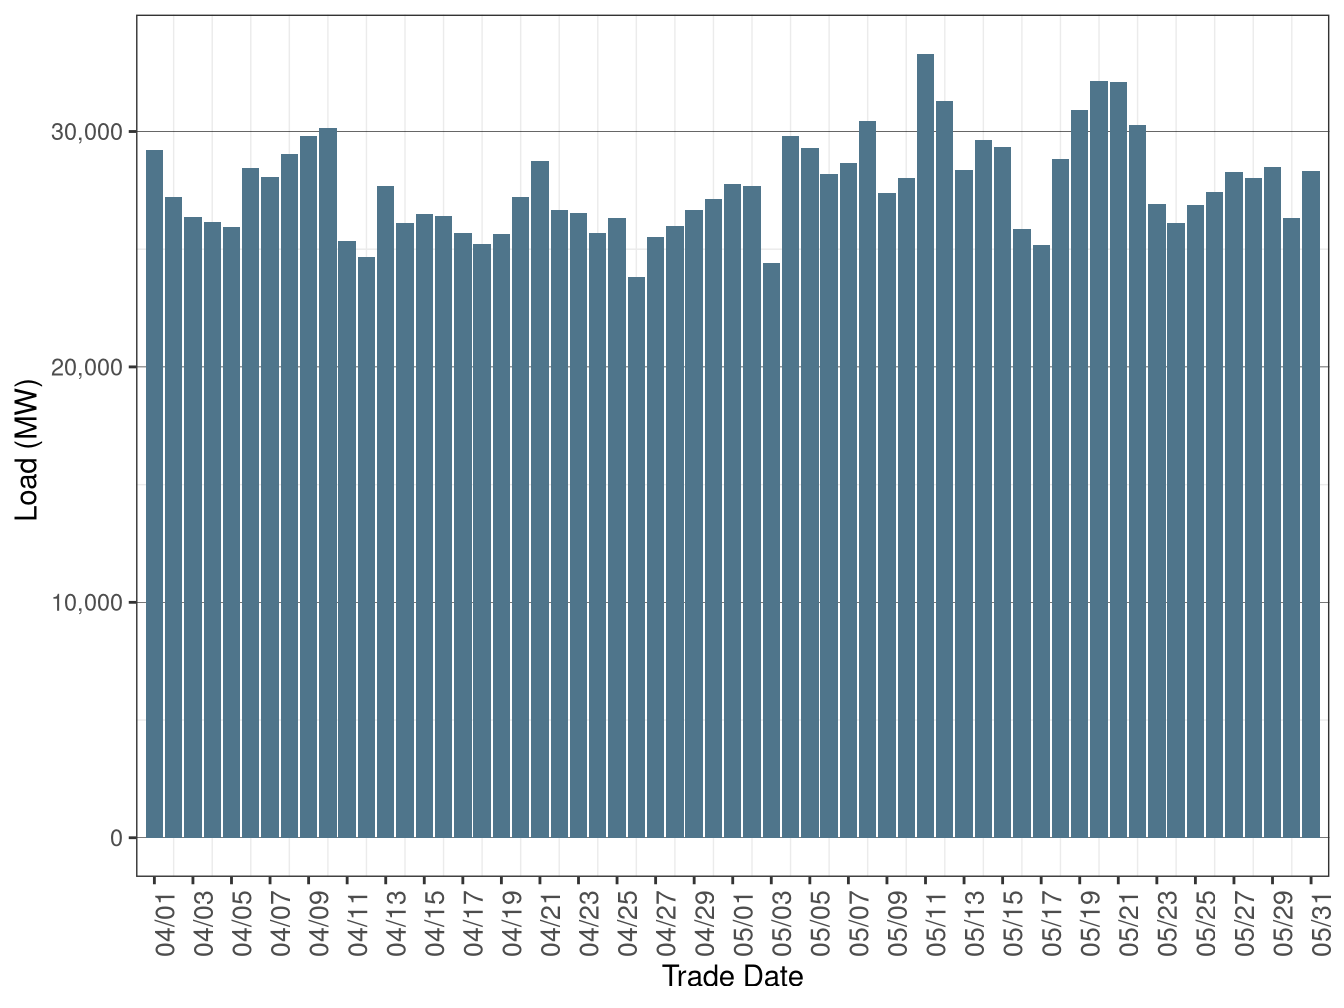
Figure 1.1 shows system peak load.
Peak loads for the ISO area increased in May compared to the previous month.
Figure 1.1: System Peak Load