Section 7 Cost Allocation Metrics
Bid Cost Recovery
Figure 7.1 shows bid cost recovery payment in the IFM and RTM markets.
The total bid cost recovery decreased from $12.64 million in April 2026 to $11.87 million in May 2026. Out of the total monthly bid cost recovery payment in May, the IFM market contributed 31.0 percent and RTM contributed 69.0 percent of the total bid cost recovery payment.
Figure 7.1: Bid Cost Recovery by Market
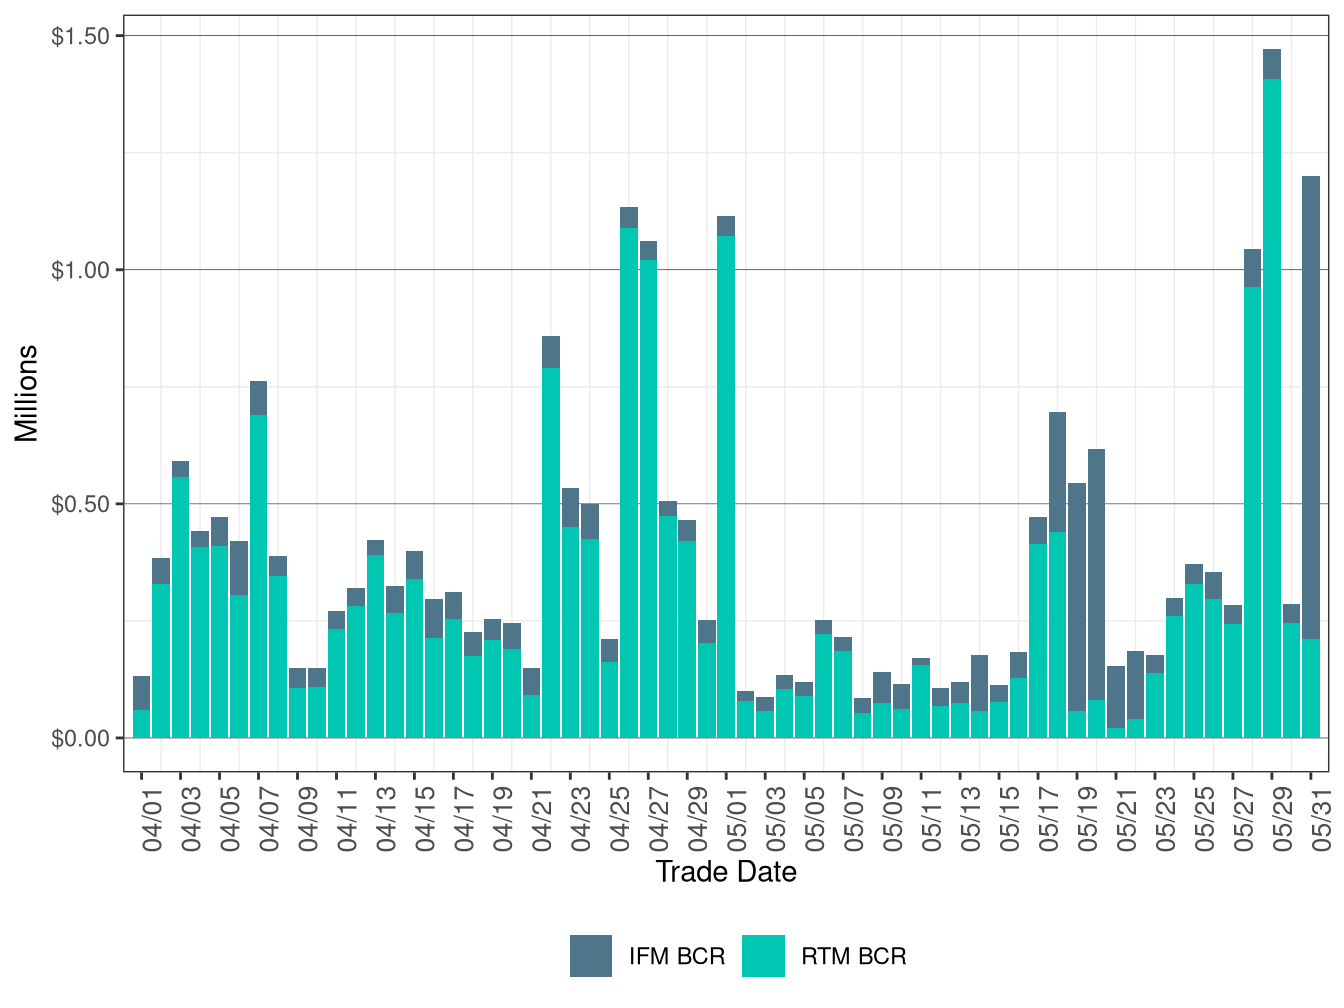
Figure 7.2 shows daily BCR across the IFM and RTM markets by local capacity requirement area (LCR). Figure 7.3 shows monthly BCR in IFM and RTM markets by LCR.
Figure 7.2: Bid Cost Recovery by LCR
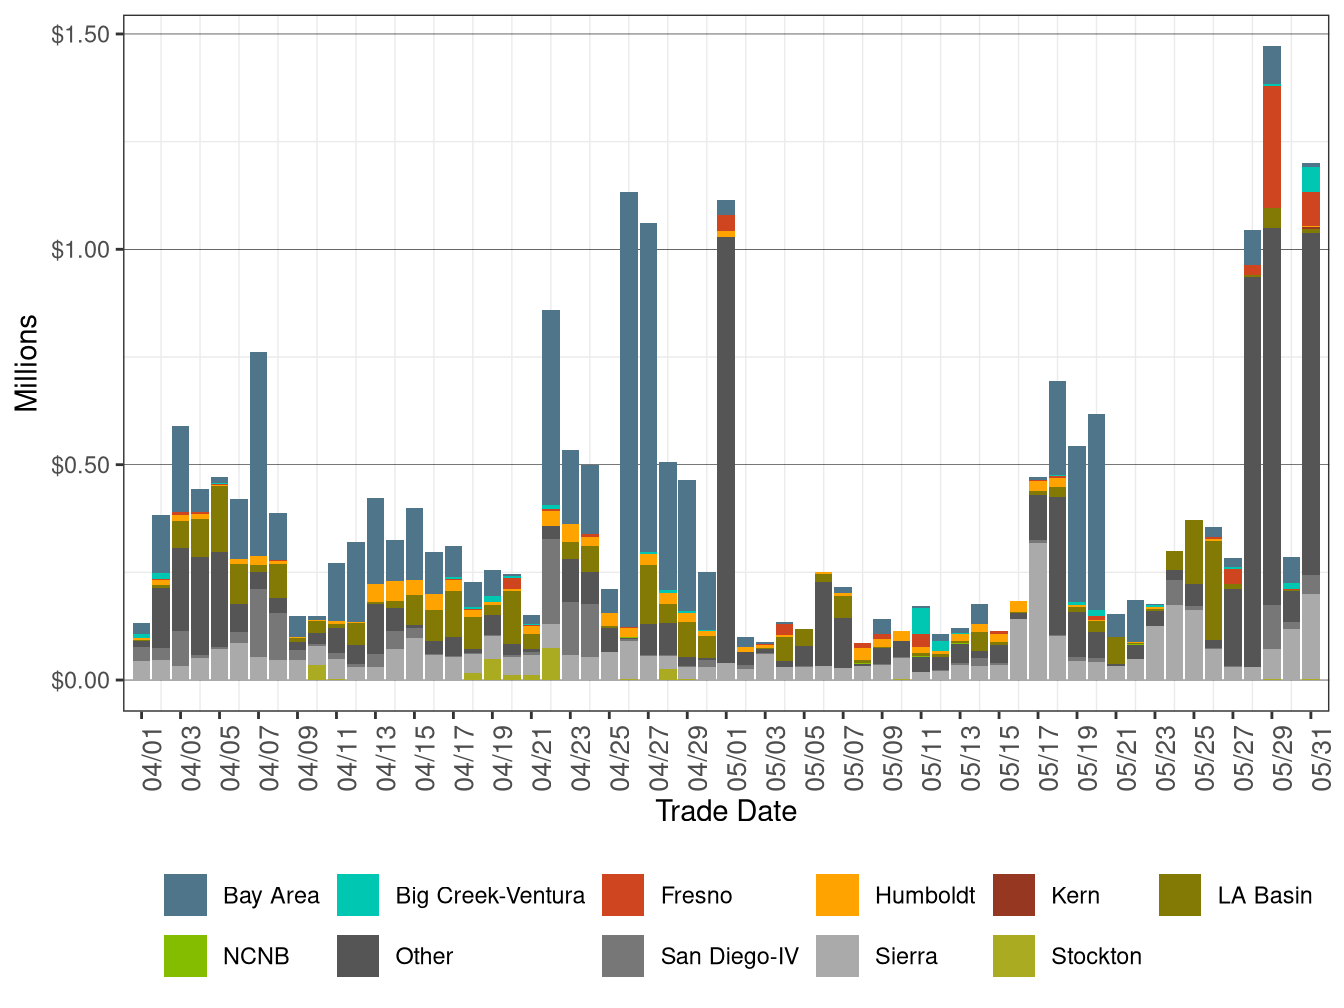
Figure 7.3: Monthly Bid Cost Recovery by LCR and Market
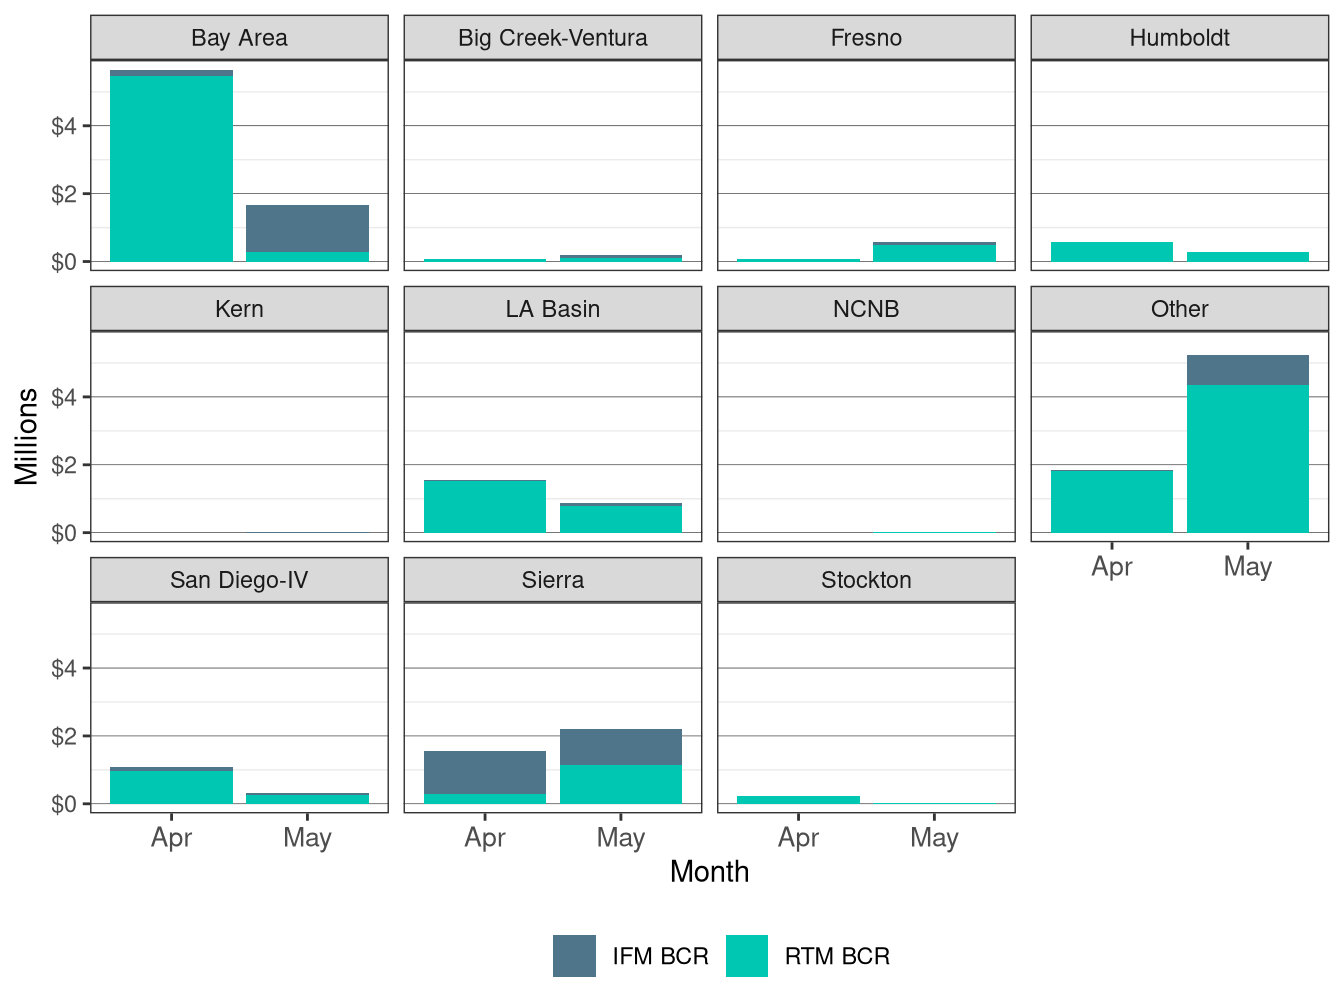
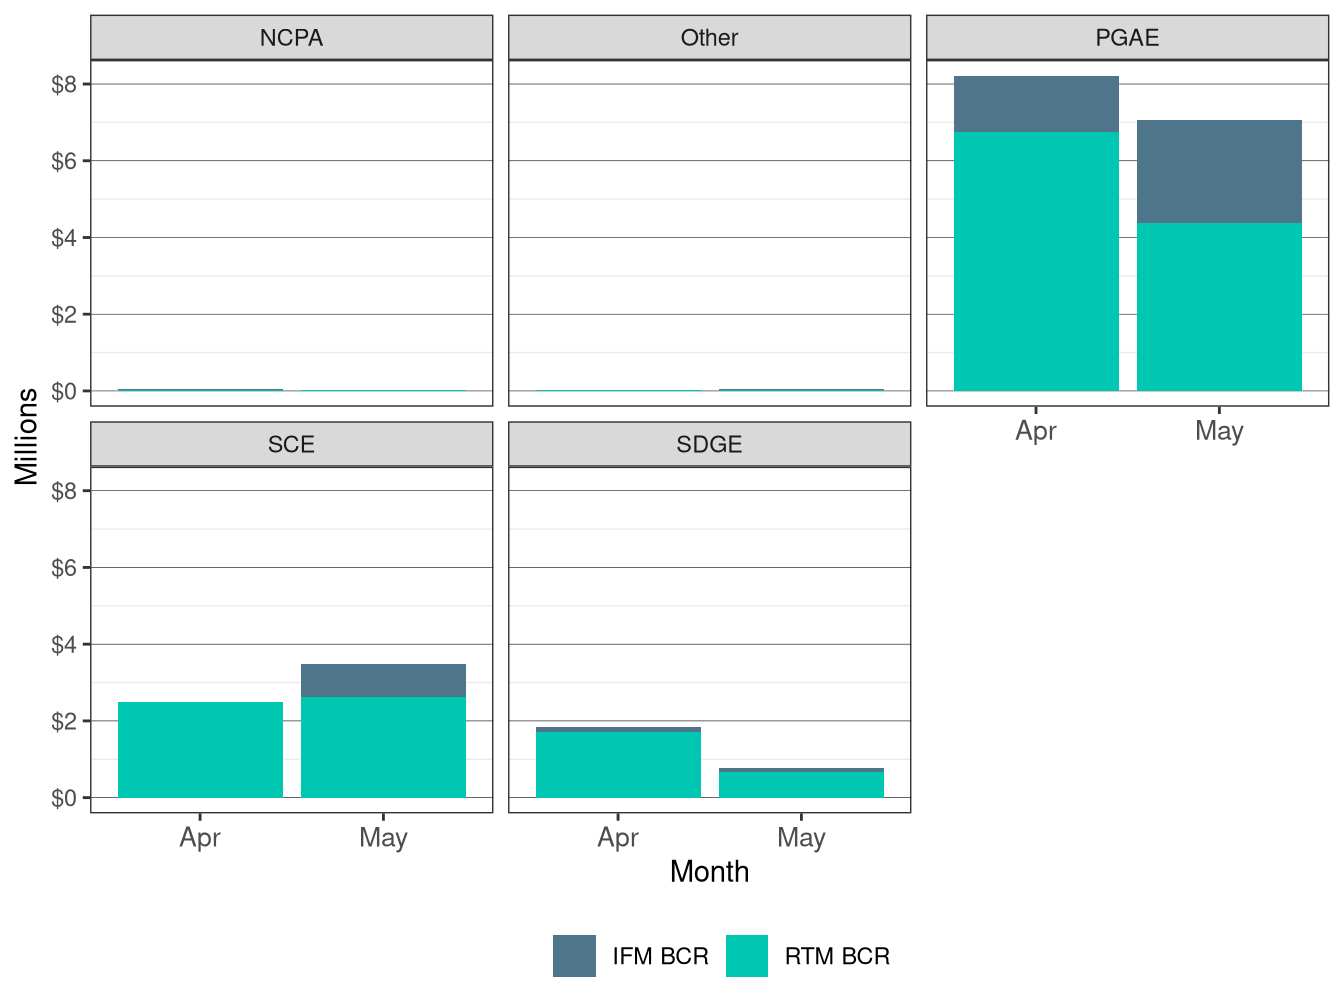
Figure 7.4 shows daily BCR across the IFM and RTM markets by utility distribution company (UDC). Figure 7.5 shows monthly BCR IFM and RTM markets by UDC.
Figure 7.4: Bid Cost Recovery by UDC
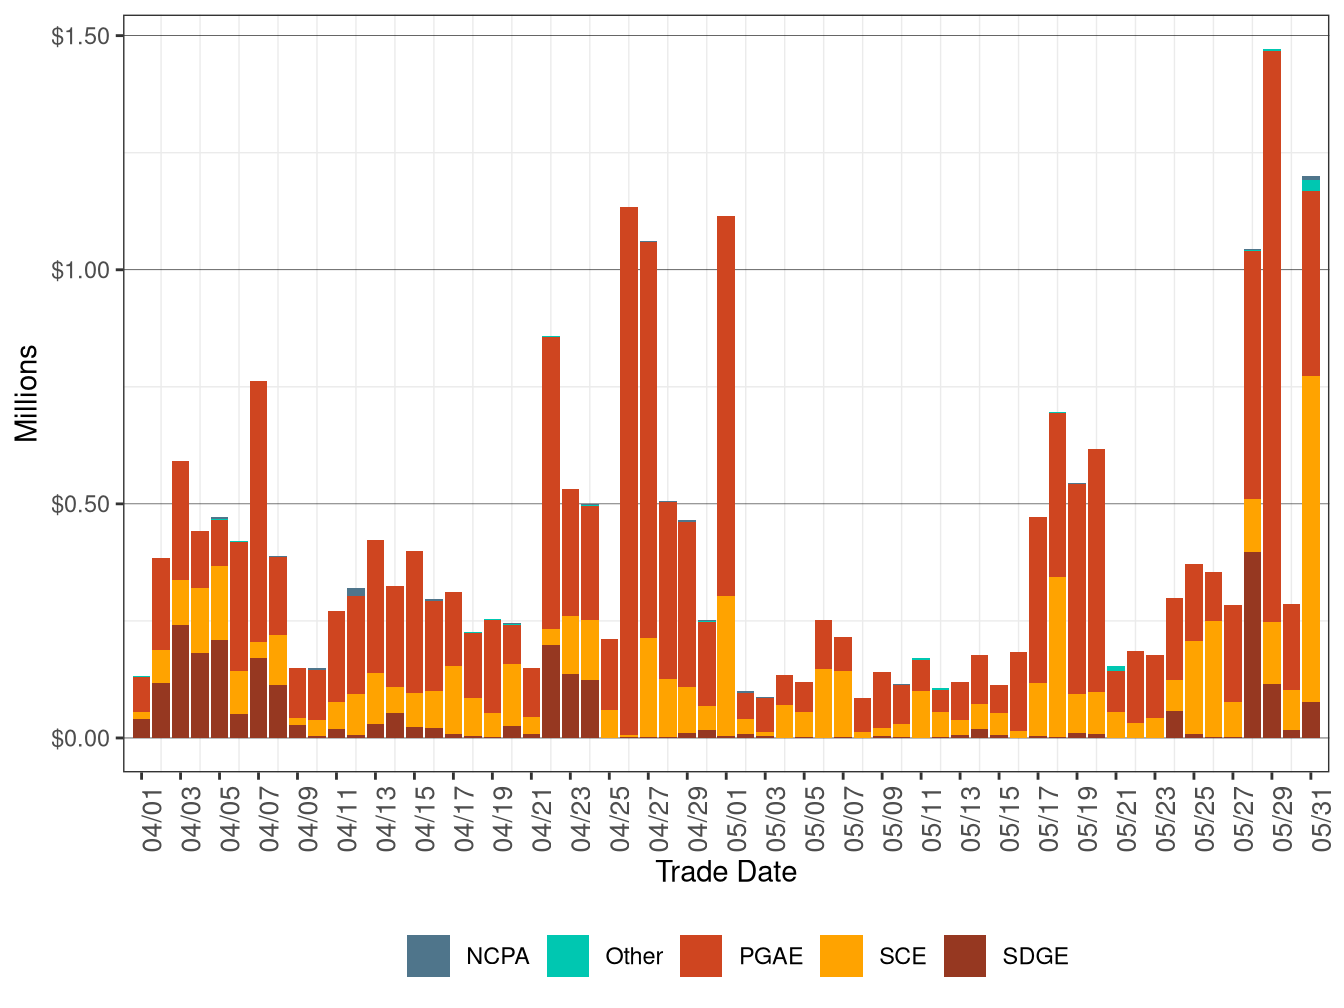
Figure 7.5: Monthly Bid Cost Recovery by UDC and Market
Cost in Real-Time
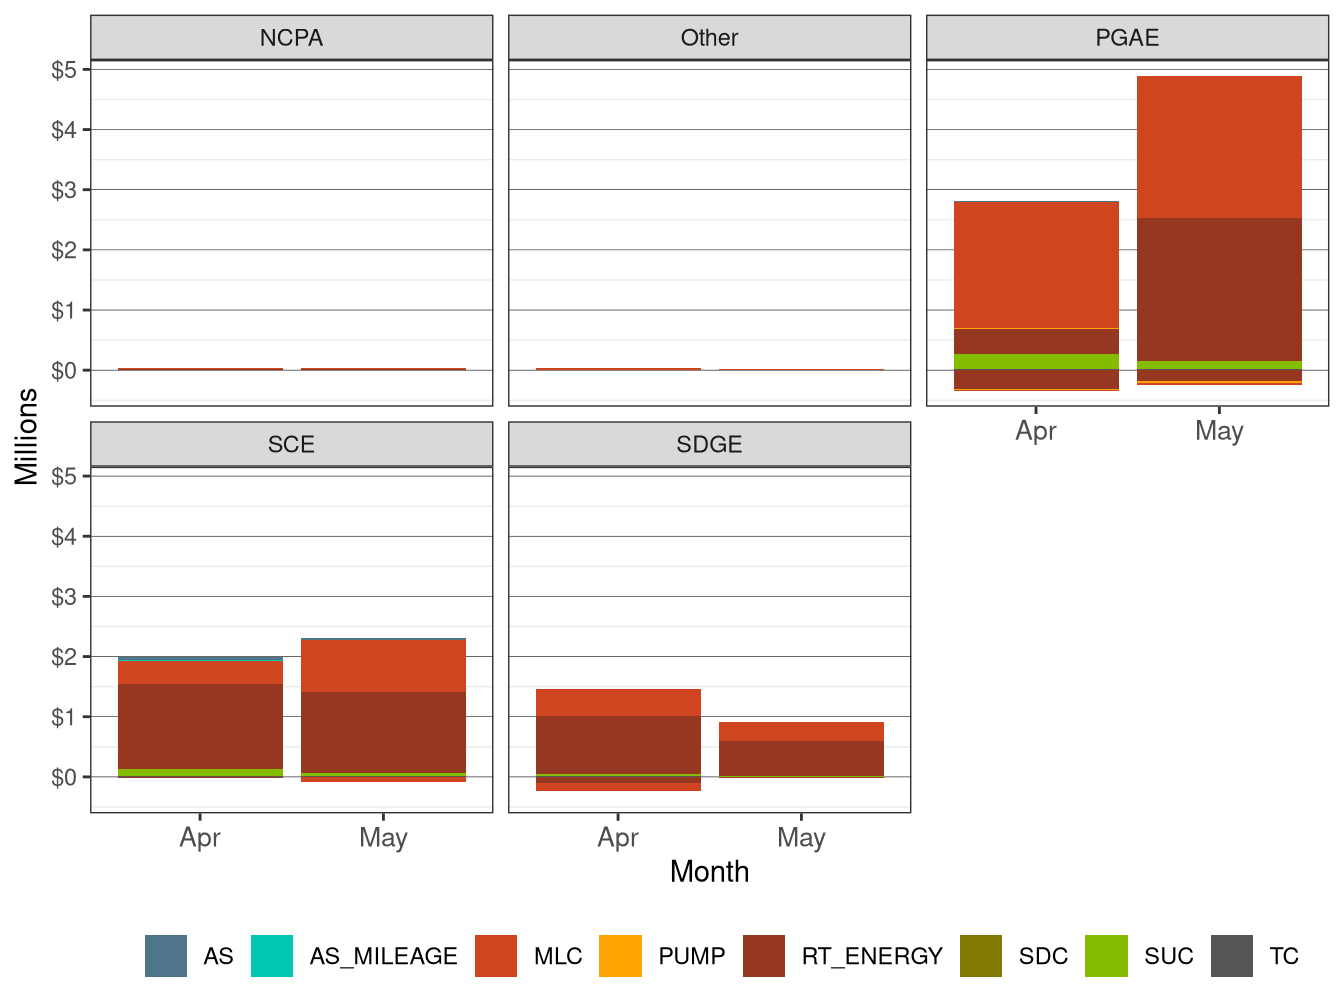
Figure 7.6 shows the daily bid cost recovery in Real-Time (RT) by cost component: Ancillary Service (AS and AS_MILEAGE), Minimum Load Cost (MLC), Pumping Cost (PUMP), Energy (RT_ENERGY), Shutdown Cost (SDC), Startup Cost (SUC) and Transition Cost (TC). Figure 7.7 shows daily BCR in RT by LCR. Figure 7.8 shows monthly BCR in RT by cost components and LCR. Figure 7.9 shows daily BCR in RT by UDC. Figure 7.10 shows monthly BCR in RT by cost components and UDC.
Figure 7.6: BCR in RT by Cost Component
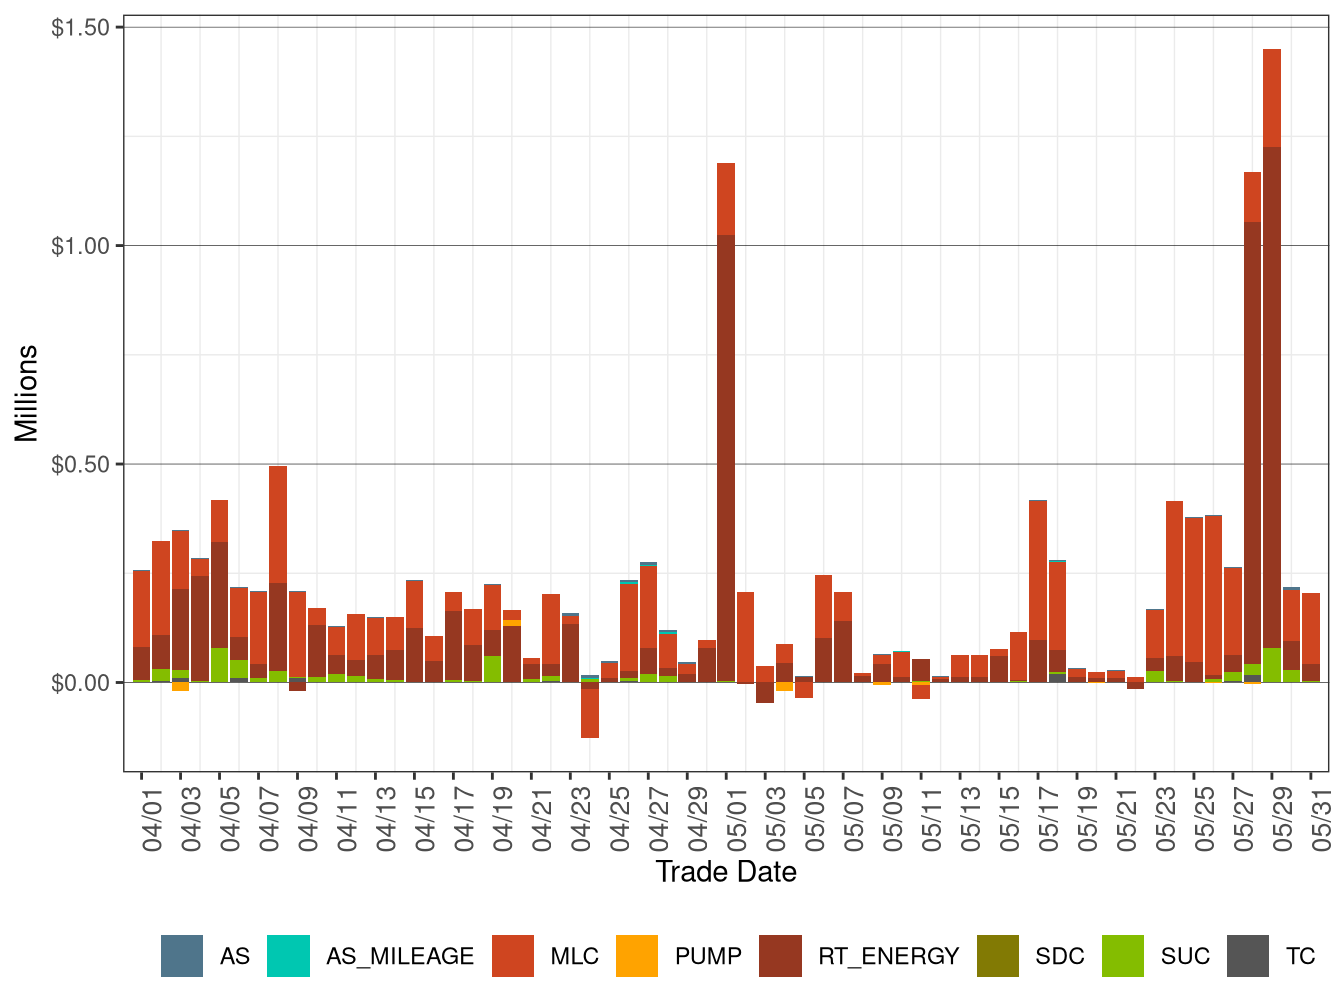
Figure 7.7: BCR in RT by LCR
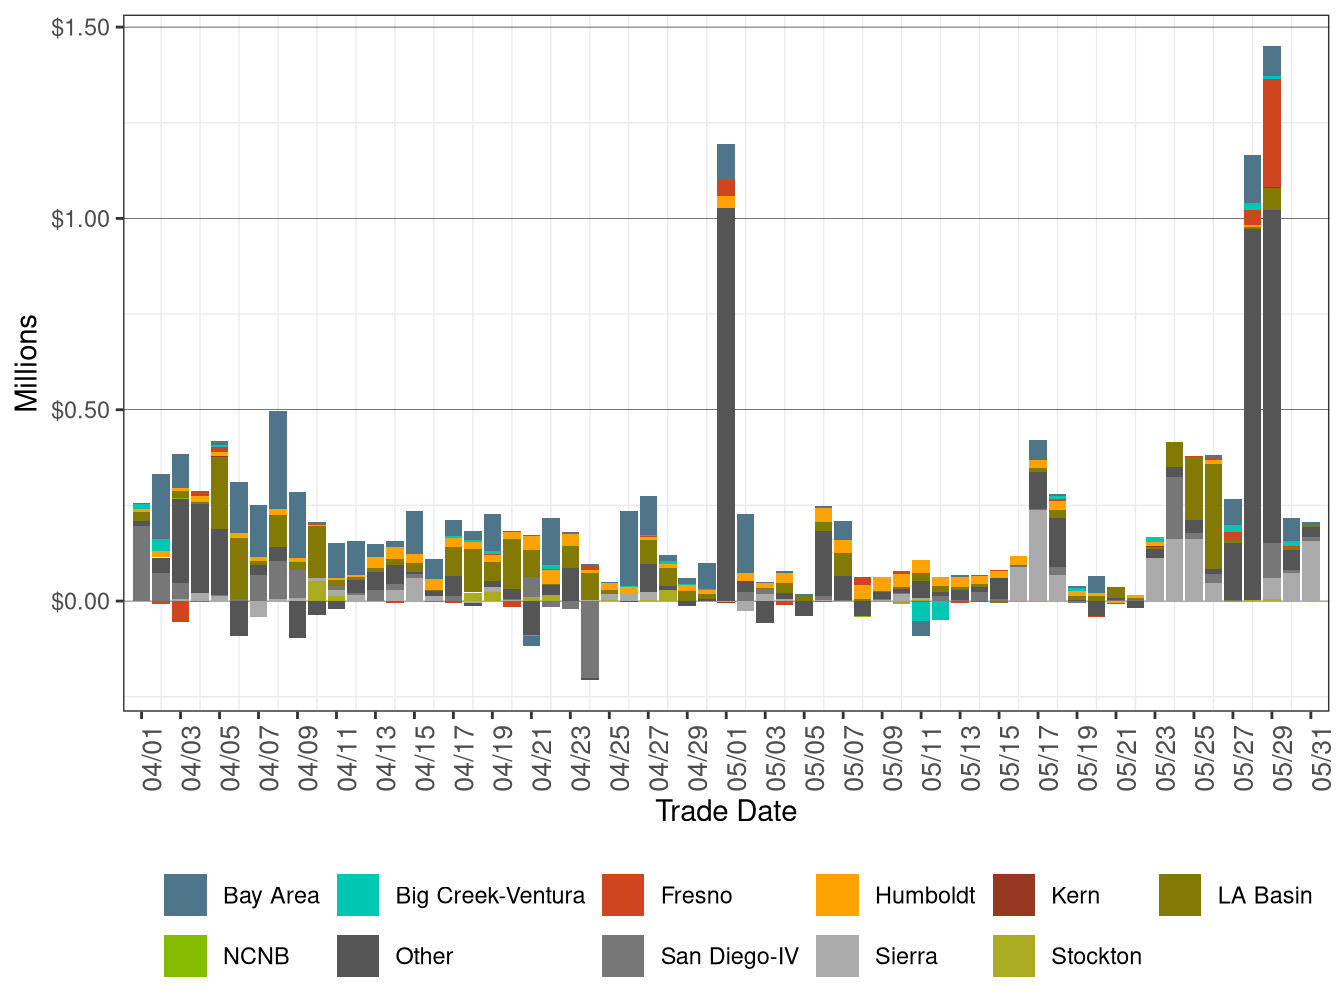
Figure 7.8: Monthly BCR in RT by LCR and Cost Component
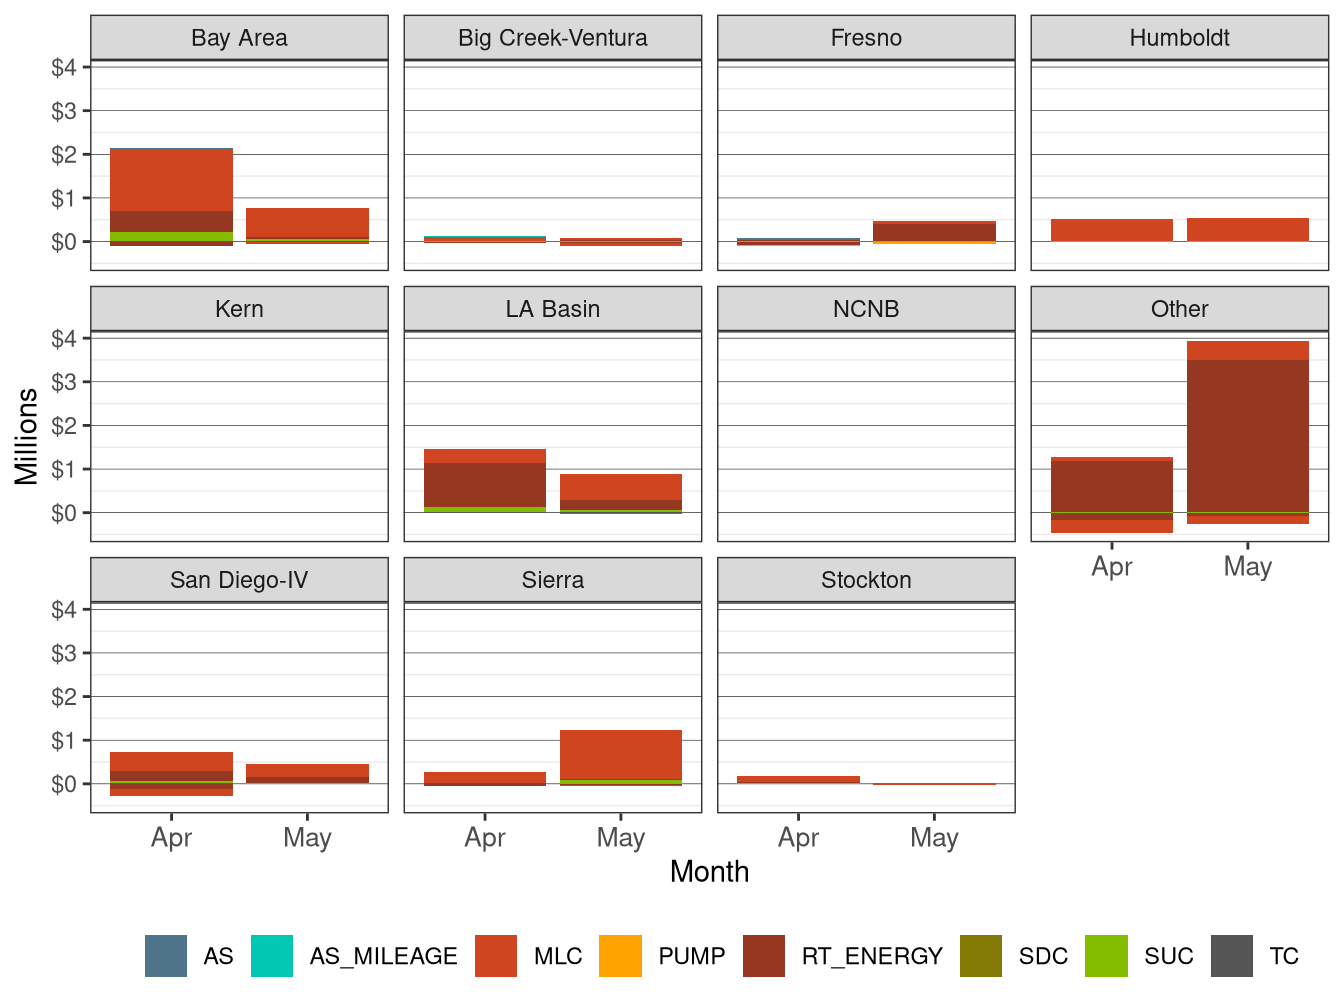
Figure 7.9: BCR in RT by UDC
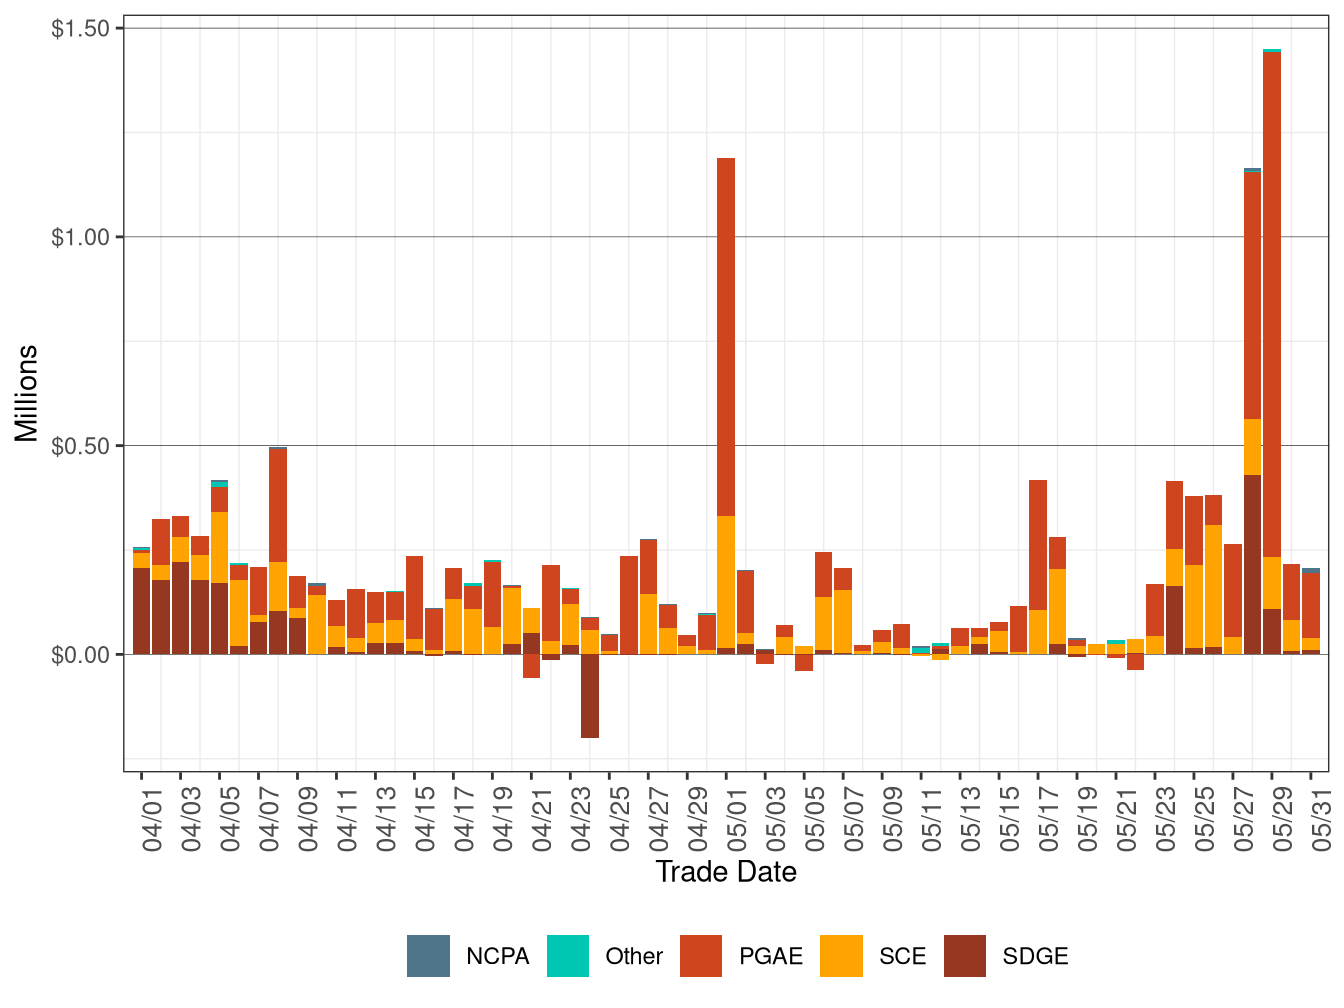
Figure 7.10: Monthly BCR in RT by UDC and Cost Component
Cost in Integrated Forward Market
Figure 7.11 shows the daily bid cost recovery in IFM by cost component: Ancillary Service (AS), Bid Cost (BID_COST), Pump Cost (PUMP), Minimum Load Cost (MLC), Startup Cost (SUC), and Transition Cost (TC). Figure 7.12 shows daily BCR in IFM by LCR. Figure 7.13 shows monthly BCR in IFM by cost components and LCR. Figure 7.14 shows daily BCR in IFM by UDC. Figure 7.15 shows monthly BCR in IFM by cost components and UDC.
Figure 7.11: BCR in IFM by Cost Component
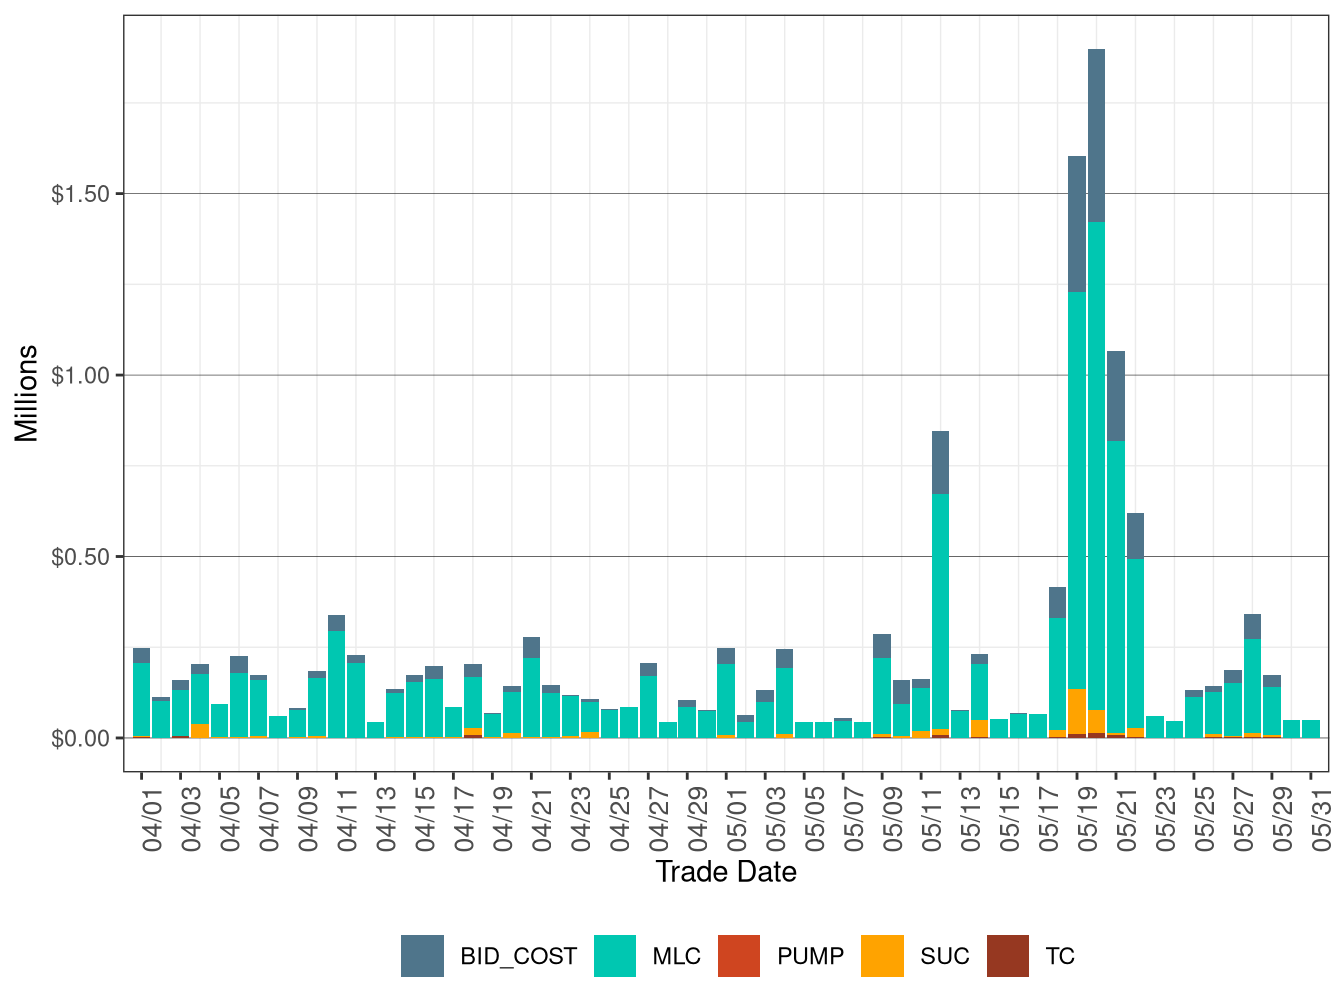
Figure 7.12: BCR in IFM by LCR
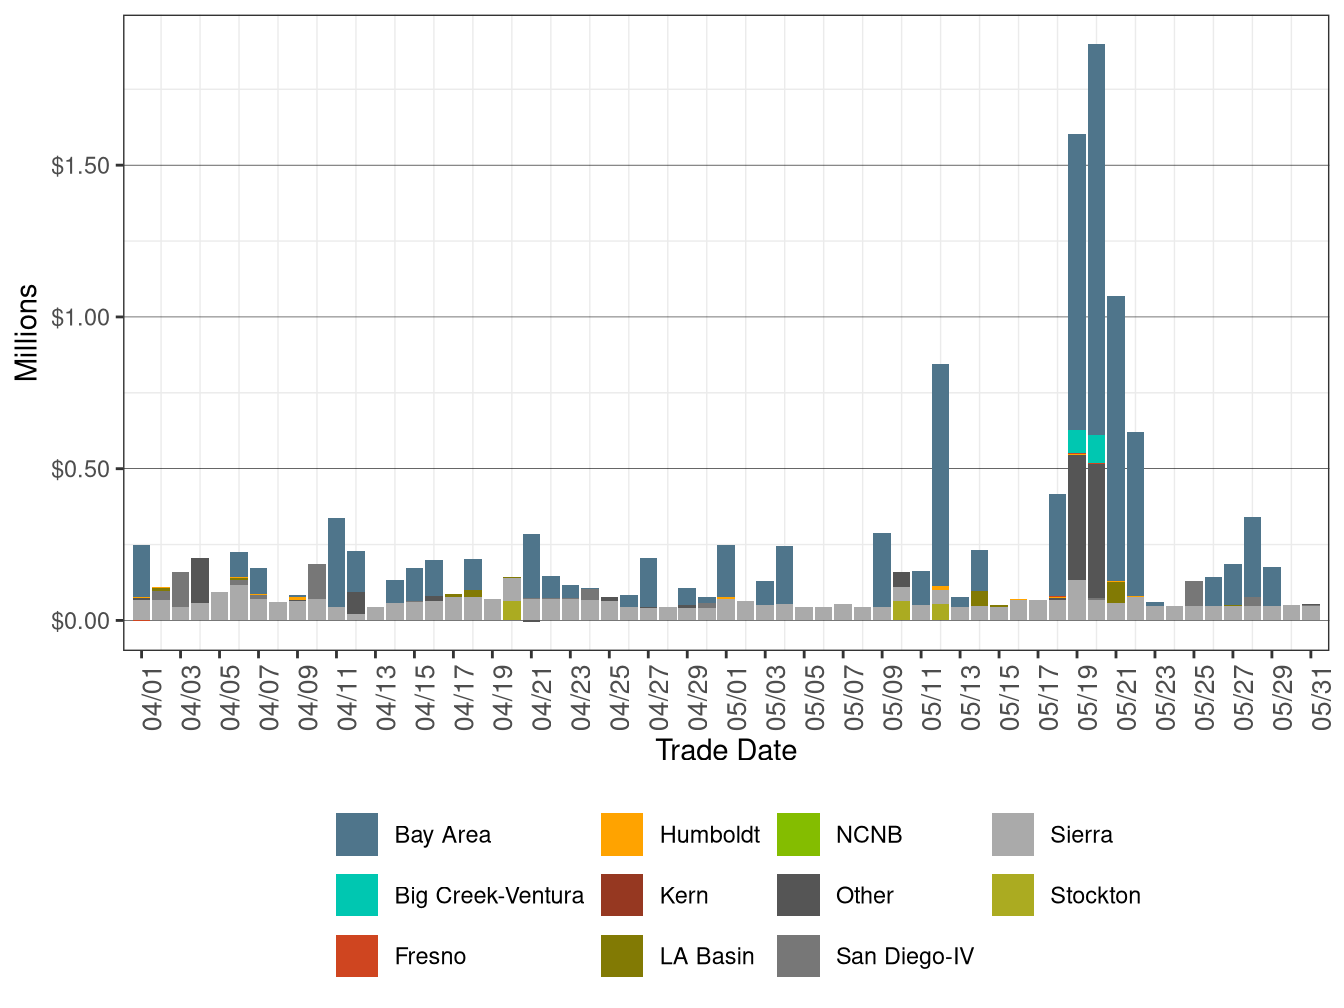
Figure 7.13: Monthly BCR in IFM by LCR and Cost Component
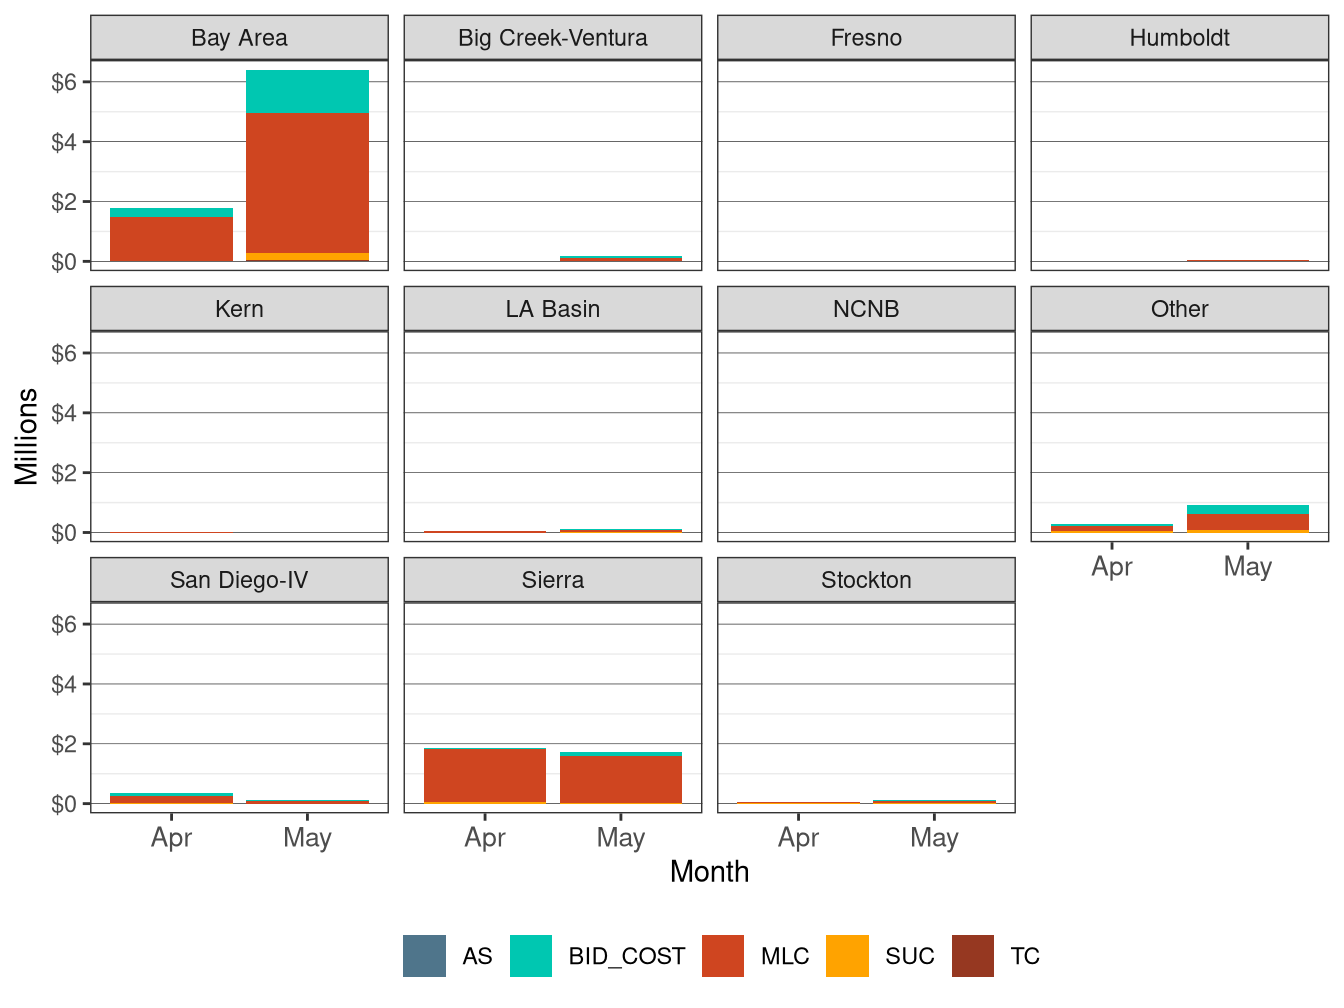
Figure 7.14: BCR in IFM by UDC
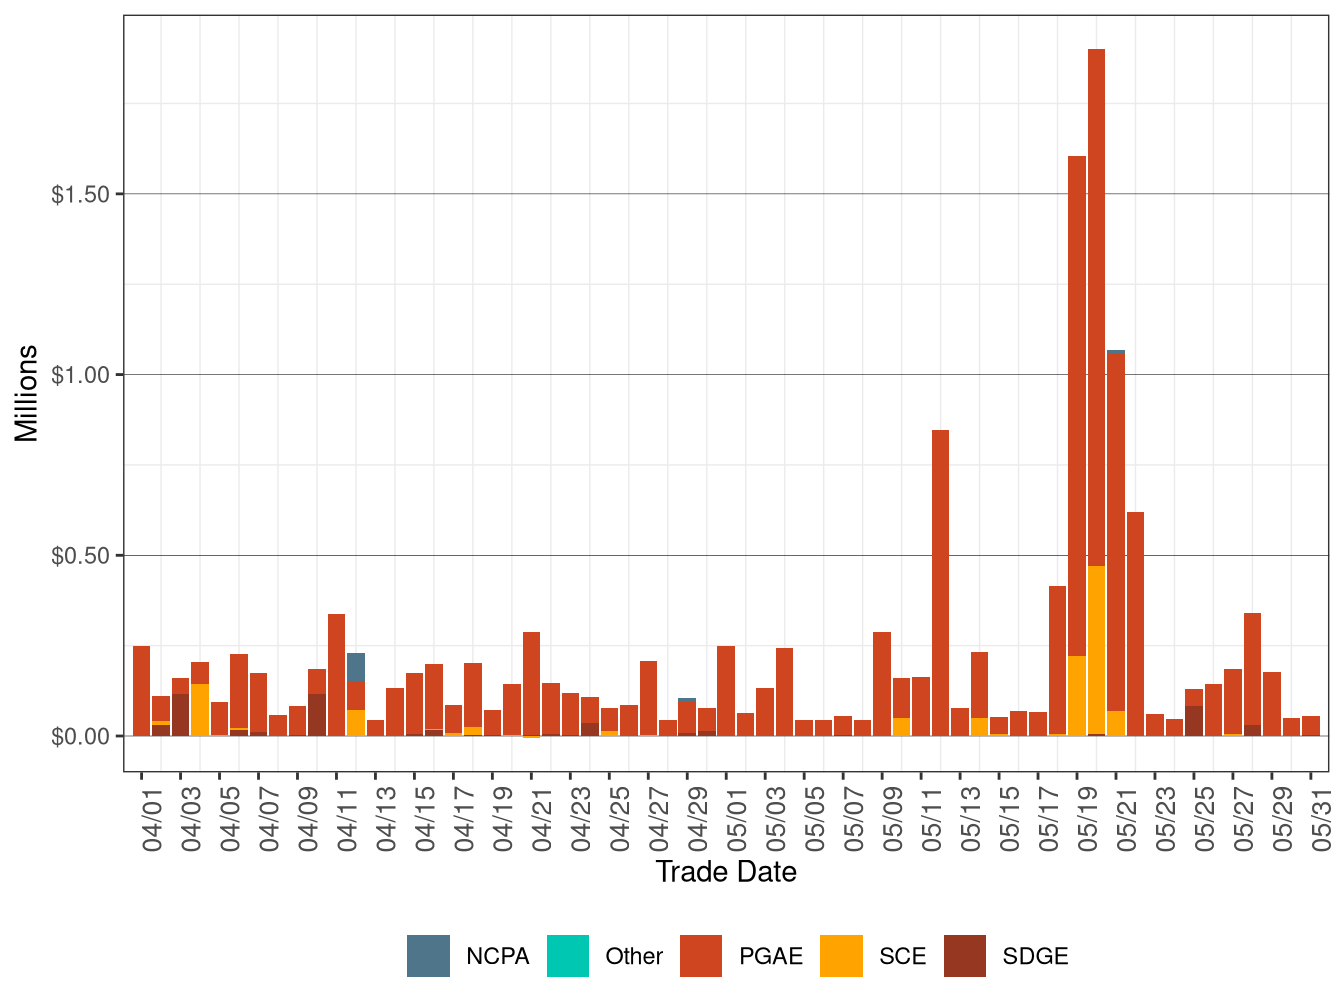
Figure 7.15: Monthly BCR in IFM by UDC and Cost Component
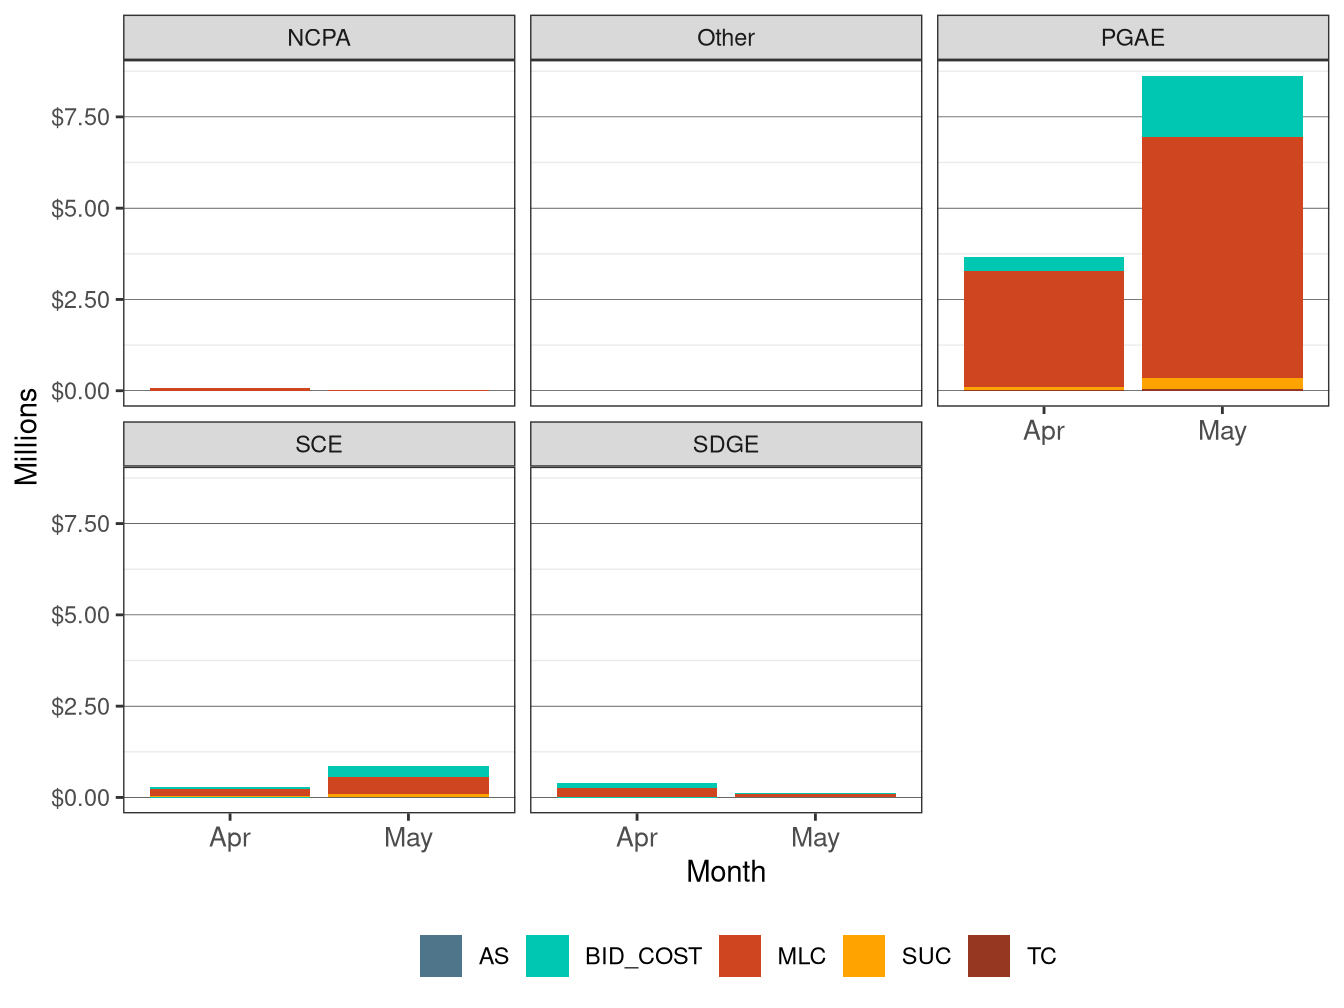
Real-Time Imbalance Offset Costs
The real-time imbalance offset cost is the difference between the total money paid by the CAISO and the total money collected by the CAISO for energy settled at real-time prices. Imbalance is driven by changes from the day-ahead market to the 15-minute market, or from the 15-minute market to the 5-minute market. The imbalance offset amounts can either be a net charge or a net payment to demand. Since the implementation of the new market within the California ISO system, the imbalance offset amount has been a charge to measured demand (physical load and exports) and is based on measured system demand. This settlement amount is mainly driven by the price divergence between the FMM and the RTD market and the use of average hourly price for the RT demand imbalance energy settlement.
Real-time imbalance offset costs consist of three elements, namely: the real-time congestion imbalance offset, real-time loss imbalance offset and the real-time imbalance energy offset.
The real-time congestion imbalance offset charge (RTCIO) is defined as the real-time congestion fund net of the real-time congestion credit calculated as provided in tariff section 11.5.4. In other words, the real-time congestion offset amount is the difference between the total congestion revenue paid out in the real-time market and the total congestion revenue collected from the real-time market for both energy and ancillary services. The real-time market includes both the hour-ahead scheduling process (HASP) and RTD market. The real-time congestion offset (CC 6774) is allocated to all scheduling coordinators based on measured demand, excluding demand associated with existing transmission rights (ETC), transmission ownership rights (TOR) or converted rights (CVR) self-schedules for which IFM and RTM congestion credits were provided.
The real-time loss imbalance offset is the difference between loss revenue paid out in the real-time market and the loss revenue collected in the real-time market. This real-time loss offset is allocated to all scheduling coordinators based on measured demand, excluding demand associated with TOR self-schedules. The imbalance loss offset is captured as part of the imbalance energy offset.
The real-time imbalance energy offset (RTIEO) is a residual calculation. The settlement amounts for the instructed imbalance energy (IIE), uninstructed imbalance energy (UIE), and unaccounted for energy (UFE) are summed up; this value represents the real-time imbalance revenue. The real-time congestion offset and the real-time loss offset are both subtracted from the real-time imbalance revenue; and the resultant residual value is known as the RTEIO. The RTIEO is allocated to all scheduling coordinators based on a pro-rata share of their measured demand, excluding demand quantity for the valid and balanced portion of TOR contracts and self-schedules in real-time. The real-time imbalance energy offset allocation is the same as the real-time loss offset allocation.
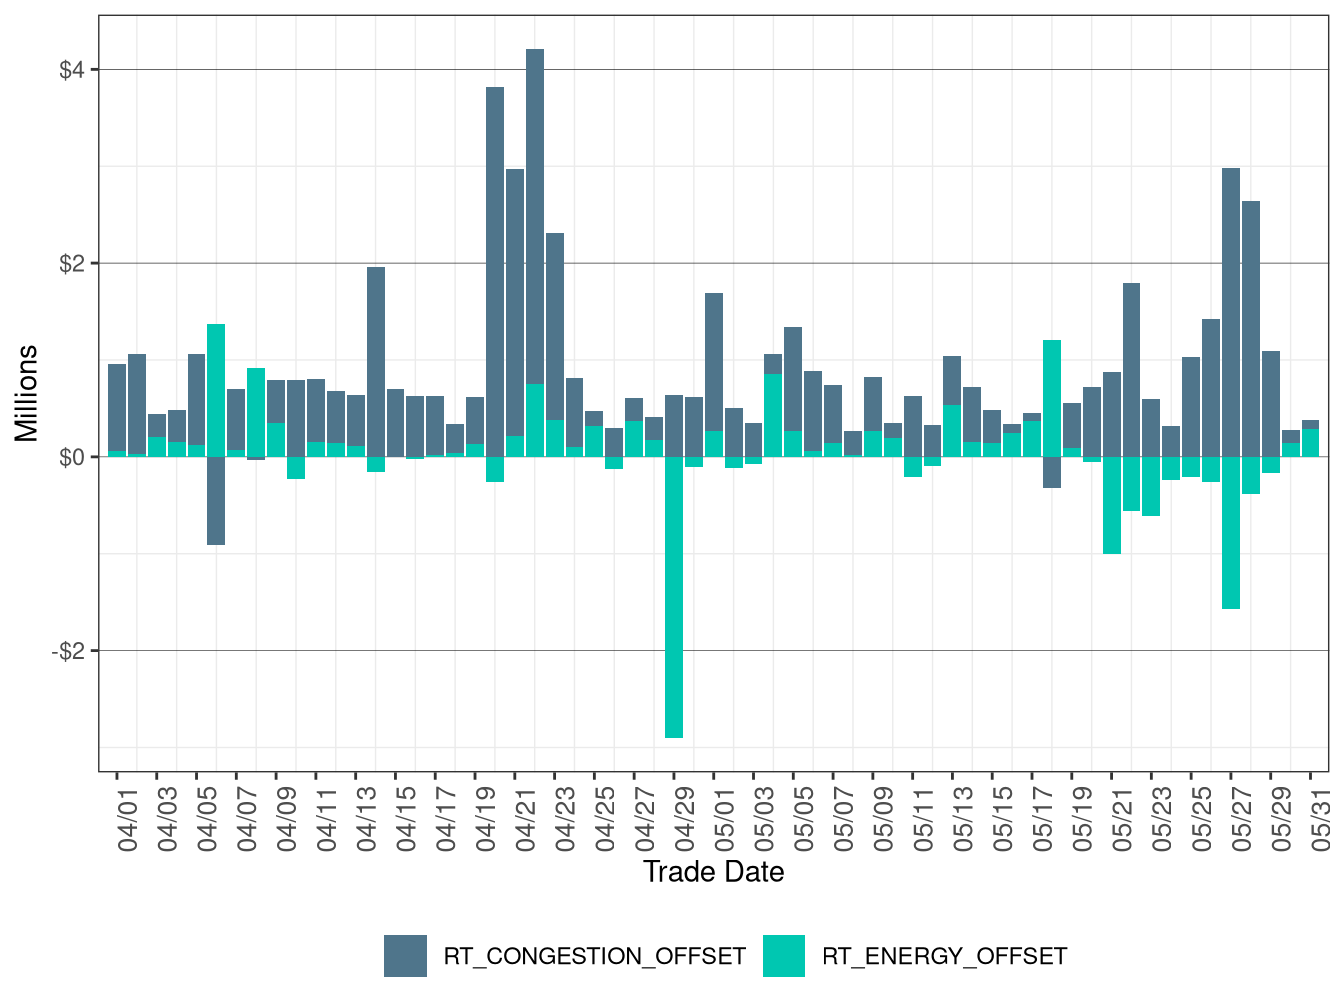
Figure 7.16 shows the daily RTIEO and RTCIO for CAISO. A positive value indicates a charge to measured demand and a negative value indicates a payment to measured demand.
RTIEO increased from $2.41 million in April 2026 to $4.14 million in May 2026. RTCO decreased from $25.64 million in April 2026 to $18.68 million in May 2026.
Figure 7.16: ISO RTCO and RTIEO
Exceptional Dispatch Uplift Costs
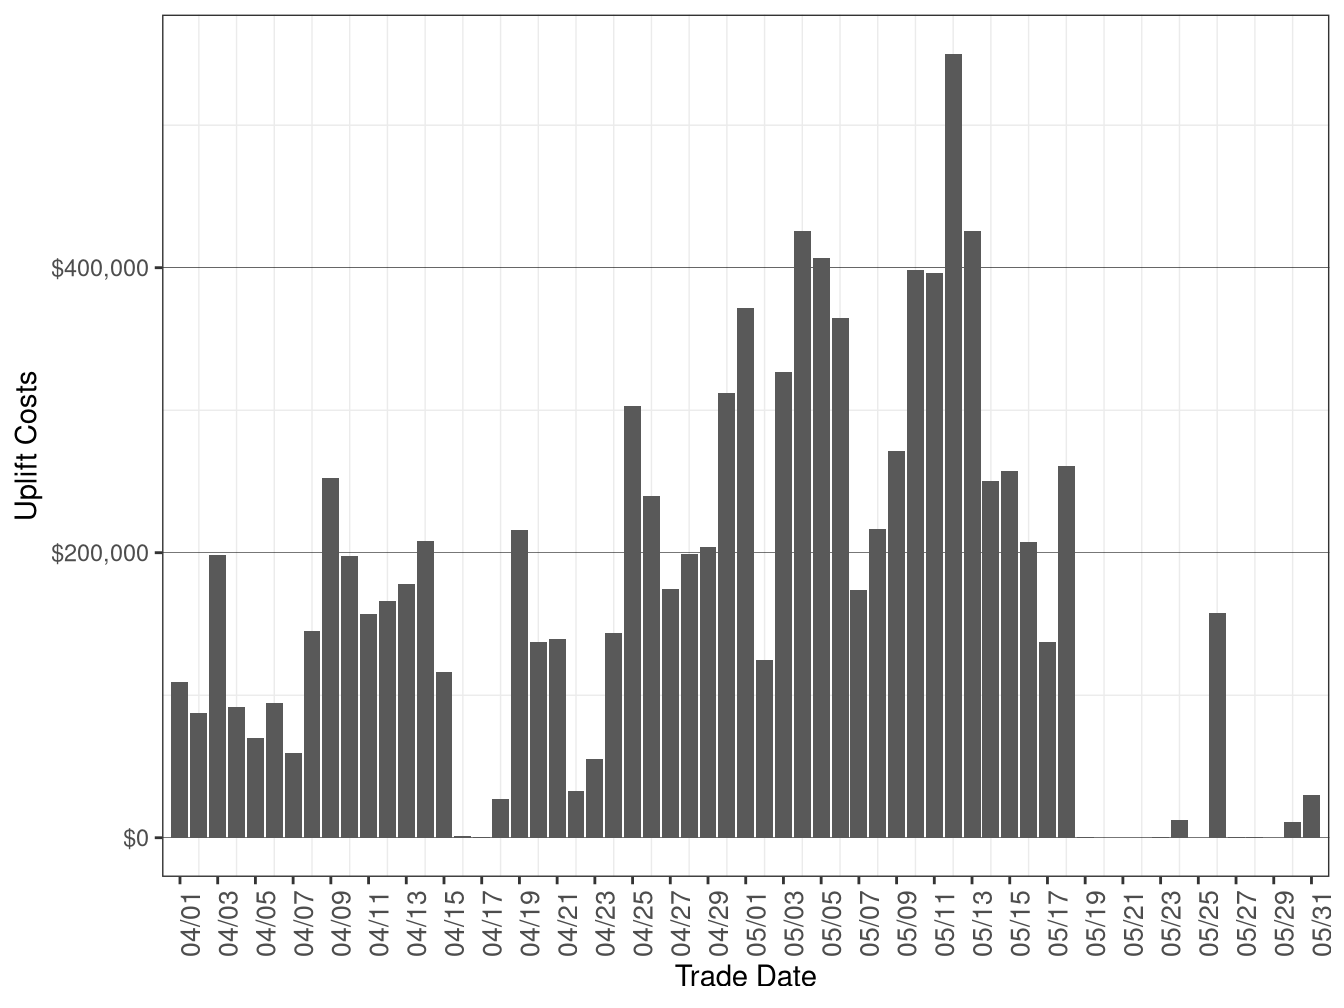
Figure 7.17 shows the daily exceptional dispatch uplift payments which include the sum of the charge codes 6482, 6488, and 6470.
The monthly exceptional dispatch uplift payments increased from $4,317,762 in April 2026 to $5,777,890 in May 2026.
Figure 7.17: Daily Exceptional Dispatch Uplift Costs