A “Super” Energy Touchdown

It’s hard to say what requires more energy, playing four quarters in the biggest game of the year, or powering every television tuned in to watch it.
While the game will be played right here in California, 120 million Americans across the country will be tuning in using electricity to host their home watch parties. For the matchup between the New England Patriots and the Seattle Seahawks, people will be using electricity for many things.
Whether it’s a Super Bowl™ party with that same group of friends who visit each year, or enjoying it with family—the TV will be on, the Wi-Fi router working overtime, food will be prepared, drinks will be chilled, the heater, microwave, and blender are all likely to be running.
That’s going to take a lot of energy.
No flag on these plays
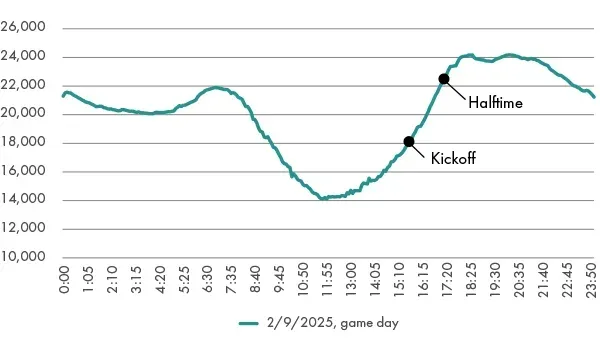
From kick-off to the presentation of the Vince Lombardi Trophy, the California ISO (CAISO) can see the way energy demand changes during the game. The demand trend during the Super Bowl has a very distinct shape.
Curious about energy demand? Check out Today’s Outlook.
Although the energy demand trend on Super Bowl Sunday isn’t as glaring as say a prolonged heat wave where energy usage increases because of air conditioners, the behavioral changes in energy usage on game day are noticeable with data tracking.
So, what are the behavioral energy usages that change because of the Super Bowl?
Kick-off
Most noticeable is the spike in energy demand at the start of the game. Usage starts to climb during the pre-game show, and kickoff is clearly visible on the demand line as people gather around TVs across the nation to watch the game.
Pass the nachos
While the football game is on in one room, the kitchen will be busy cranking out a “super” spread! Ovens will be cranked up to cook hot wings, nacho cheese will be melted in microwaves, chili will simmer on stoves. This increase in appliance usage in the kitchen can actually be seen in trend graphs.
Commercial break
Some people tune in just for the commercials. Super Bowl ads are famously more elaborate and funny, some even poignant and moving. But energy-use patterns show commercials are also prime time for grabbing another hot dog or a cold drink from the fridge.
Trend lines from Super Bowl Sunday show clear shifts in energy demand when the commercials come on. Short spikes appear as people open refrigerators, pop a cold burrito in the microwave, and even bathroom use increases—triggering added demand for water system pumps.
Halftime
If your team isn’t in the big game, maybe you’re looking forward to the halftime show.
Energy demand at the start of halftime changes for a similar reason to regular commercial breaks: people take a few minutes to get food or drinks, then head back to the TV to watch the show. Once the players retake the field, energy demand returns to the same pattern.
It’s good!
Having granular tracking and data means that the ISO can see and anticipate the needs of its balancing area. Insights into the way energy demands change on specific days means more accurate forecasting.
Whatever your reason to watch, you can relax while the ISO follows its “playbook” to ensure there are no energy interruptions on your big day.
™ National Football League (NFL)