< Back to blog
Storage surpasses 5,000 MW on the CAISO grid
By Gabe Murtaugh, CAISO Storage Sector Manager
July 12, 2023
 California has ambitious climate targets in an effort to decarbonize its electric grid and combat climate change. To help reach these goals, which include generating energy in a greenhouse gas-neutral manner by 2045, the California Public Utilities Commission (CPUC), the California Energy Commission (CEC), and the California ISO have worked collaboratively to construct plans to transition from the current fleet, which is predominantly natural gas generation, to a fleet where most of the energy consumed in the state comes from renewable sources.
Representing the largest concentration of lithium-ion battery storage on any grid in the world, the growing storage capacity – we reached 5,600 MW as of July 1 – is critical in decarbonizing the bulk power system and to our ability to keep the power flowing as California transitions to a carbon-free system. This is a testament to the state policy makers, regulators, utilities, and storage developers who have worked so hard to get us to this point.
At the same time, there has also been a significant amount of work done at the ISO to accommodate these assets on the system. This work includes buildout of new screens and systems for the ISO’s operations team to monitor state of charge of the storage fleet and individual resources. It also includes building new tools to accommodate modeling storage resource participation in the market, as well as additional tools to ensure that payments made to storage resources providing services to the grid are conducted in an accurate and consistent manner.
Early Transition from Greenhouse Gas Emitting Resources
California has been on the forefront of developing clean technology for energy generation for years. In the early 2010s, California was a leader in the rapid deployment of large quantities of relatively unproven utility scale solar technology onto the grid, a technological advance that also came with challenges. These challenges included learning how to operate the grid with generation that has changing output in the morning and evenings and managing generators that could temporarily slow generation or cease generation all together mid-day from cloud cover. The ISO built state-of-the-art systems to monitor and forecast solar generation. It also developed additional redundancies to ensure that when cloud cover occurred and solar generation was temporarily interrupted, electricity services were not. These solutions were built in an automated and scalable manner to help ensure that – as more solar resources were integrated onto the system – grid operators would be able to maintain reliability without significant manual intervention.
The amount of overall installed grid-scale solar resources continues to grow in California, with solar now generating a major portion of energy consumed in the state. In 2022, it totaled almost 20 percent of all energy served by the grid and it is important to keep in mind that these numbers do not include rooftop solar, which effectively reduces the overall load that needs to be served by the grid. Alongside the buildout of solar resources has been a considerable buildout of wind resources, which provided about 9 percent of California’s total load in 2022.
This change in the makeup of resources on the grid impacts how much energy costs at various times of the day. The influx in solar drives the ‘duck curve,’ which is a depiction of the total load that needs to be served without including generation from wind and solar resources – which have very low marginal costs to operate. We refer to this as the net-load curve, and it is important because net-load is highly correlated to the spot price for energy generated by the market. Both prices and the net-load are low in the middle of the night, increase some in the early morning, then decrease dramatically as solar comes online through the middle of the day. Late morning and early afternoon are typically when solar generation is highest and energy prices lowest, which is true throughout the year. In the late afternoon, the net-load and prices rise and in the evening – when solar is almost or completely offline, net-loads and prices are highest, before they fall in the late evening again.
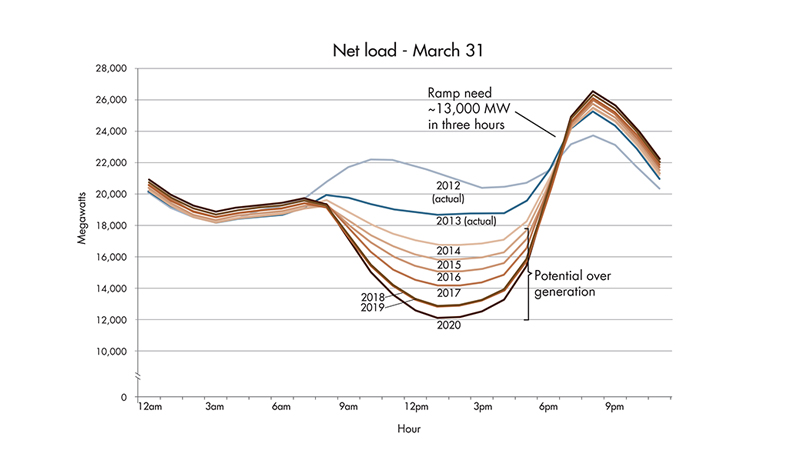
This graphic shows the anticipated changes to the system net-loads with both additional
utility scale and behind-the-meter solar capacity interconnecting to the system.
Current Transition from Greenhouse Gas Emitting Resources
As the state developed its detailed plan to decarbonize the grid and meet its climate objectives for 2045, it called for significant buildout of solar resources, alongside a lesser buildout of wind resources, with these two technologies expected to generate the majority of energy consumed in California. However, since solar resources are only available when the sun is shining, there is inherent variability in the output of both wind and solar, because there is relatively less solar output during the winter when consumption is higher, and because these technologies are not enough for a reliable and cost-effective grid, storage is necessary to address these challenges. Thus, the state’s plan also includes a very large buildout of storage resources.
Storage moves energy from times of the day when solar is abundant and loads are relatively low to when solar is low or offline and loads are relatively high. Storage can also fill in gaps when there is cloud cover or unexpected slack wind during the day. Also, long-duration storage is potentially capable of storing energy in the fall and spring and discharging in the summer and winter. State plans call for an immediate buildout of short-duration storage resources that primarily resolve the first two issues, and only calls for long-duration resources further in the future as the technology continues to develop.
Recognizing the reduced marginal benefits from incremental solar buildout on the system and the general need for storage in the long-run, the CPUC has already begun mandating that entities that serve load across the state begin building out storage resources. This buildout is happening rapidly, and significant amounts of storage are being added to the system every year. The 5,000 MW milestone represents a 10-fold increase from 2020 when we had just 500 MW. Nearly all of these resources are lithium-ion 4-hour duration batteries and by 2024 the CPUC plans call for buildouts that exceed 10,000 MW of aggregate storage on the system. This pace of adoption enhances reliability during the most challenging times of the day and helps ensure that new and existing solar resources are more effective on the grid.
The incentives for companies that own storage resources and the needs of the grid are generally aligned. During times of the day when prices are lowest, and generation is abundant, storage resources are charging and essentially buying energy from the grid. This aligns with the midday hours when solar is most abundant and prices are lowest. During the highest priced hours of the day, storage is discharging and providing energy to the grid. These are the hours when solar is almost or completely off-line and these are the periods of the day when the biggest challenges arise in serving demand. The storage resources operating in the market impact prices in predictable ways and serve as a “dampener” to price spreads throughout the day. When they are charging, storage resources increase overall prices, as the rest of the generating fleet now must produce more energy to serve load and charge batteries. But later in the day, prices are lowered during the peak when storage resources provide additional supply that would not be available otherwise.
Grid Operations and Markets Evolve with Storage Development
Modeling storage resources is different than modelling traditional natural-gas or coal-fired generation. As mentioned earlier, storage resources do not actually generate energy. They move it from one time to another. Second, on net, storage resources consume energy from the grid, while traditional resources do not. Third, storage resources have power limitations on their operation – how much a storage facility is physically capable of producing at any instant in time – but they are also constrained in how much energy they can store and a maximum amount of time they can discharge before needing to recharge. In 2019, in anticipation of the large influx of storage resources coming onto the grid, the ISO began work to develop new market tools to capture the unique characteristics of storage resources so they could be seamlessly integrated to the grid alongside traditional resources.
As that began to occur, storage developers began building resources at or near existing solar generation. Storage developers cited a number of reasons for this. Being at the same physical location as solar resources reduces losses from energy flowing onto the grid before charging the storage resource. Further, a combined solar and storage resource does not need the same sized physical hardware to integrate with the grid. If a solar and storage resource were interconnected independently it would require equipment to handle the full output of both resources. However, when the solar resource was larger than the storage resource, equipment would likely only need to accommodate the full output of the solar resource, as the solar and storage resource would be unlikely to provide maximum output at the same time. Similar to early changes to the model to accommodate stand-alone storage, additional changes were necessary to accommodate configurations with multiple technology types at the same physical location – like solar and storage.
 Day-to-day grid operations with increased storage have also changed. Part of ensuring reliable grid operations means tracking the overall amount of energy the entire battery fleet has stored (otherwise known as its ‘state of charge’), and using software to ensure that energy value is sufficient to ensure the grid will be reliable through the most challenging parts of the day, which are typically in the evening. New tools were developed for the operations team to visualize the storage fleet and override economic signals in the event there is insufficient energy for use later in the day.
The markets that are used to schedule resources to generate energy today will continue to evolve. Most organized energy markets price energy at any specific time based on the marginal cost of a resource to generate. On the California system, this has typically been a gas resource. The marginal cost for gas resources to generate can be estimated with fuel costs, generator efficiencies, and average operations and maintenance costs for similar generators.
The fundamental pricing principles for storage resources are also different. A storage resource owner cares about the difference between the price that energy was purchased at and the price energy was sold at, and not the specific price of the resource at either time. In the future, when storage resources set prices often, energy markets may need to set prices based on this “spread,” which is very different from how markets function today.
Thanks to a lot of hard work and visionary policy, battery storage has grown tremendously on the California grid and elsewhere during the last few years. We will keep working with our many partners and stakeholders across California and the West to take full advantage of this valuable resource as we continue our transition to a clean-energy power grid that is reliable, cost-effective and safe.
< Back to blog